
This webinar will explore how mortality is part of livestock production, whether in the day-to-day on the farm or after a catastrophic disease or environmental disaster. Handling and disposal of mortality in a safe and efficient manner is critical for continuity of operations. In this webinar, the presenters will present on studies evaluating different techniques of mortality management and the lessons learned from each study This presentation was originally broadcast on October 10, 2025. Continue reading “Mortality Management – From Routine to Catastrophic”
Moving Manure and Mortalities after Highly Pathogenic Avian Influenza
This webinar shares research and guidance on minimizing the risk of virus movement through manure and mortality management. This webinar also explains the roles technical advisors can play in response to an outbreak. This presentation originally broadcast on March 17, 2023. Continue reading “Moving Manure and Mortalities after Highly Pathogenic Avian Influenza”
Estimating Routine Beef and Dairy Mortality Masses Based on Systems Operation
Purpose
The day-to-day loss of animals is a fact of life all cattle producers must face and prepare for. Unfortunately, most published data of animal mortalities are for one-time, catastrophic die offs – where all the cattle on a farm must be exterminated because of disease outbreaks or natural disasters. Routine mortalities on cattle farms do not happen all at once, and mortality rates vary greatly between different life stages of animals and types of production systems.
An expert panel was convened by the Agricultural Working Group of the Chesapeake Bay Program to determine annual mortality, nitrogen and phosphorus masses produced by cow-calf, dairy and cattle on feed (feedlot) operations in the watershed. This paper concentrates on the annual mortality masses estimations determined by the panel. Cattle and Dairymen can use these values to plan for disposal of routine losses.
What Did We Do?
The panel looked, at depth, into existing production systems, and combined morality rates at different life stages, the size of animals at time of death, and the carcass composition varying with age to determine mortality and nutrient masses produced by typical cattle farms in the watershed.
The panel chose a 50-cow cow-calf operation as a model system, where cattle are on pasture 95% of the time. Under ideal conditions, each cow will yield one calf per year to be sold by year’s end. Some female calves will be retained to replace culled cows from the herd, maintaining the same general herd size. It was assumed there was no death loss of mother cows in the herd. We used USDA-APHIS (2010) data of average annual death loss of immature cattle combined with the average weight of cattle at different life-stages to determine weight of mortalities produced each year.
A total confinement beef feedlot was used to model mortalities for cattle on feed. Cattle were assumed to grow linearly with cattle placed in the feedlot at 400 to 600 pounds, and leaving at 1,000 to 1,200 pounds with an average time on lot of 120 days. Midwestern data (Vogel et al, 2015) was used to estimate annual deathrates per feedlot space at 30-day increments since placement in the feedlot.
A 100-cow milking herd was used as a reference for dairy systems. The reference farm contained 50 female calves and 50 heifers in development. Heifers are bred at 15 months and give birth around 24 months (2 years) of age. Male calves are exported from the farm as soon as possible for development as lower grade beef cattle. The reference dairy had heifers and dry cows on pasture, with the active milking herd in free-stall barns or alternative confinement for a 300-day lactation. USDA-APHIS (2016) data of average annual death loss of all types of dairy cattle was combined with the average weight of cattle at different life-stages to determine weight of mortalities produced each year.
What Have We Learned?
Figure 1 shows the estimated total weight of mortalities produced by a 50 cow, cow-calf herd each year broken down by age of animal dying. As can be seen in Figure 1, the greatest weight of mortalities occurred before calves were weaned – assuming no death of mother cows. The values in Figure 1 represent 1.52 calves born dead, 1.92 calves dying before weaning, and 0.87 head dying after weaning. This means a farmer should prepare for the loss of 2 newborn calves, 2 un-weaned calves, and one weaned steer/heifer per 50 mother cows each year. Dividing the total weight of mortalities by 50 head gives an average per cow annual mortality of 32 pounds per year.

Figure 2 shows the estimated total weight of mortalities produced by a 100-head-space feedlot. The greatest source of mortalities is steers and heifers weighing close to 700 pounds (31 to 60 days after arrival on the feedlot. Dividing the total weight of mortalities by 100 gives an average annual mortality weight of 18 pounds per head-space per year. The feedlot owner should prepare for approximately 3 animals dying each year per 100 head-space.
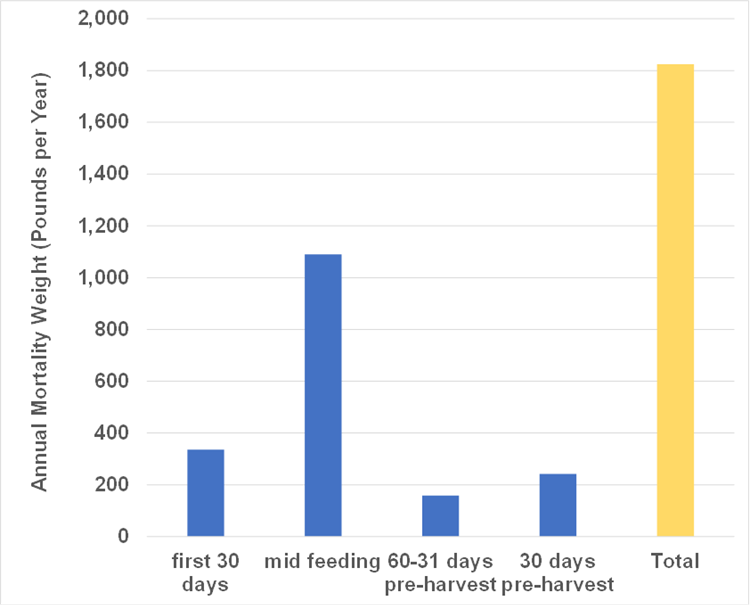
Figure 3 shows the estimated total weight of mortalities produced by a 100-cow dairy. Dividing the total weight of mortalities by 100 head gives an average annual mortality weight of 90 pounds per milking cow. The greatest source of mortalities is mature cows. Dairies should prepare for as much as 6 mature cows, 3 pre-weaned calves and heifers, and 1 weaned heifer dying each year per 100 mature cows.

Future Plans
Cattle producers can use the values estimated by this project to determine resources needed to prepare for mortalities. If burial is the preferred option, the space required to bury mortalities for the expected life of the operation; for composting, the area, and weight of carbon source required to compost; and for incineration, an incinerator capable of handling the largest animal housed on the farm.
Authors
Douglas W. Hamilton, Ph.D. P.E., Extension Waste Management Specialist, Oklahoma State University
Corresponding author email address
dhamilt@okstate.edu
Additional authors
Thomas M. Bass, Livestock Environment Associate Specialist, Montana State University; Amanda Gumbert, PhD., Water Quality Extension Specialist, University of Kentucky; Ernest Hovingh, DVM, PhD., Research Professor Extension Veterinarian, Pennsylvania State University; Mark Hutchinson, Extension Educator, University of Maine; Teng Teeh Lim, PhD, P.E., Extension Professor, University of Missouri; Sandra Means, P.E., USDA NRCS, Environmental Engineer, East National Technology Support Center (Retired); George “Bud” Malone, Malone Poultry Consulting; Jeremy Hanson, WQGIT Coordinator – STAC Research Associate, Chesapeake Research Consortium – Chesapeake Bay Program
Additional Information
Hamilton, D., Bass, T.M., Gumbert, A., Hovingh, E., Hutchinson, M., Lim, T.-T., Means, S., and G. Malone. (2021). Estimates of nutrient loads from animal mortalities and reductions associated with mortality disposal methods and Best Management Practices (BMPs) in the Chesapeake Bay Watershed (DRAFT). Edited by J. Hanson, A. Gumbert & D. Hamilton. Annapolis, MD: USEPA Chesapeake Bay Program.
USDA-APHIS (2010). Mortality of Calves and Cattle on U.S. Beef Cow-calf Operations: Info Sheet, 2010. Fort Collins, CO: USDA-APHIS.
USDA-APHIS. (2016). Dairy 2014: Health and Management Practices on US Dairy Operations, 2014. Report, 3, 62-77. Fort Collins, CO: USDA-APHIS,.
Vogel, G. J., Bokenkroger, C. D., Rutten-Ramos, S. C., & Bargen, J. L. (2015). A retrospective evaluation of animal mortality in US feedlots: rate, timing, and cause of death. Bov. Pract, 49(2), 113-123.
Acknowledgements
Funding for this project was provided by the US-EPA Chesapeake Bay Program through Virginia Polytechnic and State University EPA Grant No. CB96326201
The authors are solely responsible for the content of these proceedings. The technical information does not necessarily reflect the official position of the sponsoring agencies or institutions represented by planning committee members, and inclusion and distribution herein does not constitute an endorsement of views expressed by the same. Printed materials included herein are not refereed publications. Citations should appear as follows. EXAMPLE: Authors. 2022. Title of presentation. Waste to Worth. Oregon, OH. April 18-22, 2022. URL of this page. Accessed on: today’s date.
Estimating Routine Swine Mortality Mass based on Systems Operation
Purpose
Swine producers must dispose of the day-to-day losses of hogs and pigs on the farm. Unfortunately, most published data of swine mortalities are for one-time catastrophic events – where all the animals on a farm must be exterminated for disease outbreaks or natural disaster. Routine mortalities on hog farms do not happen all at once, and mortality rates vary greatly between different life stages of swine.
This presentation is the work of an expert panel commissioned by the US-EPA Chesapeake Bay Program to determine annual nitrogen and phosphorus masses produced on swine farms. In this presentation we will show results for annual mortality weights produced on farrow-to-finish, farrow-to-wean, nurseries, and finisher farms.
What Did We Do?
The panel looked, at depth, into existing swine production systems, and combined morality rates at different life stages, size of animals, and the age of varying carcass composition to determine mortality and nutrient masses produced during the production-flow of 25,000 market hogs. All phases of production – gestation, farrowing, nursery, and finishing – rarely occur on the same farm in modern hog production. The panel broke a single farrow-to-finish operation down into its component parts to estimate production of annual mortalities on all types of farms found in the watershed.
What Have We Learned?
Table 1 shows the expected mortality mass produced by a farrow-to-finish swine farm in Southeastern Pennsylvania with a production-flow of 25,000 market hogs per year. Annual Death Rate for all breeding stock (Sows, Gilts, Boars) was assumed to be 7.8% (USDA-APHIS, 2012). Weights at time of death are from Etienne et al. (2016). Weight of Pigs born dead were calculated using values from USDA-APHIS (2012) and Etienne et al. (2016). Mortality masses for growing stock (Weaned Pigs, Feeder Pigs, Finishers) was determined by combining an estimated growth curve for swine (Hamilton et al., 2021) and industry death rate data (Pork Checkoff, 2018). It should be noted that the Pork Checkoff data for mortalities was collected after the PEDv outbreak of the 2010s. Figure 1 shows the cumulative weekly weight of mortalities collected for a population of 1,000 pigs or hogs placed in confinement. It should also be noted that the number of pigs placed in confinement is equal to the number of pigs leaving the previous phase of production in Table 1; i.e., 27,500 weaned pigs entered the nursery each year, 9,600 died in the nursery, and 25,000 left the nursery.
| Inventory | Number Leaving Phase Each Year | Animals Dying (Head yr-1) | Animal Weight at Death (Lbs.) | Mortality Mass (lbs. yr-1) | |
|---|---|---|---|---|---|
| Sows | 1,150 | – | 90 | 450 | 40,000 |
| Gilts | 115 | – | 19 | 300 | 2,700 |
| Boars | 12 | – | 1 | 700 | 700 |
| Pigs Born Dead | 0 | – | 3,200 | 2.95 | 9,450 |
| Weaned Pigs | 2,000 | 27,500 | 9,500 | – | 30,000 |
| Feeder Pigs | 3,900 | 26,000 | 1,500 | – | 64,000 |
| Finishers | 9,700 | 25,000 | 1,400 | – | 260,000 |
| Total | 16,877 | 406,900 | |||
| Per Sow | 350 | ||||
| Per Sow Animal Unit | 790 | ||||
| Per Finisher Sold | 16 | ||||
| Per Finisher Animal Unit | 61 | ||||
| Per Inventory Unit | 24 | ||||

Breaking the numbers shown in Table 1 into smaller production units gives the estimated annual production of mortalities for all types of farms (Table 2). It should be noted that the values in Table 2 for Farrow-to-Finish and Farrow-to-Wean farms do not include afterbirth, which can be a major component of biowaste created on farms with farrowing.
| Annual Weight of Mortalities Produced (lbs. yr-1) | Farrow to Finish | Farrow to Wean | Off-Site Nursery | Finisher Farm |
| Per sow | ||||
| Per Sow (1,000 lb. Animal Units) | ||||
| Per Pig or Hog Leaving | ||||
| Per Pig or Hog Leaving (1,000 lb. Animal Unit) | ||||
| Per Feed-Space (Inventory) | ||||
| 1450 lb. sow 2270 lb. Market Hog 315 lb. Weaned Pig 455 lb. Feeder Pig |
||||
Swine producers can use the values estimated by this project to determine resources needed to prepare for mortalities.
Future Plans
Farms raising swine growing stock should size disposal methods based on the highest expected contribution of all additional life stages found on the farm (Figure 1); i.e., ~ 143 pounds per 1,000 hogs per day for finishers, 72 pounds per day per 1,000 nursery pigs. Swine breeding farms should size disposal practices based on the largest breeding head found on the farm, plus the highest expected contribution of all additional life stages found on the farm (Figure 1) plus afterbirth expected on a daily basis. These values are based on conditions in the Chesapeake Bay Watershed, but can be adapted to any locale. For instance, mortalities in the Midwest may be slightly higher because midwestern market weights are slightly higher than those in the Mid-Atlantic Region.
Authors
Douglas W. Hamilton, Ph.D., P.E., Extension Waste Management Specialist, Oklahoma State University
Corresponding author email address
Dhamilt@okstate.edu
Additional authors
Thomas M. Bass, Livestock Environment Associate Specialist, Montana State University; Amanda Gumbert, PhD., Water Quality Extension Specialist, University of Kentucky; Ernest Hovingh, DVM, PhD., Research Professor Extension Veterinarian, Pennsylvania State University; Mark Hutchinson, Extension Educator, University of Maine; Teng Teeh Lim, PhD, P.E., Extension Professor, University of Missouri; Sandra Means, P.E., USDA NRCS, Environmental Engineer, East National Technology Support Center (Retired); George “Bud” Malone, Malone Poultry Consulting; Jeremy Hanson, WQGIT Coordinator – STAC Research Associate, Chesapeake Research Consortium – Chesapeake Bay Program
Additional Information
Etienne, M., Meinen, R., Kristoff, J., Sexton, T., Long, B., & Dubin, M. (2016). Recommendations to Estimate Swine Nutrient Generation in the Phase 6 Chesapeake Bay Program Watershed Model. Annapolis, MD: Chesapeake Bay Program.
Hamilton, D., Bass, T.M., Gumbert, A., Hovingh, E., Hutchinson, M., Lim, T.-T., Means, S., and G. Malone. (2021). Estimates of nutrient loads from animal mortalities and reductions associated with mortality disposal methods and Best Management Practices (BMPs) in the Chesapeake Bay Watershed (DRAFT). Edited by J. Hanson, A. Gumbert & D. Hamilton. Annapolis, MD: USEPA Chesapeake Bay Program.
Pork Checkoff. (2018). Checkoff’s Pork Industry Productivity Analysis. Des Moines, IA: National Pork Board. https://www.pork.org/facts/stats/industry-benchmarks/#AverageConventionalFinisherProductivity. Accessed October 1, 2019.
USDA-APHIS. (2012a). Swine 2012 Part I: Baseline Reference of Swine Health and Management in the United States, 2012. Washington, DC: United States Department of Agriculture, Animal and Plant Health Inspection Service. https://www.aphis.usda.gov/animal_health/nahms/swine/downloads/swine2012/Swine2012_dr_PartI.pdf. Accessed June 25, 2019.
Acknowledgements
This project was funded by the US EPA Chesapeake Bay Program through Virginia Polytechnical and State University. EPA Grant No. CB96326201
The authors are solely responsible for the content of these proceedings. The technical information does not necessarily reflect the official position of the sponsoring agencies or institutions represented by planning committee members, and inclusion and distribution herein does not constitute an endorsement of views expressed by the same. Printed materials included herein are not refereed publications. Citations should appear as follows. EXAMPLE: Authors. 2022. Title of presentation. Waste to Worth. Oregon, OH. April 18-22, 2022. URL of this page. Accessed on: today’s date.
Estimating Routine Poultry Mortality Masses based on Systems Operation
Purpose
Current design standards and operation guidelines for poultry mortality disposal methods do not adequately account for the non-steady production of carcasses on poultry farms. A common method is to assume poultry die at a constant annual death rate at the mean weight for a placement of birds. While this method may be an accurate estimation for relatively steady-state operations such as egg laying, it grossly overestimates mortality production at the beginning of a grow-out cycle and underestimates mortality production towards the end of a grow-out cycle for meat production operations such as broilers and turkeys.
An expert panel was convened by the Agricultural Working Group of the Chesapeake Bay Program to determine annual mortality, nitrogen and phosphorus masses produced by broiler, turkey, and laying operations in the watershed. This paper concentrates on the mortality masses estimations determined by the panel on a weekly and grow-out basis, using broilers as an example.
What Did We Do?
The weight of mortalities produced each week was determined by combining the expected weekly death rate with growth pattern for broilers. In other words, weight of mortalities collected each week in a grow-out period is equal to number of birds dying during the week times the weight of birds at the time of death. Mortalities collected for an entire grow-out period are then calculated by summing the weekly values. This method can be used to determine mortalities produced for any market weight of bird because market weight is determined by the length of grow-out – all modern commercial broilers having the same basic growth pattern.
What Have We Learned?
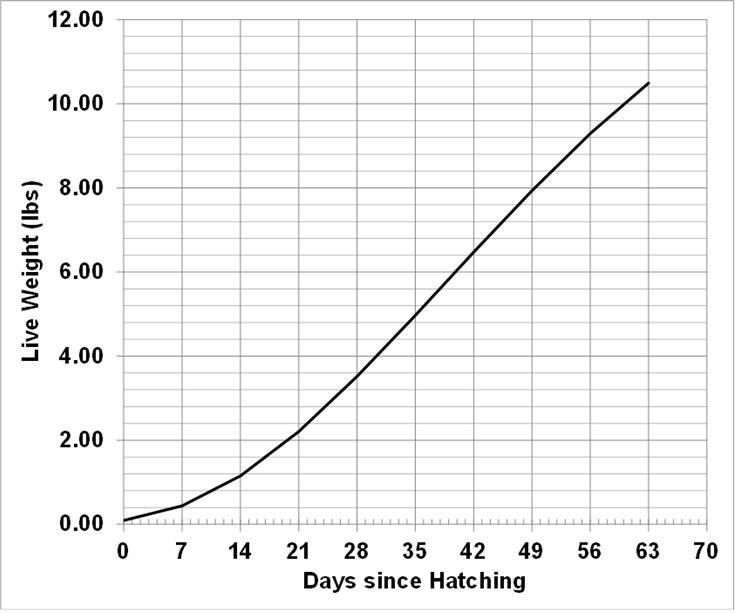
Figure 1 illustrates the average growth pattern of broilers using company-provided data for genetic lines commonly used in the Delmarva region. Figure 2 shows weekly mortalities for broilers based on a data set used by the USDA-NRCS in Delaware to design capacity of mortality freezers and industry data provided confidentially to the retired Delaware Extension Poultry Specialist. This death rate data is for antibiotic-free birds. Combining figures 1 and 2 gives the expected weight of mortalities collected by a farmer each week during grow-out per 1,000 broilers placed in a building (Figure 3). Figure 3 shows that weight of mortalities increases each week at an exponential rate with a high degree of correlation (R2 = 0.975).
Adding the weight of mortalities collected in one week to those collected in previous weeks gives the total weight collected up to date, or the cumulative weight of mortalities. Since the time required to raise a bird to a certain market weight is known (Figure 1), we can plot the cumulative weight of mortalities during a grow-out period versus market weight of broilers (Figure 4).
The estimated weight of mortalities collected each week and the cumulative weight of mortalities collected over a grow out period can be used to better design and operate mortality disposal methods.


Future Plans
A poultry farmer can use the maximum mass collected each week to accurately size a mortality incinerator or estimate the number of dead birds she will have to cover every day in a mortality composter. Multi-bin composters are usually designed to hold the entire mass of mortalities expected in a grow-out period – plus additional high-carbon and cover material. Designing for this capacity is now possible with an accurate estimate of mortality weight collected per grow-out period.
Authors
Douglas W. Hamilton, Ph.D., P.E., Extension Waste Management Specialist, Oklahoma State University
Corresponding author email address
dhamilt@okstate.edu
Additional authors
Thomas M. Bass, Livestock Environment Associate Specialist, Montana State University; Amanda Gumbert, PhD., Water Quality Extension Specialist, University of Kentucky; Ernest Hovingh, DVM, PhD., Research Professor Extension Veterinarian, Pennsylvania State University; Mark Hutchinson, Extension Educator, University of Maine; Teng Teeh Lim, PhD, P.E., Extension Professor, University of Missouri; Sandra Means, P.E., USDA NRCS, Environmental Engineer, East National Technology Support Center (Retired); George “Bud” Malone, Malone Poultry Consulting; Jeremy Hanson, WQGIT Coordinator – STAC Research Associate, Chesapeake Research Consortium – Chesapeake Bay Program
Additional Information
Hamilton, D., Bass, T.M., Gumbert, A., Hovingh, E., Hutchinson, M., Lim, T.-T., Means, S., and G. Malone. (2021). Estimates of nutrient loads from animal mortalities and reductions associated with mortality disposal methods and Best Management Practices (BMPs) in the Chesapeake Bay Watershed. Edited by J. Hanson, A. Gumbert & D. Hamilton. Annapolis MD: USEPA, Chesapeake Bay Program (DRAFT).
Acknowledgements
Funding for this project was provided by the US-EPA Chesapeake Bay Program through Virginia Polytechnic and State University EPA Grant No. CB96326201
The authors are solely responsible for the content of these proceedings. The technical information does not necessarily reflect the official position of the sponsoring agencies or institutions represented by planning committee members, and inclusion and distribution herein does not constitute an endorsement of views expressed by the same. Printed materials included herein are not refereed publications. Citations should appear as follows. EXAMPLE: Authors. 2022. Title of presentation. Waste to Worth. Oregon, OH. April 18-22, 2022. URL of this page. Accessed on: today’s date.
Livestock Mortality Composting – Beyond the Basics Part 2
Topics for this webcast include: fate of euthanasia drugs during composting; can composting destroy prions; and mortality composting worker safety considerations.This presentation was originally broadcast on September 19, 2014. More… Continue reading “Livestock Mortality Composting – Beyond the Basics Part 2”
Livestock Mortality Composting – Beyond the Basics Part 1
The topics for this webcast include: pile characteristics for effective composting, management and environmental considerations when siting and managing composting facilities; mortality compost nutrients for on-farm use; and teaching the benefits of mortality composting to producers. This presentation was originally broadcast on August 15, 2014. More… Continue reading “Livestock Mortality Composting – Beyond the Basics Part 1”