Methodologies for In-situ Characterization of the Impact of Equine Manure Management Practices on Water Quality

Nutrient loading of nitrogen and phosphorus in runoff and water leachate threatens Florida’s environmental and water resources. Of those nutrients, nitrate (NO3) nitrogen is highly soluble and not strongly bound to soils. Consequently, nitrate is highly mobile and subject to leaching losses when both nitrate content and water movement are high.

Due to Florida’s sandy soils and humid subtropical climate, nitrate losses from leaching and runoff are high and creates concerns for animal waste handling1. Mitigating nutrient loading to ground and surface waters through proper management of horse manure and stall waste can help protect water quality. However, information regarding the relationship between on-farm equine manure management practices and water quality remains limited.

What did we do

The objective of this study was to address waste management challenges on Florida equine operations by developing methodologies for in-situ characterization of nutrient profile of pore and surface water runoff from stockpiled equine waste and waste that has been effectively composted. Two small-scale horse properties with 2-8 horses managed on 4-9 acres, and 1 larger scale operation with up to 70 horses managed on 300+ acres located within the Rainbow Springs Basin Management Action Plan (BMAP) were enlisted for the project. Lysimeters (soils enclosed in suitable containers and exposed to natural surroundings to capture leachates) were constructed of PVC and non-woven filter fabric suspended between a 4” and 2” PVC reducer with a total length of 24” and deployed 6” below ground2 (Figure 1).

Figure 1. Design details and image of lysimeters used for leachate collection. Each lysimeter was equipped with silicone tubing for effluent collection.


One hole was drilled between the 4” and 2” PVC reducer to insert the sampling lines to the bottom well of the lysimeter and secured with duct tape. For each lysimeter installation, the top 6” of the soil profile was removed using a 6” diameter core ring to ensure the soil profile was undisturbed. The remaining 6”-12” depth of soil was composited and repacked into the lysimeter container, layer by layer. An auger was used to achieve a total depth of 30 inches from the surface to secure the lysimeter in the ground. Following lysimeter installation, the top 6” of intact soil was replaced above the lysimeter and all lines were buried 6” in the soil and channeled to one central location. The collection trenches were fabricated from vinyl gutter material filled with river rock (pre-rinsed for removal of iron and sediment) and installed up and downgradient at stockpile systems and at the opening of each compost bin. A 5-gallon bucket attached to the downgradient gutter served as the water collection reservoir (Figure 2).

three bin compost structure
Figure 2a) Three bin manure compost structure
Manure stockpile structure
Figure 2b) Manure stockpile structure

Figure 2. Placement of runoff collection trenches within the (a) compost and (b) stockpile manure bin structures. The trenches intercept any runoff during heavy rainfall and drain into a 5-gallon bucket. Once the bilge pump below the bucket is adequately submerged, the water is evacuated to the secondary collection bucket for sampling.

Figure 3. Arrangement of the eight peristaltic pumps on a hand truck dolly for ease of transport. The pumps with connected clear silicone tubing are attached to the lysimeter collection line for leachate collection.

For the lysimeter leachate sampling, eight peristaltic pumps were arranged in an array of 4 pumps wired together and controlled by an on/off switch connected to a sampling tube of the lysimeter (Figure 3).
A grid of 4-5 lysimeters were placed under each compost bin for collection and compositing of samples. The lysimeters for the stockpile were arranged in a 3×3 grid across the stockpile bin with each row (3 lysimeters) representing a composited sample (Figure 4).

Figure 4. Pre-installation and arrangement (3x3) of the lysimeters within the manure stockpile structure.
Figure 4. Pre-installation and arrangement (3×3) of the lysimeters within the manure stockpile structure.

The lysimeters were purged with deionized water after two weeks or after a heavy rainfall event prior to the first sample collection.  For water runoff collection, a 12 volt (500gph) automatic bilge pump, powered by a marine battery, was used to pump water from the collection bucket to a 5-gallon sampling bucket. A 10% subsample was collected with the remaining 90% expelled to the ground surface using a 2-way restricted-flow Y connector. Runoff samples (collected immediately post rainfall event) and leachate samples (collected biweekly) were acidified and stored in scintillation vials at 4oC for nutrient analysis (NO-X, NH4+, TKN, and TP).

Outcome

 The lysimeter and water runoff collection trench construction provide a cost-effective, easily deployed system for characterizing nutrient loading in leachate and surface runoff from manure storage and composting sites. The system has been successful in collecting samples for nutrient analysis, however, a few challenges have also been identified. (1) The runoff system requires periodic maintenance, primarily cleaning (re-rinsing) the gutter and river rock to remove any material lying above the trench. (2) Also, the Y connectors require calibration every month to remove leaf litter and other debris to allow water flow through the valves to ensure a 10% subsample is collected. (3) Suspended materials (fine soil or organic matter) have been observed in lysimeter leachate samples and runoff collection trenches. (4) A subset of lysimeter samples have emitted a sulfur odor when adverse weather conditions or other events delay sampling beyond the target 2-week interval.

Future plans

To assess potential nitrate losses due to sample retention time, the lysimeter effluent will be sampled at specific intervals (day 1, day 3, day 6, day 9, day 14) during a period of no rainfall. These measurements should help determine the optimal time interval for sample collection for analysis of nitrate levels.  Additionally, runoff samples are being collected for analysis of fecal coliform and E. coli. The methodologies employed in this field level study represent an important step towards an improved understanding of the impact of manure management BMPs on water quality.

Corresponding author, title, and affiliation

Agustin Francisco, Graduate Student, University of Florida

Corresponding author email

afran@ufl.edu

Other authors

Carissa Wickens, State Extension Horse Specialist, University of Florida Mark Clark, Wetland Ecologist, University of Florida; Caitlin Bainum, Extension Agent, Florida Cooperative Extension, Marion County, Ocala, Florida; Megan Mann, Extension Agent, Florida Cooperative Extension, Lake County, Tavares, FL

Additional information

1FDEP. 2013. Small Scale Horse Operations: Best Management Practices for water resource protection in Florida.

2Bergstrom, L. 1990. Use of lysimeters to estimate leaching of pesticides in agriculture soils. J. Environmental Pollution. 67:325-347

Additional information regarding this project is available by contacting Carissa Wickens (cwickens@ufl.edu), or Agustin Francisco (afran@ufl.edu).

Acknowledgements

The authors wish to thank the Southwest Florida Water Management District (SWFWMD) for funding support, the farm site cooperators Dave and Deb Kane, Jim and Merry Lee Bain, and Eli and Jeff McGuire. We would also like to thank Carol Vasco, Ellen Rankins, Ana Margarita Arias, Anastasia Reif for their assistance with site installation and data collection.

The authors are solely responsible for the content of these proceedings. The technical information does not necessarily reflect the official position of the sponsoring agencies or institutions represented by planning committee members, and inclusion and distribution herein does not constitute an endorsement of views expressed by the same. Printed materials included herein are not refereed publications. Citations should appear as follows. EXAMPLE: Authors. 2019. Title of presentation. Waste to Worth. Minneapolis, MN. April 22-26, 2019. URL of this page. Accessed on: today’s date.

Field Technology & Water Quality Outreach

Proceedings Home | W2W Home waste to worth 2017 logo

Purpose

In 2015, Washington State Department of Agriculture (WSDA) partnered with local and state agencies to help identify potential sources of fecal coliform bacteria that were impacting shellfish beds in northwest Washington.  WSDA and Pollution Identification and Correction (PIC) program partners began collecting ambient, as well as rain-driven, source identification water samples. Large watersheds with multiple sub-basins, changing weather and field conditions, and recent nutrient applications, meant new sites were added almost daily. The increased sampling created an avalanche of new data. With this data, we needed to figure out how to share it in a way that was timely, clear and could motivate change. Picture of water quality data via spreadsheet, graphs, and maps.

Conveying complex water quality results to a broad audience can be challenging. Previously, water quality data would be shared with the public and partners through spreadsheets or graphs via email, meetings or quarterly updates. However, the data that was being shared was often too late or too overwhelming to link locations, weather or field conditions to water quality. Even though plenty of data was available, it was difficult for it to have meaningful context to the general public.

Ease of access to results can help inform landowners of hot spots near their home, it can link recent weather and their own land management practices with water quality, as well as inform and influence decision-making.

What Did We Do?

Using basic GIS tools we created an interactive map, to share recent water quality results. The map is available on smartphones, tablets and personal computers, displaying near-real-time results from multiple agencies.  Viewers can access the map 24 hours a day, 7 days a week.

We have noticed increPicture of basic GIS tool.
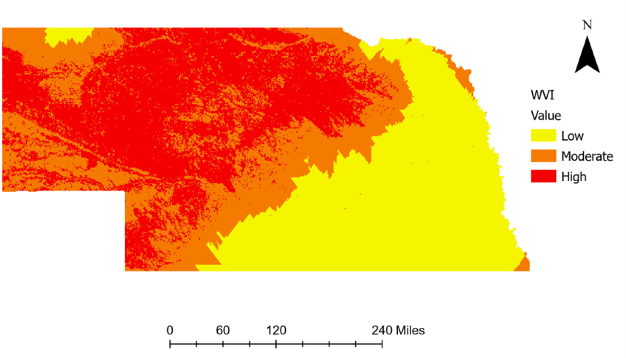
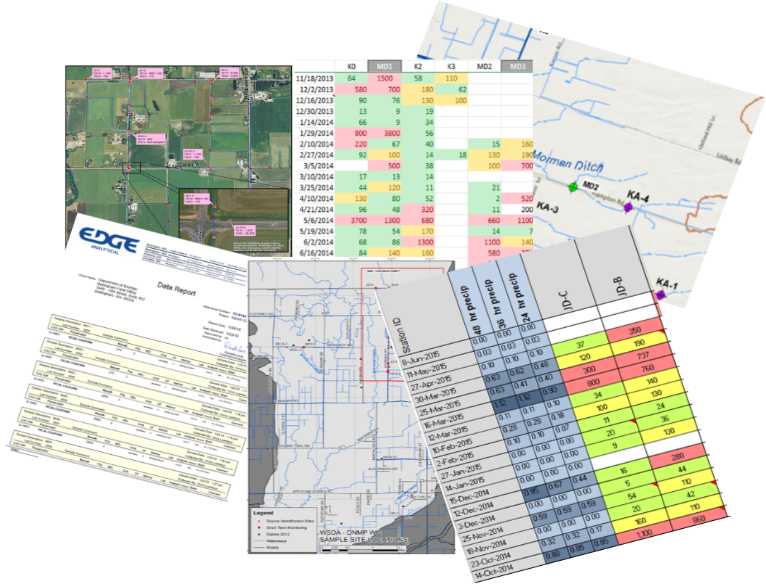
ased engagement from our dairy producers, with many checking the results map regularly for updates. The map is symbolized with graduated stop light symbology, with poor water quality shown in red and good in green. If they see a red dot or “hot spot” in their neighborhood they may stop us on the street, send an email, or call with ideas or observations of what they believe may have influenced water quality. It has opened the door to conversations and partnerships in identifying and correcting possible influences from their farm.

The map also contains historic results data for each site, which can show changes in water quality. It allows the viewer to evaluate if the results are the norm or an anomaly. “Are high results after a rainfall event or when my animals are on that pasture?”

The online map has also increased engagement with our Canadian neighbors to the north. By collecting samples at the US/Canadian border we have been able to map streams where elevated bacteria levels come across the border. This has created an opportunity to partner with our Canadian counterparts to continue to identify and correct sources.

What Have We Learned?

You do not need to be a GIS professional to create an app like this for your organization. Learning the system and fine-tuning the web application can take some time, but it is well worth the investment. GIS skills derived from this project have proven invaluable as the app transfers to other areas of non-point work.  The web application has created great efficiencies in collaboration, allowing field staff to quickly evaluate water quality trends in order to spend their time where it is most needed. The application has also provided transparency to the public regarding our field work, demonstrating why we are sampling particular areas.

From producer surveys, we have learned that viewers prefer a one-stop portal for information. Viewers are less concerned about what agency collected the data as they are interested in what the data says. This includes recent, as well as historical water quality data, field observations; such as wildlife or livestock presence or other potential sources. Also, a brief weekly overview of conditions, observations and/or trends has been requested to provide additional context.

Future Plans

The ease and efficiency of the mobile mapping and data sharing has opened the door to other collaborative projects. Currently we are developing a “Nutrient Tracker” application that allows all PIC partners to easily update a map from the field. The map allows the user to log recent field applications of manure. Using polygons to draw the area on the field, staff can note the date nutrients were identified, type of application, proximity to surface water, if it was a low-, medium- or high-risk application, if follow-up is warranted, and what agency would be the lead contact. This is a helpful tool in learning how producers utilize nutrients, to refer properties of concern to the appropriate agency, and to evaluate recent water quality results against known applications.

Developing another outreach tool, WSDA is collecting 5 years of fall soil nitrate tests from all dairy fields in Washington State. The goal is to create a visual representation of soil data, to demonstrate to producers how nitrate levels on fields have changed from year to year, and to easily identify areas that need to be re-evaluated when making nutrient application decisions.

As part of a collaborative Pollution Identification and Correction (PIC) group, we would like to create a “Story Map” that details the current situation, why it is a concern, explain potential sources and what steps can be taken at an individual level to make a difference. A map that visually demonstrates where the watersheds are and how local neighborhoods really do connect to people 7 miles downstream.  An interactive map that not only shows sampling locations, but allows the viewer to drill down deeper for more information about the focus areas, such as pop-ups that explain what fecal coliform bacteria are and what factors can increase bacteria levels. We envision a multi-layer map that includes 24-hour rainfall, river rise, and shellfish bed closures. This interactive map will also share success stories as well as on-going efforts.

Author

Kerri Love, Dairy Nutrient Inspector, Dairy Nutrient Management Program, Washington State Department of Agriculture

klove@agr.wa.gov

Additional Information

Results Map Link: http://arcg.is/1Q9tF48

Washington Shellfish Initiative: http://www.governor.wa.gov/issues/issues/energy-environment/shellfish

Mobile Mapping Technology presentation by Michael Isensee, 2016 National CAFO Roundtable

Sharing the Data: Interactive Maps Provide Rapid Feedback on Recent Water Quality and Incite Change by Educating the Public, Kyrre Flege, Washington State Department of Agriculture and Jessica Kirkpatrick, Washington State Department of Ecology,  2016 National Non-Point Source Monitoring Workshop

Whatcom County PIC Program: http://www.whatcomcounty.us/1072/Water-Quality

Skagit County, Clean Samish Initiative: https://www.skagitcounty.net/Departments/PublicWorksCleanWater/cleansamish.htm

Lower Stillguamish PIC Program: http://snohomishcountywa.gov/3344/Lower-Stilly-PIC-Program

GIS Web Applications: http://doc.arcgis.com/en/web-appbuilder/

Acknowledgements

The web application was a collaborative project developed by Kyrre Flege, Washington State Department of Agriculture and Jessica Kirkpatrick, Washington State Department of Ecology.

The authors are solely responsible for the content of these proceedings. The technical information does not necessarily reflect the official position of the sponsoring agencies or institutions represented by planning committee members, and inclusion and distribution herein does not constitute an endorsement of views expressed by the same. Printed materials included herein are not refereed publications. Citations should appear as follows. EXAMPLE: Authors. 2017. Title of presentation. Waste to Worth: Spreading Science and Solutions. Cary, NC. April 18-21, 2017. URL of this page. Accessed on: today’s date.

Soil Nitrate Testing Protocol Development for Lands Receiving Injected Manure

Injection of liquid manure provides a number of benefits to the environment and cropping systems. Manure placement under the soil surface conserves nitrogen by decreasing ammonia loss. Injection can be conducted in a manner consistent with no-till farming practices resulting in greater conservation of both soil and manure nutrients. Thus the value of manure to the crop is increased.

Traditional soil nitrate testing protocol recommendations were developed on lands that received evenly distributed broadcast manure applications. However, the banding of manure during injection presents a challenge for soil testing. Random placement of soil probes in banded fields could result in artificially high or low nitrate analysis depending on the sampling distance from manure bands.

Many states recommend such nitrate testing when the corn is about 12 inches tall. In the weeks following the soil test the crop will grow quickly with high N demand. Soil testing at this time allows the producer to determine if it will be profitable to sidedress the crop with an additional N source. For example, in Pennsylvania, the Pre-Sidedress Nitrate Test (PSNT) is utilized to measure soil nitrate when corn is around the six-leaf stage (about 12-18 inches). Sidedress nitrogen need is calculated using the soil nitrate test level, expected yield, and nitrogen available from previous legumes or manure applications.

Research was conducted to explore nitrate distribution in a two dimensional view perpendicular to manure injection bands. In the proposed presentation the research results and new soil testing protocol for early-season nitrate will be discussed. This work provides an excellent tool to assure economic and environmental optimization of manure nitrogen.

What is the Pre-Sidedress Nitrate Test (PSNT)?

In the mid-Atlantic region the Pre-Sidedress Nitrate Test (PSNT) is an accepted tool for measurement of Nitrogen availability to a growing corn crop. The test is conducted when corn reaches the six-leaf stage by taking a number of twelve-inch deep soil samples. The samples are quickly dried or frozen to halt microbial N transformations and sent to a soils laboratory. A measure of soil Nitrate (NO3) level provides an indication whether the soil contains enough N to sustain maximum yield through the remainder of the growing season. The PSNT provides guidance to determine supplemental N fertilizer rates needed for soil with a low measured NO3 level. The PSNT becomes suspect on grounds receiving manure injection. Random sampling near manure bands may give artificial confidence in NO3 availability, while samples away from bands may indicate unnecessary need for commercial fertilizer.

The purpose of this work was to determine a PSNT sampling protocol for soils receiving injected manure.

What did we do?

Dairy manure was injected prior to planting of corn using shallow-disc injection spaced at 30 inches. When corn was at the six-leaf stage a ‘Monolith’ soil sampler was used to remove blocks of soil in a perpendicular direction to manure injection bands. Twelve-inch deep PSNT soil cores were systematically removed every inch across the thirty-inch sample. Each of these was evaluated individually for NO3 concentration. Composite cores of all thirty samples were also evaluated. To provide comparison, similar samples were attained in Monolith samples from Control (no manure) and Broadcast Manure plots.

What have we learned?

Others have suggested pairing manure samples to attain an average for manure-injected soils, with one sample attained in the band and one between bands. In our study, analysis of NO3 levels in a perpendicular direction to travel of manure injection equipment demonstrated concentrations in a sine wave pattern with higher concentrations located near the injection bands. Further analysis showed that five samples taken at any positions perpendicular to the manure band, and spaced six inches apart provide a reliable and repeatable sampling method. Four sets of samples taken in this manner (20 soil cores in total) were statistically better at predicting soil Nitrate level then ten paired soil sample sets (20 soil cores in total). Using this sampling protocol, marking of manure bands is not necessary. Testing can be performed at random locations in the field.

Future Plans

Manure injection conserves Nitrogen in comparison to broadcast application. Some manure injection implements can be used with minimal soil surface disturbance that is acceptable within no-till guidelines. In the mid-Atlantic region, manure injection is expected to become more common as economics and regulations drive increased Nitrogen conservation. Release of this PSNT soil sampling protocol will allow producers to accurately manage N in growing corn. The protocol will assist in adoption of manure injection utilization by providing a tool by which producers can gain confidence and knowledge centered on their manure nutrient management. Utilization of this sampling protocol will advance environmental goals in water and air quality.

Authors

Robert Meinen, Senior Extension Associate, Penn State University rjm134@psu.edu

Douglas Beegle, Peter Kleinman, Heather Karsten, Glenna Malcolm

Additional information

Penn State NorthEast SARE Sustainable Dairy Cropping Systems Project

http://plantscience.psu.edu/research/areas/crop-ecology-and-management/c…

Video of research manure injection system

http://extension.psu.edu/plants/crops/cropping-systems/video/sdmi-1

Acknowledgements

NRCS CIG and NESARE grants supported this work.

The authors are solely responsible for the content of these proceedings. The technical information does not necessarily reflect the official position of the sponsoring agencies or institutions represented by planning committee members, and inclusion and distribution herein does not constitute an endorsement of views expressed by the same. Printed materials included herein are not refereed publications. Citations should appear as follows. EXAMPLE: Authors. 2015. Title of presentation. Waste to Worth: Spreading Science and Solutions. Seattle, WA. March 31-April 3, 2015. URL of this page. Accessed on: today’s date.

Preliminary Technical Evaluation of Three Reports by U.S. Environmental Protection Agency Region 10 on Nitrate in Water Wells, Yakima River Basin, Yakima County, Washington

The Yakima Valley is a large agricultural area where there are multiple potential sources of nitrate in groundwater.  Potential sources are intermingled, i.e., homes with septic systems are on the same properties as the dairies or adjacent to farms and/or dairies.  In 2012, Region 10 of the US Environmental Protection Agency undertook a study to source track and identify nitrogen sources in the Yakima River Basin as part of an enforcement effort focusing on dairies. EPA position was that the targeted dairies did not properly apply nutrients to land application fields at agronomic rates, resulting in groundwater contamination.  The study area is underlain by 3 aquifers, a shallow perched aquifer likely related to irrigation return flows, an alluvial aquifer and an underlying basalt aquifer.  The three aquifers are hydrologically connected either through natural pathways or through wells completed into more than one aquifer.  Because none of the potential sources are isolated, source tracking requires an in-depth knowledge of aquifer properties such as aquifer thickness, groundwater flow direction, hydraulic conductivity, and vertical leakance in addition to understanding localized effects of ditches, drains and production wells on groundwater flow.  EPA focused on groundwater chemistry, assuming that indicators such as pesticides and other trace organic compounds would tie the groundwater nitrate to a specific source.  EPA’s study failed to yield clear indicators pointing to specific sources and did not collect hydrologic data for its 2012 report to gain a detailed understanding of aquifer properties.  This presentation will address how to accurately characterize the hydrogeology below dairy production areas and land application fields, and how to proactively manage nutrients to protect dairies from unsubstantiated enforcement actions

Purpose

Glorieta Geoscience, Inc. (GGI) was contracted by the Washington State Diary federation and Dairy Producers of New Mexico to conduct a technical evaluation of three reports prepared by U.S. Environmental Protection Agency Region 10 (EPA) to identify sources of nitrate in the Yakima Valley.

What did we do?

arial photoWe conducted a scientific peer review of EPA’s project design, methodologies, compliance with EPA’s own Quality Assurance Project Plan/Quality Control procedures, evaluated the overall study design/site selection as described in the three (3) reports, addressed specific data collection concerns and analyzed the results and conclusions drawn from the data as described in the main body of the Report to determine if EPA’s methodology and conclusions were supported by data.  We analyzed the overall study design, hydrogeological characterizations, well completions, sample collection (green water, soils and ground water), geochemistry, stable isotopic and organic compound analyses and EPA’s conclusions from these efforts.

What have we learned?

EPA did not achieve their objectives because the aquifer properties such as groundwater flow direction were not evaluated, not all potential sources at each study site were evaluated and mapped and trace organic compound analyses did not yield reliable data or were inconclusive. As a consequence, EPA did not produce a study with reproducible results that supports its conclusions that specific sources of nitrate in domestic wells the Yakima Valley can be identified.

We learned that EPA does not follow their own QAPP and Quality Assurance protocols and that there was significant lack of supporting technical information for EPA to arrive at the conclusions presented in the report. 

Author  

Jay Lazarus, Glorieta Geosciences lazarus@glorietageo.com

The authors are solely responsible for the content of these proceedings. The technical information does not necessarily reflect the official position of the sponsoring agencies or institutions represented by planning committee members, and inclusion and distribution herein does not constitute an endorsement of views expressed by the same. Printed materials included herein are not refereed publications. Citations should appear as follows. EXAMPLE: Authors. 2015. Title of presentation. Waste to Worth: Spreading Science and Solutions. Seattle, WA. March 31-April 3, 2015. URL of this page. Accessed on: today’s date.

Fate of Manure Nitrogen Applied for Grass Silage Production

Purpose

Previous research conducted in western Washington State has demonstrated that when manure N is applied at rates greater than needed for grass uptake, excess N in soil in the form of nitrate-N can leach to shallow groundwater during the months of high rainfall. In a prior study, it was evident that tillage and reseeding of the cropland was a contributor to loss of nitrate–N from soil to underlying groundwater. The objective of this study was to characterize the effect of re-seeding of cropland using minimum tillage and conventional tillage methods on crop uptake of nitrogen, soil nitrate-N concentration, nitrate concentration in shallow ground water underlying the field, and the relationships between these matrices.         

What did we do? 

A two- year study was initiated in 2009 to study the fate and transport of nitrogen from dairy manure when applied to cropland that was reseeded to grass for silage production. One-half of a 22- acre grass field was prepared with conventional tillage, and one-half was prepared with minimum tillage in May of 2009.  In 2009, after the grass was reseeded, the conventional till grass was harvested 2 times, and the minimum till grass was harvested 3 times. Due to poor stand establishment, the minimum till area received minimum till treatment again in 2010. In 2010, the conventional till grass was harvested 4 times, and the minimum till grass was harvested twice.  

What we have learned? 

Total nitrogen harvested for minimum till and conventional till respectively, were: 310 and 298 lbs/acre (2009), and 425 and 477 lbs/acre (2010).  Total nitrogen applied for minimum till and conventional till, respectively, were: 523 and 440 lbs/acre (2009), and 697 and 697 lbs/acre (2010).  Soil nitrate-N for the minimum till plot remained below 30 ppm in 2009 except on one occasion. Soil nitrate for the minimum till plot was observed to increase to 40 and 60 ppm in 2010. Soil nitrate-N for the conventional till plot increased to 60 ppm in 2009, and 35 ppm in 2010.  There was no evidence of a difference in groundwater nitrate-N due to the type of tillage treatment. Groundwater nitrate-N concentrations on the whole were higher in monitoring wells after both tillage methods were applied. Results from this case study indicated that the type of tillage had an impact on the timing of increases in soil nitrate. However, variability in denitrification conditions in monitoring wells did not allow a determination of whether one method had more of an impact on groundwater nitrate than the other. (See Figures 1 and 2.)    

Figure 1. Soil nitrate concentrations during the study period.

Figure 2. Average shallow ground water nitrate concentrations during the study period. Green arrows indicates tillage events.

Authors

Joe Harrison*, Professor and Nutrient Management Specialist, Washington State University, jhharrison@wsu.edu

Barb Carey, Environmental Assessment Program Washington Department of Ecology; and Lynn VanWieringen, Research Associate, Washington State University.

*presenter        

Future plans

 A study has been proposed to characterize the effect of converting the grass field to corn silage and determine uptake of nitrogen, soil nitrate-N concentrations, nitrate concentrations in shallow ground water underlying the field, and the relationships between these matrices. 

Additional information

Joe Harrison       jhharrison@wsu.edu     Joe Harrison, jhharrison, 253-445-4638, Washington State University

The authors are solely responsible for the content of these proceedings. The technical information does not necessarily reflect the official position of the sponsoring agencies or institutions represented by planning committee members, and inclusion and distribution herein does not constitute an endorsement of views expressed by the same. Printed materials included herein are not refereed publications. Citations should appear as follows. EXAMPLE: Authors. 2015. Title of presentation. Waste to Worth: Spreading Science and Solutions. Seattle, WA. March 31-April 3, 2015. URL of this page. Accessed on: today’s date.

Swine Manure & Aqua-ammonia Nitrogen Application Timing on Subsurface Drainage Water

Waste to Worth: Spreading science and solutions logoWaste to Worth home | More proceedings….

Abstract

In Iowa and many other Midwestern states, excess water is removed artificially through subsurface drainage systems.  While these drainage systems are vital for crop production, nitrogen (N) added as manure or commercial fertilizer, or derived from soil organic matter, can be carried as nitrate-nitrogen (NO3-N) to downstream water bodies.  A five-year, five-replication, field study was conducted in north-central Iowa with the objective to determine the influence of seasonal N application as ammonia or liquid swine manure on flow-weighted NO3-N concentrations and losses in subsurface drainage water and crop yields in a corn-soybean rotation.  Four aqua-ammonia N treatments (150 or 225 lb-N/acre applied for corn in late fall or as an early season side-dress) and three manure treatments (200 lb-N/acre for corn in late fall or spring or 150 lb-N/acre  in the fall for both corn and soybean) were imposed on subsurface drained, continuous-flow-monitored plots. Four-year average flow-weighted NO3-N concentrations measured in drainage water were ranked: spring aqua-ammonia 225 (23 ppm) = fall manure 150 every year (23 ppm) > fall aqua-ammonia 225 (19ppm) = spring manure 200 (18 ppm) = fall manure 200 (17 ppm) > spring aqua-ammonia 150 (15 ppm) = fall aqua-ammonia 150 (14 ppm).  Corn yields were significantly greater (p=0.05) for the spring and fall manure-200 rates than for non-manure treatments. Soybean yields were significantly greater (p=0.05) for the treatments with a spring nitrogen application to the previous corn crop. Related: LPELC Manure Nutrient Management resources

Check Out These Other Presentations About Tile Drainage

Tile Drainage Field Day

Use of Filters in Drainage Control Structures

New Technologies for Drainage Water Management

Role of Drainage Depth and Intensity on Nutrient Loss

Why Study Sub-Surface Drainage and Manure Application?

Subsurface agricultural drainage has allowed for enhanced crop production in many areas of the world including the upper Midwest, United States. However, the presence of nitrate-nitrogen (nitrate-N) in subsurface tile drainage water is a topic of intense scrutiny due to several water quality issues. With the growing concern for the health of the Gulf of Mexico and local water quality concerns, there is a need to understand how recommended nitrogen management practices, such as through nitrogen rate and timing, impact nitrate-N concentrations from subsurface drainage systems.  The objective of this presentation is to summarize results of studies from Iowa that have documented the impact of nitrogen application rate and timing on tile drainage nitrate loss. 

What Did We Do?

The field experimental site was located near Gilmore City in Pocahontas County, IA. In the fall of 1999, seven treatments were initiated on 35 plots at the site to determine the effect of N source, rate, and application timing on crop yield and subsurface drainage water quality in a corn and soybean (CS) rotation. Two fertilizer N rates (168 or 252 kg ha-1) applied in the spring or fall and liquid swine manure (LSM) applied in spring or fall (218 kg ha-1) for corn production, and fall applied LSM for both crops in a CS rotation (168 kg ha-1) were randomly distributed in five blocks. Flow-weighted drainage samples were collected and volume measurements recorded for each plot through sampling/monitoring systems during drainage seasons in 2001-2004.

What Have We Learned?

This multi-year experiment demonstrated that rate and to a lesser extent timing affect concentration and losses and even at constant rates, these can be highly variable depending on precipitation patterns, N mineralization/denitrification processes and crop utilization in a given season. As expected, as nitrogen application rate to corn increases, the nitrate-N concentrations in subsurface tile drainage water increase.  This highlights the need for appropriate nitrogen application to corn and to avoid over application.  However, it is important to note that even when recommended nitrogen application rates are used, nitrate-N concentrations in subsurface drainage are still elevated and may exceed the EPA drinking water standard for nitrate-N of 10 mg L-1.  Relative to timing of nitrogen application, i.e. moving from fall to spring application, our studies showed little to moderate potential to decrease nitrate-N concentrations. Likely the largest factor when looking at the effect from fertilizer application timing is when precipitation and associated nitrate-N loss occurs.  Although timing of nitrogen application is important, perhaps the most important factor is to apply the correct amount of N. Manure treatments out yielded commercial N in all years. No significant differences in corn yield for any year were noted between application timing. Soybean yields were affected by N timing and less so by application rate.

click on image to enlarge

Future Plans

Other management practices need to be explored for their potentials in reducing nitrate loads from tile drained systems. Promising practices include drainage management, alternative cropping systems and edge-of-field practices.

Authors

Matthew Helmers, Associate Professor, Department of Agricultural & Biosystems Engineering, Iowa State University, mhelmers@iastate.edu

Xiaobo Zhou, Assistant Scientist, Department of Agricultural & Biosystems Engineering, Iowa State Univeristy

Carl Pederson, Agricultural Specialist, Department of Agricultural & Biosystems Engineering, Iowa State University

Additional Information

Lawlor, P.A., A.J. Helmers, J.L. Baker, S.W. Melvin, and D.W. Lemke. 2011. Comparison of liquid swine manure and ammonia nitrogen dynamics for a corn-soybean crop system. Trans. ASABE 54(5): 1575-1588.

LPELC Manure Nutrient Management home

Acknowledgements

Funding for this project was provided by the Iowa Department of Agriculture and Land Stewardship through the Agricultural Water Management fund.


The authors are solely responsible for the content of these proceedings. The technical information does not necessarily reflect the official position of the sponsoring agencies or institutions represented by planning committee members, and inclusion and distribution herein does not constitute an endorsement of views expressed by the same. Printed materials included herein are not refereed publications. Citations should appear as follows. EXAMPLE: Authors. 2013. Title of presentation. Waste to Worth: Spreading Science and Solutions. Denver, CO. April 1-5, 2013. URL of this page. Accessed on: today’s date.

How can I prevent leaching of nitrate into groundwater from manure applications?

Nitrate contamination of groundwater occurs when excess nitrate in the soil profile moves along with water that is moving down past the root zone of the crop. In most cases, it is not possible to keep water from moving past the roots, so the only other option for preventing nitrate leaching is to avoid having excess nitrate present in the root zone during times when leaching events are likely to occur. Determine the available nitrogen content of manure prior to application, and don’t apply more available nitrogen than the crop can use. Make the applications as close to the time the crop will use the nitrogen as possible.

Although only available nitrogen is subject to leaching, organic form nitrogen will become available as it mineralizes, at which time it too can leach if not utilized by the crop. The amount of nitrogen that will mineralize prior to and during the crop season should be taken into account when calculating manure application rates. If significant mineralization from previous applications is expected, plan to have a crop present to utilize it prior to leaching events.