Purpose
This collaborative project between The Ohio State University, Iowa State University, and 360YieldCenter intends to demonstrate the in-season application of commercial and animal nutrient sources and water application as a unified strategy to reduce nutrient losses while improving profitability with increased grain yields. A new and innovative high-clearance robotic irrigator (HCRI) is being used to apply liquid-phase nutrients in-season beyond all stages of row crops. Replicated strip trials of Fall, Spring, and in-season application will occur using the HCRI (e.g., 360 RAIN Robotic Irrigator, Figure 1). The in-season application consists of traditional N and P application rates as well as reduced rates to take advantage of better matching nutrient availability to crop needs during the growing season. Data were collected to verify nitrate-nitrogen leaching loss using liquid swine manure as a nutrient source in Iowa, while total and dissolved reactive phosphorus losses with both runoff and leaching using commercially available nutrients were collected in in Ohio. Secondly, as climate shifts result in water scarcity during critical crop growth stages, robotic irrigation water applications will be used to meet the crop needs. Higher crop yields are anticipated via precision water management.

What Did We Do?
OSU is conducting two field demonstrations, one with a focus on water quality, and a second for comparison of nutrient management practices. The HCRI is being utilized to apply commercial fertilizer in-season via dilution in irrigation water with up to 12 applications per growing season (effective 4.5 in. of precipitation season dependent). Nutrient injection rates (N and P) are scaled to plant nutrient uptake and irrigator pass intervals. Both sites are farmed in accordance with existing crop rotation and standard practices.
Beck’s Hybrid Site (West 1A) – The Beck’s Hybrid site (78 ac) is subdivided in accordance with the sub-watershed boundaries and managed with two treatments: 1) conventional commercial fertilizer application in accordance with the Tri-State Fertilizer recommendations, and 2) in-season nutrient management (N and P) using the HCRI and Tri-State Fertilizer Recommendations with the exception nutrient application matching with plant nutrient uptake rates as judged by growing degree days (GDD). This site is instrumented as a paired watershed for surface water and subsurface tile drainage. Further, these watersheds are monitored for precipitation, flow, and water quality (nitrate, nitrite, total phosphorus and DRP).
Molly Caren Agricultural Center (MCAC) Site 1 (Field 7) – Field demonstrations at this site (140 ac) are laid-out in a randomized complete block design (RCBD) strip trial design with treatments that include: 1) commercial fertilizer application (N and P) in accordance with the Tri-State Fertilizer recommendations, 2) in-season nutrient management (N and P) using the HCRI and Tri-State Recommendations with the exception nutrient application matched with crop nutrient uptake rates based on growth stages as determined by GDD, and 3) in-season nutrient management (N and P) using the HCRI and 67.7% Tri-State recommend application rates matched with crop nutrient uptake rates based on growth stages (GDD). Strip trials are 160 ft. in width and approximately 1,170 ft. in length (4.3 ac treatments) with eight replicates.
MCAC Site 2 (Field 8A) – Field demonstration site used to test HCRI and “sandbox” for other RCBD trials outside of NRCS CIG grant to discovery and planning for future projects. This site varies depending on studies each year, but trials are completed via RCBD strips.
Data Collection and Analysis – Demonstration sites are grid sampled each season on a 1-ac grid (Beck’s) and within treatments (MCAC site) to monitor soil fertility levels. Soil moisture and temperature in situ sensors (CropX) are placed in both study locations (three per treatment, 15 total sensors). Tissue samples are collected by treatment type to assess nutrient uptake at three stages of crop growth. Harvested crops are scaled by treatment to ensure yield monitor accuracy. Remote sensing imagery (RGB, ADVI and thermal) is collected 10 or more times during the growing season to evaluate crop growth and development. Data is analyzed using RCBD procedures in SAS.
Water Quality Assessment – Surface and subsurface (tile) monitoring capacity was established in 2016 at the Beck’s Hybrid Site. Two isolated subareas within a single production field were identified and the surface and subsurface pathways were instrumented with control volumes and automated sampling equipment. Surface runoff sites were equipped with H-flumes while compound weirs were installed at each of the subsurface (tile) outlets. Each sampling point (two surface and two subsurface) is equipped with an automated water quality sampler and programmed to collect periodic samples during discharge events. Once collected, samples will be analyzed for N and P. An on-site weather station provides weather parameters. Water samples are collected weekly from the field plots during periods of drainage and follow the same ISU protocol for NO3–N. Dissolved reactive phosphorus (DRP) and digested (total phosphorous) samples are analyzed using ascorbic acid reduction method.
What Have We Learned?
2023 Results
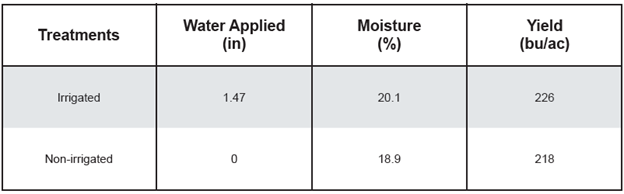
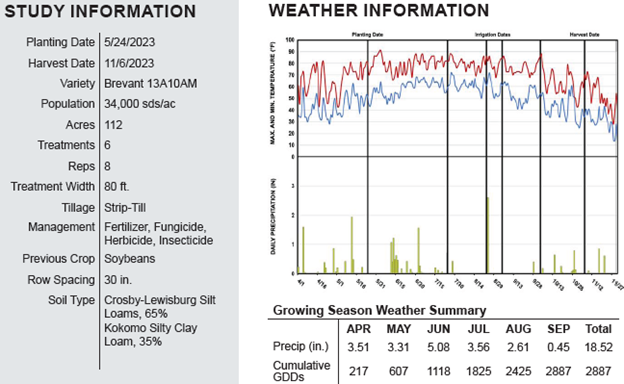
At the Beck’s Hybrid location field West 1A was planted to corn for the 2023 cropping season. There was an 8.0 bu/ac difference between irrigated and non-irrigated treatments. Nitrogen was injected using the rain unit and put on crop for the first application and use of the rain machine. Not having the rain unit in June made a significant difference in this study. The results of this location from 2023 should be taken lightly as complete implementation was not done until August. Location study information can be seen in Figure 2 and results in Figure 3.

In 2023, field 7 at MCAC was in soybeans and had no irrigation completed for this growing season.
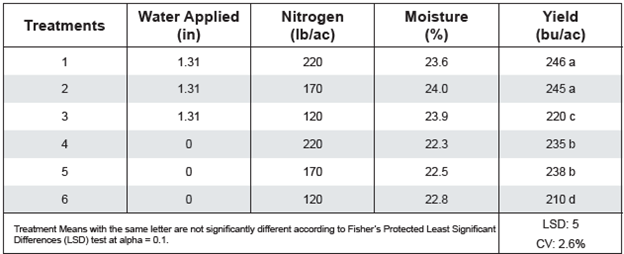
Field 8A at MCAC was in corn for the 2023 cropping season. Irrigation had a statistically significant effect on yield over all treatments. Nitrogen had statistical significance from 120 versus 170 and 220 units on nitrogen treatments. The 170 units of nitrogen was the optimal amount of nitrogen for all treatments. Not having the irrigator installed in early June caused there to be less yield in irrigated treatments. The results of this location from 2023 should be taken lightly as complete implementation was not done until August. Location study information can be seen in Figure 4 and results in Figure 5.
2024 Results
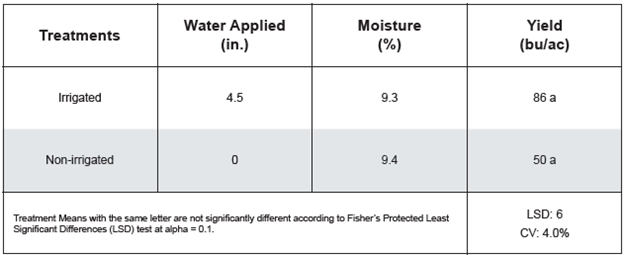
Field 7 at MCAC was in corn for the 2024 cropping season. Irrigation had a statistically significant effect on yield over all treatments. There was a 48 bu/ac between irrigated two-thirds nutrients and non-irrigated and 44 bu/ac between irrigated and non-irrigated for the 2024 growing season. A total of 773 gallons of diesel was used to run the irrigator for this trial for 2024 cropping season across 71 acres. A total of 25,739 kWh was used to run the electric pumps, base station, and well for 2024 growing season across 71 acres. These are the initial results that were published in efields and further results will continue to be analyzed to meet all project objectives. This data will be used to help in evaluating HCRI versus traditional crop production and management practices to meet project objectives. Location study information can be seen in Figure 6 and results in Figure 8. In Figure 7, aerial imagery can be seen from the 2024 cropping season.

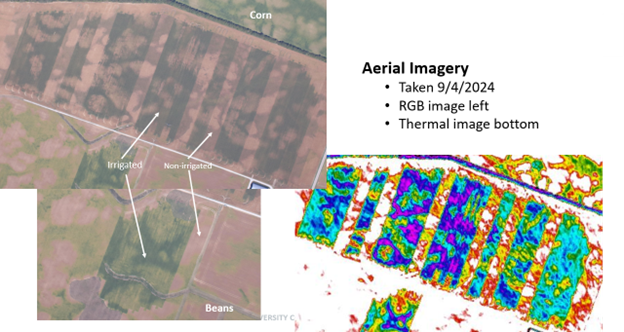

Field 8A at MCAC was in soybeans for the 2024 cropping season. Irrigation had a statistically significant effect on yield over non-irrigated. A total of 211 gallons of diesel was used to run the irrigator for this trial for 2024 cropping season across 11 acres. A total of 3,475 kWh was used to run the electric pumps, base station, and well for 2024 growing season across 11 acres. Location study information can be seen in Figure 9 and results in Figure 10. In Figure 7, aerial imagery can be seen from the 2024 cropping season.

Future Plans
During the next 12 months, we are planning for the HCRI operation at the two sites for cropping practices and irrigation for 2025 growing season. We will be aggregating weather data, agronomic data, plant samples, surface and ground water quality samples, and machine performance data for all years of the project with the current end date as spring of 2026. We are hoping to continue to perform testing with this technology and implementing the dry product skid for field operations for the 2025 growing and full-scale implementation across all studies in 2026. The results from the Iowa State portion of this funded project will also be reported in the future as well. There is a significant need to further develop programs for injecting macro and micronutrients in liquid and granular form for growers. The potential to significantly cut application rates exists with this technology. Also, implementing this technology with liquid livestock manure producers will change the paradigm of how manure is managed in the future.
Authors
Presenting & corresponding author
Andrew Klopfenstein, Senior Research Engineer, The Ohio State University, Klopfenstein.34@osu.edu
Additional authors
Justin Koch, Innovation Engineer, 360YieldCenter; Kapil Arora, Field Agricultural Engineer, Iowa State University; Daniel Anderson, Associate Professor, Iowa State University; Matthew Helmers, Professor, Iowa State University; Kelvin Leibold, Farm Management Specialist, Iowa State University; Alex Parsio, Research Engineer, The Ohio State University; Chris Tkach, Lecturer, The Ohio State University; Christopher Dean, Graduate Research Associate, The Ohio State University; Ramareo Venkatesh, Research Associate, The Ohio State University; Elizabeth Hawkins, Agronomics Systems Field Specialist, The Ohio State University; John Fulton, Professor, The Ohio State University; Scott Shearer, Professor and Chair, The Ohio State University
Additional Information
eFields On-Farm Research Publication 2023 and 2024 Editions – https://digitalag.osu.edu/efields
Acknowledgements
Natural Resources Conservation Service – Conservation Innovation Grant (NR223A750013G037)
Ohio Department of Agriculture – H2Ohio Grant
USDA, NRCS, 360YieldCenter, Beck’s Hybrids, Molly Caren Agricultural Center, Rooted Agri Services, Iowa State University, The Ohio State University
The authors are solely responsible for the content of these proceedings. The technical information does not necessarily reflect the official position of the sponsoring agencies or institutions represented by planning committee members, and inclusion and distribution herein does not constitute an endorsement of views expressed by the same. Printed materials included herein are not refereed publications. Citations should appear as follows. EXAMPLE: Authors. 2025. Title of presentation. Waste to Worth. Boise, ID. April 7-11, 2025. URL of this page. Accessed on: today’s date.