Nitrous oxide emitted from cropland constitutes a significant component of the agricultural sector’s overall greenhouse gas footprint. In order to accurately evaluate mitigation strategies, predict impacts, and model system behavior under future climate scenarios, it is essential to have access to flux measurements collected under regionally relevant conditions of soil, weather, and management strategies. As part of the Climate Change Mitigation and Adaptation in Dairy Production Systems of the Great Lakes Region USDA Coordinated Agricultural Project, we are measuring nitrous oxide flux from a typical dairy forage rotation in south-central Wisconsin. The rotation consists of one year of corn and three years of alfalfa, receiving liquid dairy manure fertilization in corn and alfalfa establishment years. Fluxes have been tracked over two growing seasons, and comparisons are possible between years as well as between phases of the rotation. Ultimately this data will be used to calibrate models for use in footprinting and benchmarking efforts and in predicting future productivity and resilience of dairy-based systems.
The authors are solely responsible for the content of these proceedings. The technical information does not necessarily reflect the official position of the sponsoring agencies or institutions represented by planning committee members, and inclusion and distribution herein does not constitute an endorsement of views expressed by the same. Printed materials included herein are not refereed publications. Citations should appear as follows. EXAMPLE: Authors. 2015. Title of presentation. Waste to Worth: Spreading Science and Solutions. Seattle, WA. March 31-April 3, 2015. URL of this page. Accessed on: today’s date.
We conducted a field study on corn to evaluate the effect of liquid dairy manure applied pre-plant (injection or surface broadcast with immediate or 3-day disk incorporation) or sidedressed at 6-leaf stage (injected or surface-applied) on emission of NH3 and N2O. Manure was applied at a rate of 6500 gal/acre, which supplied an average of 150 lb/acre of total N and 65 lb/acre of NH4-N. Ammonia emission was measured for 3 days after manure application using the dynamic chamber/equilibrium concentration technique, and N2O flux was quantified using the static chamber method at intervals of 3 to 14 days throughout the season. Ammonia-N losses were typically 30 to 50 lb/acre from pre-plant surface application, most of the loss occurring in the first 6 to 12 hours after application. Emission rates were reduced 60-80% by quick incorporation and over 90% by injection. Losses of N2O were relatively low (1 lb/acre or less annually), but pronounced peaks of N2O flux occurred from either pre-plant or sidedress injected manure in different years. Results show that NH3 emission from manure can be reduced substantially by injection or quick incorporation, but there may be some tradeoff with N2O flux from injection.
Why Study Land Application Emissions of Ammonia and Nitrous Oxide?
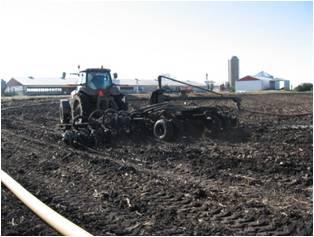
Figure 1. Injection equipment used for pre-plant application (top) and sidedress application (bottom) of liquid dairy manure.
Manure is a valuable source of nitrogen (N) for crop production, but gaseous losses of manure N as ammonia (NH3) and nitrous oxide (N2O) reduce the amount of N available to the crop and, therefore, its economic value as fertilizer. These N losses can also adversely affect air quality, contribute to eutrophication of surface waters via atmospheric deposition, and increase greenhouse gas emission. And the decreased available N in manure reduces the N:P ratio and can lead to a more rapid build-up of P in the soil for a given amount of available N. The most common approach to controlling NH3 volatilization from manure is to incorporate it into the soil with tillage or subsurface injection, which can reduce losses by 50 to over 90% compared to surface application (Jokela and Meisinger, 2008). Injecting into a growing corn crop at sidedress time offers another window of time for manure application (Ball-Coelho et al., 2006). While amounts of N lost as N2O are usually small compared to NH3, even low emissions can contribute to the greenhouse effect because N2O is about 300 times as potent as carbon dioxide in its effect on global warming (USEPA, 2010). We carried out a 4-year field experiment to evaluate the effect of dairy manure application method and timing and time of incorporation on a) corn yield, b) fertilizer N credits, c) ammonia losses, and) nitrous oxide emissions.
What Did We Do?
Figure 2. Average (2009-2011) NH3-N emission rates as affected by method and timing of manure application.
This field research was conducted at the Univ. of Wisconsin/USDA Agricultural Research Station in Marshfield, WI, on predominantly Withee silt loam (Aquic glossudalf), a somewhat poorly drained soil with 0 to 2% slope. Dairy manure was applied either at pre-plant (mid- to late May) or sidedress time (5-6-leaf stage). Pre-plant treatments were either injected with an S-tine injector (15-inch spacing; Fig. 1) or incorporated with a tandem disk immediately after manure application (< 1 hour), 1-day later, or 3 days later. All plots were chisel plowed 3 to 5 days after application. Sidedress manure applications were either injected with an S-tine injector (30-inch spacing) or surface applied (Fig. 1). Fertilizer N was applied to separate plots at pre-plant at rates of 0, 40, 80, 120, 160, and 200 lb/acre as urea and incorporated with a disk. Liquid dairy manure (average 14% solids) was applied at a target rate of 6,500 gal/acre. Manure supplied an average of 158 lb total N and 62 lb NH4-N per acre, but rates varied across years and application times.
Ammonia emission was measured following pre-plant and sidedress manure applications in 2009-2011 with the dynamic chamber/equilibrium concentration technique (Svensson, 1994). Measurement started immediately after manure application and continued through the third day. Ammonia measurement ended just before disking of the 3-day incorporation treatment, so the 3-day treatment represents surface-applied manure. Nitrous oxide was measured using the static, vented chamber technique following the GRACEnet protocol (Parkin and Venterea, 2010). Measurement began two days after pre-plant manure application and continued approximately weekly into October.
What Have We Learned?
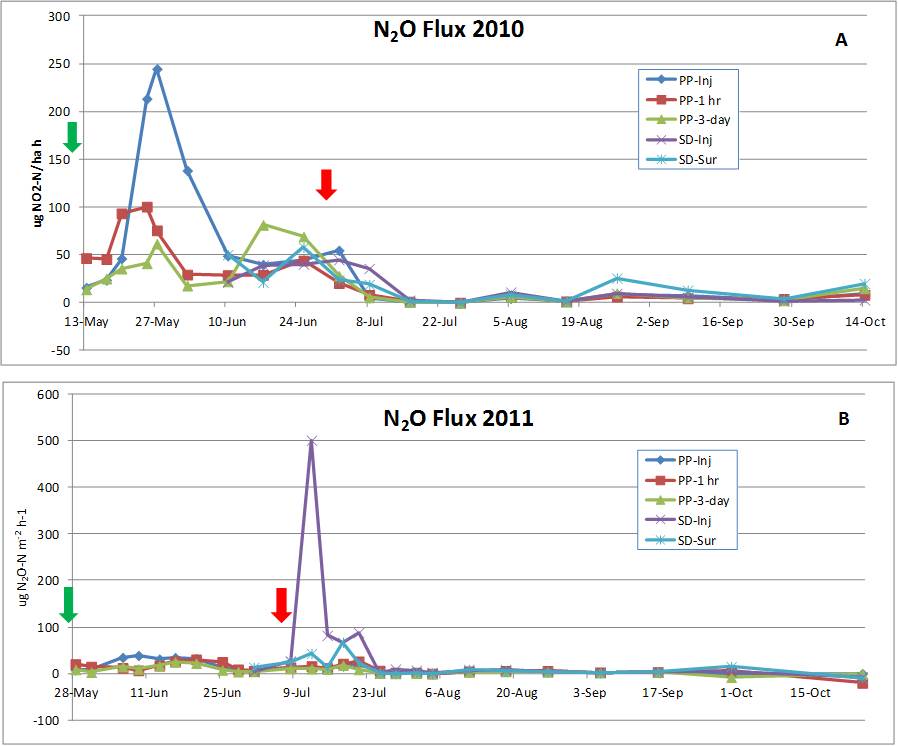
Figure 3. Nitrous oxide (N2O) flux as affected by method and timing of dairy manure application from May to October of 2010 (A) and 2011 (B). Arrows show times of manure application. Note differences in scale for 2010 and 2011.
The 3-year average annual NH3 emission rate from surface applied (3-day incorporation) manure was relatively high immediately following application but declined rapidly after the first several hours to quite low levels (Fig. 2). Cumulative NH3-N loss over the full measurement period averaged over 40 lb/acre from surface application but was reduced by 75% with immediate disking and over 90% by injection. Ammonia losses varied somewhat by year, but patterns over time and reductions by incorporation were similar. The pattern of ammonia loss, 75% of the total loss in the first 6 to 12 hours, emphasizes the importance of prompt incorporation to reduce losses and conserve N for crop use.
Nitrous oxide flux was quite low for most manure treatments during most of the May to October period in both years (Fig. 3). However, there were some increases in N2O flux after manure application, and pronounced peaks of N2O emission from the injection treatment at either pre-plant (2010) or sidedress (2011) time. Greater emission from injection compared to other treatments may have occurred because injection of liquid manure places manure in a relatively concentrated band below the surface, creating anaerobic (lacking in oxygen) conditions. Nitrous oxide is produced by denitrification, a microbial process that is facilitated by anaerobic conditions. Reasons for the difference between 2010 and 2011 are not readily obvious, but are probably a result of different soil moisture and temperature conditions.
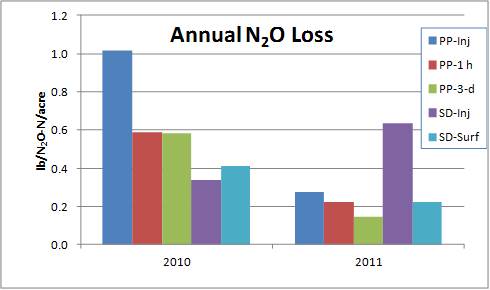
Figure 4. Annual (May-Oct.) loss of N2O as affected by method and timing of liquid dairy manure application. 2010 and 2011.
Based on these results, injection of liquid dairy manure resulted in opposite effects on NH3 and N2O emission, suggesting a trade-off between the two gaseous N loss pathways. However, the total annual N losses from N2O emissions (1 lb/acre or less; Fig. 4) were only a fraction of those from ammonia volatilization, so under the conditions of this study N2O emission is not an economically important loss. As noted earlier, however, N2O is a potent greenhouse gas, so even small amounts can contribute to the potential for global climate change. The dramatic reduction in NH3 loss from injection, though, may at least partially balance out the increased N2O because 1% of volatilized N is assumed to be converted to N2O (IPCC, 2010). Immediate disk incorporation was almost as effective as injection for controlling NH3 loss and, on average, resulted in less N2O emission than injection. But the separate field operation must be done promptly after manure application to be effective. A possible alternative is to use sweep injectors or other direct incorporation methods that place manure over a larger volume of soil and/or create more mixing with soil, thus creating conditions less conducive to denitrification and N2O loss.
Manure application timing and method/time to incorporation significantly affected grain yield in 2009, 2010, and 2012 and silage yield in 2012. Pre-plant injection produced greater yields than one or more of the broadcast treatments in 2009 (grain) and 2012 (grain and silage). Overall, yield effects of application and incorporation timing were variable from year to year, probably because of differences in weather and soil conditions and actual manure N rates applied. The fertilizer N equivalence of manure was calculated by comparing the yield achieved from each manure treatment to the yield response function from fertilizer N. Fertilizer N equivalence values were quite variable by year, but 4-year averages expressed as percent of total manure N applied were 52% for injection (pre-plant and sidedress), 37% for 1-hour or 1-day incorporation, and 34% for 3-day incorporation. So, when expressed as a percent of total manure N applied, N availability generally decreased as time to incorporation increased, which reflects the amounts of measured NH3 loss.
In summary, ammonia volatilization losses increased as the time to incorporation of manure increased. Injection of manure resulted in the lowest amount of NH3 volatilization, but higher N2O emissions. In this study, reducing the large NH3 losses by injecting manure provided more environmental benefit compared to the small increase in N2O emissions. In addition, injection or immediate incorporation resulted, on average, in higher fertilizer N value of manure for corn production. The decreased need for commercial fertilizer N could potentially result in greater profitability and a smaller carbon footprint.
Future Plans
We have started other research to evaluate yield response, N cycling, and emission of NH3 and N2O from various low-disturbance manure application methods in silage corn and perennial forage systems.
Authors
Bill Jokela, Research Soil Scientist, USDA-ARS, Dairy Forage Reserch Center, Marshfield, WI, bill.jokela@ars.usda.gov
Carrie Laboski, Assoc. Professor, Dept. of Soil Science, Univ. of Wisconsin
Todd Andraski, Researcher, Dept. of Soil Science, Univ. of Wisconsin
Additional Information
Ball Coelho, B.R., R.C. Roy, and A.J. Bruin. 2006. Nitrogen recovery and partitioning with different rates and methods of sidedressed manure. Soil Sci. Soc. Am. J. 70:464–473.
Intergovernmental Panel on Climate Change (IPCC). 2006 IPCC Guidelines for National Greenhouse Gas Inventories, vol. 4, Agriculture, Forestry and Other Land Use, edited by S. Eggleston et al., Inst. for Global Environ. Strategies, Hayama, Japan.
The authors gratefully acknowledge Matt Volenec and Ashley Braun for excellent technical assistance in conducting this research. Funding was provided, in part, by the USDA-Agricultural Research Service and the Wisconsin Corn Promotion Board.
The authors are solely responsible for the content of these proceedings. The technical information does not necessarily reflect the official position of the sponsoring agencies or institutions represented by planning committee members, and inclusion and distribution herein does not constitute an endorsement of views expressed by the same. Printed materials included herein are not refereed publications. Citations should appear as follows. EXAMPLE: Authors. 2013. Title of presentation. Waste to Worth: Spreading Science and Solutions. Denver, CO. April 1-5, 2013. URL of this page. Accessed on: today’s date.
A new method was used at the Ag 450 Farm Iowa State University (41.98N, 93.65W) from October 24, 2012 through December 14, 2012 to assess GHG emission from land-applied swine manure on crop land. Gas samples were collected daily from four static flux chambers. Gas method detection limits were 1.99 ppm, 170 ppb, and 20.7 ppb for CO2, CH4 and N2O, respectively. Measured gas concentrations were used to estimate flux using four different models, i.e., (1) linear regression, (2) non-linear regression, (3) non-equilibrium, and (4) revised Hutchinson & Mosier (HMR). Sixteen days of baseline measurements (before manure application) were followed by manure application with deep injection (at 41.2 m3/ha), and thirty seven days of measurements after manure application.
Static flux chamber (pictured) method was developed to measure greenhouse gas emissions from land-applied swine manure from a corn-on-corn system in central Iowa in the Fall of 2012. Gas samples were collected in vials and transported to the Air Quality Laboratory at Iowa State University campus.
Why Study Greenhouse Gases and Land Application of Swine Manure?
Assessment of greenhouse gas (GHG) emissions from land-applied swine manure is needed for improved process-based modeling of nitrogen and carbon cycles in animal-crop production systems.
What Did We Do?
We developed novel method for measurement and estimation of greenhouse gas (CO2, CH4, N2O) flux (mass/area/time) from land-applied swine manure. New method is based on gas emissions collection with static flux chambers (surface coverage area of 0.134 m^2 and a head space volume of 7 L) and gas analysis with a GC-FID-ECD.
Baseline (post tilling) greenhouse gas (GHGs) emissions monitoring was followed with swine manure application in the Fall of 2012 (pictured) and about 10 weeks of post-application monitoring of GHGs.
New method is also applicable to measure fluxes of GHGs from area sources involving crops and soils, agricultural waste management, municipal, and industrial waste. New method was used at the Ag 450 Farm Iowa State Univeristy (41.98 N, 93.65 W) from October 24, 2012 through December 14, 2012 to assess GHG emission from land-applied swine manure on crop (corn on corn) land. Gas samples were collected daily from four static flux chambers. Gas method detection limits were 1.99 ppm, 170 ppb, and 20.7 ppb for CO2, CH4, and N2O, respectively.
What Have We Learned?
Measured gas concentrations were used to estimate flux using four different mathematical models, i.e., (1) linear regression, (2) non-linear regression, (3) non-equilibrium, and (4) revised Hutchinson & Mosier (HMR). Sixteen days of baseline measurements (before manure application) were followed by manure application with deep injection (at 41.2 m3/ha), and thirty seven days of measurements after manure application. Preliminary net cumulative flux estimates ranged from 115,000 to 462,000 g/ha of CO2, -4.65 to 204 g/ha of CH4, and 860 to 2,720 g/ha N2O. These ranges are consistent with those reported in literature for similar climatic conditions and manure application method.
Greenhouse gases (GHGs) were analyzed in the Air Quality Laboratory (ISU) using dedicated GHGs gas chromatograph. The picture above shows an example of gas sample analysis for CO2, GH4 and N2O. Each ‘peak’ represents one of the tagget GHGs. Gas concentrations were used in a mathematical model to estimate GHG flux (mass emitted/area/time).
Future Plans
Spring 2013 measurements of GHG flux from land-applied swine manure are planned. The spring study will follow the protocols developed for the Fall 2012 season. Estimates of the Spring and Fall GHG flux will be used to develop GHG emission factors for emissions from swine manure in Midwestern corn-on-corn systems. Emission factors will be compared with literature data.
Authors
Dr. Jacek Koziel, Associate Professor, Iowa State University Department of Agricultural and Biosystems Engineering koziel@iastate.edu
Devin Maurer, Research Associate, Iowa State University Department of Agricultural and Biosystems Engineering
Kelsey Bruning, Undergraduate Research Assistant, Iowa State University Department of Civil, Construction and Environmental Engineering
Tanner Lewis, Undergraduate Research Assistant, Iowa State University Department of Agricultural and Biosystems Engineering
Danica Tamaye, Undergraduate Research Assistant, University of Hawaii College of Agriculture, Forestry, and Natural Resource Management
William Salas, Applied Geosolutions
Acknowledgements
We would like to thank the National Pork Board for supporting this research.
The authors are solely responsible for the content of these proceedings. The technical information does not necessarily reflect the official position of the sponsoring agencies or institutions represented by planning committee members, and inclusion and distribution herein does not constitute an endorsement of views expressed by the same. Printed materials included herein are not refereed publications. Citations should appear as follows. EXAMPLE: Authors. 2013. Title of presentation. Waste to Worth: Spreading Science and Solutions. Denver, CO. April 1-5, 2013. URL of this page. Accessed on: today’s date.
Manage Cookie Consent
To provide the best experiences, we use technologies like cookies to store and/or access device information. Consenting to these technologies will allow us to process data such as browsing behavior or unique IDs on this site. Not consenting or withdrawing consent, may adversely affect certain features and functions.
Functional
Always active
The technical storage or access is strictly necessary for the legitimate purpose of enabling the use of a specific service explicitly requested by the subscriber or user, or for the sole purpose of carrying out the transmission of a communication over an electronic communications network.
Preferences
The technical storage or access is necessary for the legitimate purpose of storing preferences that are not requested by the subscriber or user.
Statistics
The technical storage or access that is used exclusively for statistical purposes.The technical storage or access that is used exclusively for anonymous statistical purposes. Without a subpoena, voluntary compliance on the part of your Internet Service Provider, or additional records from a third party, information stored or retrieved for this purpose alone cannot usually be used to identify you.
Marketing
The technical storage or access is required to create user profiles to send advertising, or to track the user on a website or across several websites for similar marketing purposes.