
Purpose
The most common waste management practice on hog farms in Eastern North Carolina are anaerobic lagoons. Lagoons contain three zones: [1] sludge storage zone at the bottom, [2] treatment zone for incoming manure in near the middle, and [3] a liquid (supernatant) storage zone at the top. The supernatant is land applied throughout the year as a nutrient source for growing crops on farms while the middle (treatment) zone is required to remain full to ensure effective treatment.
Considering the risk that hurricanes pose to North Carolina and the hog sector (particularly during late summer months), close lagoon management is critical to avoid risk of overflow or breach. Currently, regulations allow swine growers to lower the effluent level in their lagoons by applying part of the treatment zone effluent. Conditional to this allowance, however, is that the treatment zone contains at least 4-feet of depth that is sludge-free. This condition aims to ensure applied effluent is safe for application.
While this condition is helpful to reducing the risk of applying higher concentration of phosphorus, zinc, and copper to crops, many producers do not meet this condition due to excessive sludge buildup and would not be able to lower the lagoon level which poses a significant risk during intense rainfall events.
This study aims to quantify the impact of the sludge-free depth in the lagoon on the quality of supernatant during the drawdown period. Findings will help with precision nutrient application from swine manure and allow for further drawdown during necessary storm events.
What Did We Do
This study used a dataset representing 27 swine operations in Eastern North Carolina between 2016-2021. The dataset includes:
1. Monthly effluent/waste sampling analysis,
2. Annual sludge surveys, as well as
3. Lagoon level readings.
This dataset was analyzed using statistical methods to quantify the impact of seasonality (time of year), farm type (sow, finisher, or farrowing), and sludge level on nutrient concentration in the effluent.
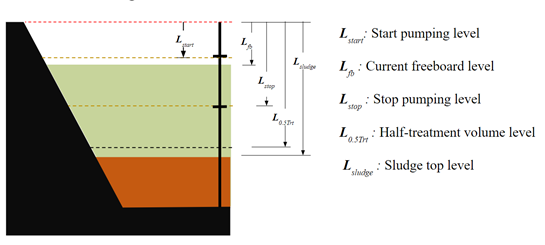
Most growers use depth, in inches, to report volumes applied or available for storage. However, when comparing lagoons with different designs, this can be a challenge. As such, we developed two parameters to facilitate cross-farm, cross-lagoon comparisons. The first is “freeboard ratio” (FBR), which refers to the relative “fullness” of the storage zone in the lagoon. FBR value between 0 and 1 indicates the lagoon is currently within the storage volume (between start and stop pumps), values greater than 1 indicate the lagoon is in drawdown, and negative values indicate the lagoon level exceeded the storage volume and is currently in the rainfall/storm storage zone and must be lowered promptly. The equation used to calculate FBR is as follows:
| TBR= | LFB-Lstart | , variables defined in Figure 2. |
| Lstop-Lstart |
The second variable is “sludge level ratio” (SLR), which refers to the relative treatment volume available compared to the 50% treatment volume required. SLR values greater than 1 indicate that more than 50% of the treatment volume is sludge-free in the lagoon and therefore drawdown can proceed, and no sludge removal is necessary. SLR values less than 1 indicate that less than 50% of the treatment volume is available and drawdown might not be feasible. The equation used to calculate SLR is as follows:
| SLR= | Lsludge-Lstop | , variables defined in Figure 2. |
| L0.5. Trt-Lstop |
What Have We Learned
In analyzing the dataset we observed that only 2% of the samples were collected while the lagoon level exceeded storage level (above the start-pump level). This suggests the majority of studied operations were successful in managing effluent despite the wet years observed between 2016 and 2021. By comparison, 22% of the samples were collected while the lagoon was at a draw-down state (the entire storage volume is empty and the treatment zone is partially emptied).
Additionally, 38% of the samples collected were associated with lagoons that needed sludge removal (SLR < 1). These results are summarized in Table 1, with 12% of samples collected from lagoons in drawdown (FBR > 1) and in need of sludge removal (SLR < 1). This latter group of samples represent the primary concern for lagoon drawdown.
| Table 1. Summary of FBR and SLR Interactions | |||
| Lagoon Sample Class | Sludge Level Ratio (SLR) | ||
| No Removal | Removal Due | ||
| Freeboard Ratio (FBR) | Above stop-pump | 40% | 26% |
| In drawdown | 22% | 12% | |
The season was a significant predictor of the lagoon level (p < 0.001), with the late irrigation season (July – Sept) showing the least effluent volume in the lagoon. On average, 91% of the storage volume was unoccupied. This compares to the winter months (Oct – Feb) and the early irrigation season (Mar – June) with 81 and 69% of the storage volume empty, respectively.
For all seasons the mean ratio of N : P2O5 : K2O in the supernatant is 4 : 1 : 8.2. There was less variability for N and K content with the lagoon level than for P, Zn, and Cu. This can be attributed to the N and K being primarily in soluble forms in the lagoon supernatant compared to P2O5, Zn and Cu which are mostly bound to solids.
The analysis showed a greater variability in Zn, Cu, and P levels with changes in solid concentration in the supernatant as well as the amount of suspended solids as a result of wind or active lagoon agitation/sludge removal.
Overall, the results showed lagoon drawdown and existing sludge reserves to have a combined effect on nutrient concentrations in the supernatant, particularly for phosphorus.
Future Plans
This study will inform ongoing research to predict temporal variability in nutrient content in the lagoon due to weather, operational decisions, and time of year. Near term, these observations will help guide application rates to ensure P levels meet crop demands particularly during late-season drawdown without significantly increasing soil P levels. In addition, this work will be part of a larger study to predict the performance of anaerobic treatment lagoons under future climate conditions.
Authors
Presenting Author:
Carly Graves, Graduate Research Assistant, North Carolina State University
Corresponding Author:
Dr. Mahmoud Sharara, Assistant Professor & Waste Management Extension Specialist, North Carolina State University
msharar@ncsu.edu
Acknowledgements
Thank you to Smithfield Foods, Inc. for funding this research and providing datasets of sludge surveys.
Videos, Slideshows and Other Media
https://content.ces.ncsu.edu/sludge-sampling-in-anaerobic-treatment-swine-lagoons
The authors are solely responsible for the content of these proceedings. The technical information does not necessarily reflect the official position of the sponsoring agencies or institutions represented by planning committee members, and inclusion and distribution herein does not constitute an endorsement of views expressed by the same. Printed materials included herein are not refereed publications. Citations should appear as follows. EXAMPLE: Authors. 2022. Title of presentation. Waste to Worth. Oregon, OH. April 18-22, 2022. URL of this page. Accessed on: today’s date.
 volumes are significantly reduced. With the nutrients being concentrated, they are more easily handled and can be transported from areas of high nutrient loads to regions of low nutrient loads at a lower cost. This practice can also help to reduce the on-farm energy costs by providing supplemental energy and/or heat. Additional benefits include pathogen destruction and odor reduction. This presentation will provide an overview of several Conservation Innovation Grants (CIG) and other manure thermo-chemical conversion projects that are being demonstrated and/or in commercial operation. Information will cover nutrient fate, emission studies, by-product applications along with some of the positives and negatives related to thermo-chemical conversion systems.
 What did we do?
  What have we learned?
  Author