An Update on Litter Amendments and Ammonia Scrubbers for Reducing Ammonia Emissions and Phosphorus Runoff from Poultry Litter

Purpose

The objectives of the litter amendment research were to determine why alum applications to poultry litter occasionally fail to reduce soluble phosphorus (P) and to determine if aluminum-, calcium- or iron- based nanoparticles would reduce soluble P in litter when applied alone or in combination with conventional litter treatments used for ammonia control, such as alum and/or sodium bisulfate.

The objective of the scrubber research was to design a scrubber that reduces ammonia, dust, and pathogens in the air inside of animal rearing facilities, like broiler houses, rather than the air being exhausted from the facilities. Currently scrubbers are “end of pipe” technology, which purify the exhaust air, so the only economic benefit is the capture of nitrogen, which is relatively inexpensive. Reducing the ammonia, dust, and pathogens in the air inside poultry houses should result in production benefits, such as those found with litter amendments (improved weight gains, better feed conversion, lower susceptibility to disease, and reduced propane use).

What Did We Do?

A series of laboratory studies were conducted with various litter amendments.  The first study was conducted using litter from a commercial broiler house that had been treated with sodium bisulfate ten times over a two year period.  Poultry litter (20 grams) was weighed out into 6 centrifuge tubes and half of the litter samples were treated with alum at a rate of 5% by weight.  The tubes were incubated in the dark for one week, then extracted with 200 ml deionized water for one hour, centrifuged for 15 minutes at 8,000 rpm, filtered through 0.45 um filter paper and analyzed for soluble reactive phosphorus (SRP) using the Murphy-Riley method on an autoanalyzer.

The next four lab studies used the same basic incubation studies, although the litter that was used came from a pen trial we had conducted where we knew the litter had never been treated with sodium bisulfate.  Eighty six different treatment combinations involving conventional ammonia control treatments, such as alum and sodium bisulfate with or without the addition of different types of nanoparticles were used.  The nanoparticles used in this study were: (1) Al-nano – an aluminum based nanoparticle, (2) Fe-nano – an iron based nanoparticle, (3) MNP – a nanoparticle made of both aluminum and iron, and (4) TPX – a calcium silicate based nanoparticle made by N-Clear, Inc.  The sodium bisulfate that was utilized is sold under the tradename PLT (Poultry Litter Treatment) by Jones-Hamilton, Inc.

We also redesigned the ARS Air Scrubber so that it is scrubbing the air inside poultry houses rather than the exhaust air.  The critical design feature to allow this was the use of fast sand filters to remove all particulates from the water and acid used to scrub dust and ammonia, respectively.

What Have We Learned?

We found that alum failed to lower soluble P in poultry litter when the litter had been treated with sodium bisulfate, probably due to the formation of sodium alunite [NaAl3(OH)6(SO4)2], a mineral often found in acid soils where sulfate applications have occurred. The formation of this mineral likely inactivates the Al with respect to P adsorption or precipitation reactions.

We also found that a Ca-based nanoparticle (TPX) was very effective in reducing soluble P in litter, either when applied in combination with alum or sodium bisulfate.  Surprisingly, when TPX was applied with sodium bisulfate at very low levels, the soluble P levels of sodium bisulfate-treated litter decreased from 3,410 mg P/kg (when added alone) to 1,220, 541, and 233 mg P/kg litter, respectively, when 0.25, 0.5, and 1% TPX was added with sodium bisulfate.

Future Plans

We are currently conducting a large pen trial to determine the effect of TPX nanoparticles applied with alum or sodium bisulfate on ammonia emissions, soluble P, and P runoff from small plots using rainfall simulators.

We are also building a full-scale prototype of the indoor ammonia scrubber so that we can begin to test the efficacy of this scrubber.

Author

Philip A. Moore, Jr., Soil Scientist, USDA/ARS, Fayetteville, AR

Philip.Moore@USDA.Gov

Additional Information

Moore, P.A., Jr. 2021. Composition and method for reducing ammonia and soluble phosphorus in runoff and leaching from animal manure. U.S. Patent Application No. 17/171,204. Patent pending.

Moore, P.A., Jr. 2022. A system for removing ammonia, dust and pathogens from air within an animal rearing/sheltering facility. U.S. Patent Application No. 17/715,666.  Patent pending.


The authors are solely responsible for the content of these proceedings. The technical information does not necessarily reflect the official position of the sponsoring agencies or institutions represented by planning committee members, and inclusion and distribution herein does not constitute an endorsement of views expressed by the same. Printed materials included herein are not refereed publications. Citations should appear as follows. EXAMPLE: Authors. 2022. Title of presentation. Waste to Worth. Oregon, OH. April 18-22, 2022. URL of this page. Accessed on: today’s date.
The MAnure PHosphorus EXtraction (MAPHEX) System for Removing Phosphorus, Odor, Microbes, and Alkalinity from Dairy and Swine Manures

Abstract

Animal manures contain nutrients [primarily nitrogen (N) and phosphorus (P)] and organic material that are beneficial to crops. Unfortunately, for economic and logistics reasons, liquid dairy and swine manure tends to be applied to soils near where it is generated. Over time, P concentrations in soils where dairy manure is applied builds up, often in excess of crop demands. We previously (Church et al., 2016, 2017) and have subsequently built, a full-scale version of a MAnure PHosphorus EXtraction (MAPHEX) System capable of removing greater than 90 percent of the P from manures. While originally designed to remove phosphorus, we have also shown that the MAPHEX System was also capable of removing odor and microbes, and of concentrating alkalinity into a solid, economically transported form. We have also lowered daily operating costs by testing the effect of lower-cost chemicals as alternatives to ferric sulfate, and by showing that the diatomaceous earth (DE) filtering material can be recycled and reused. We are currently building a system capable of treating over 100,000 gallons of Dairy Manure per day. This system is planned to be operational for demonstrating starting summer 2022.

Purpose

Swine and dairy manures are typically in slurry form and contain nutrients [primarily nitrogen (N) and phosphorus (P)] and organic material that are beneficial to crops. Unfortunately, the concentrations of nutrients in both manures are too low to make transportation of bulk manures over large distances economically viable. Furthermore, since it must be transported in tanks, that transportation is inconvenient as well. Therefore, these manures tend to be applied to soils near where they are generated, and, over time, P concentrations in soils increase to the point that soil P concentrations are often in excess of crop demands. Furthermore, because of the implication that P runoff from agricultural operations plays an important role in eutrophication of streams and other water bodies, farmers are experiencing increasing pressures and regulation to not apply animal manures to those soils.

We previously reported on an invention that 1) is designed to be a solution to the P overloading that happens when unnecessary P is added to agricultural soils, 2) is scalable such that it can be used as a mobile system, and 3) has shown to be capable of removing greater than 90 percent of the P from a wide range of dairy manures, while retaining greater than 90% of the N in the final effluent for beneficial use by the farmer.

What Did We Do?

We subsequently built a full-scale version of a MAnure PHosphorus EXtraction (MAPHEX) System capable of removing greater than 90 percent of the P from manures and have tested it on dairy manures. We also focused our efforts on lowering the daily operating costs of the system by developing a method to recover and reuse the diatomaceous earth used in the final filtration step, and testing alternative, lower cost chemicals that can be used in the chemical treatment step. We also performed pilot-scale tests on swine manures.

What Have We Learned?

The full-scale MAPHEX System removed greater than 90% of P from a wide variety of dairy manures, while leaving greater than 90% of the N in the final effluent to be used beneficially to fertigate crops. The System was also shown to recover and concentrate alkalinity into a solid form on a farm that used greater amounts of lime during manure handling, remove 50% of the odor from dairy manure and to remove greater than 80% of Total coliforms and E. Coli. Furthermore, the System has not shown to alter the pH of the final effluent respective to raw manures as other treatment technologies can. We have lowered daily operating costs by testing the effect of lower-cost chemicals as alternatives to ferric sulfate, and by showing that the diatomaceous earth (DE) filtering material can be recycled and reused.

In pilot-scale swine testing, we found that the MAPHEX System can remove greater than 96% of the phosphorus in swine manures. This essentially P free effluent can be beneficially used for fertigation without further loading the receiving soils with P. Scaling up the pilot-scale testing has the potential to reduce swine manure storage volumes to allow for mitigation of overflow problems during large storms. Furthermore, the pilot-scale study suggests that capital equipment costs and treatment costs for swine manure would be lower than for treating dairy manure.

Future Plans

We are currently building a simplified version of the MAPHEX System that will be capable of treating over 100,000 gallons of dairy manure per day. This system is planned to be operational for demonstrating starting summer 2022. We plan to use this simplified version for demonstration tests, and use the results obtained to model the effects of using MAPHEX technology compared to conventional manure handling practices on two paired watersheds. We also plan to demonstrate the full-scale system on a wide range of swine manures with on-farm testing.

Author

Clinton D. Church, Research Chemist, USDA-ARS University Park, PA

Corresponding author email address

Cdchurch.h2o@netzero.com

Additional Information

Church, C. D., Hristov, A. N., Bryant, R. B., Kleinman, P. J. A., & Fishel, S. K. (2016). A novel treatment system to remove phosphorus from liquid manure. Applied Engineering in Agriculture, 32: 103 – 112. doi:10.13031/aea.32.10999

Church, C. D., Hristov, A. N., Bryant, R. B., & Kleinman, P. J. A. (2017). Processes and treatment systems for treating high phosphorus containing fluids. US Patent 9,790.110B2.

Church, C. D., Hristov, A. N., Kleinman, P. J. A., Fishel, S. K., Reiner, M. R., & Bryant, R. B. (2018). Versatility of the MAPHEX System in removing phosphorus, odor, microbes, and alkalinity from dairy manures: A four-farm case study. Applied Engineering in Agriculture, 34: 567 – 572. doi:10.13031/aea12632

Church, C. D., Hristov, A., Bryant, R. B., & Kleinman, P. J. A. (2019). Methods for Rejuvenation and Recovery of Filtration Media. USDA Docket Number 129.17. U.S. Patent Application Serial No. 62/548,23

Church, C. D., S. K. Fishel, M. R. Reiner, P. J. A. Kleinman, A. N. Hristov, and R. B. Bryant. 2020. Pilot scale investigation of phosphorus removal from swine manure by the MAnure PHosphorus Extraction (MAPHEX) System. Applied Engineering in Agriculture 36(4): 525–531. doi: 10.13031/aea13698

https://www.ars.usda.gov/people-locations/person/?person-id=40912

https://tellus.ars.usda.gov/stories/articles/mining-manure-for-phosphorus/

https://agresearchmag.ars.usda.gov/2016/dec/phosphorus/

https://jofnm.com/article-112-Packaging-phosphorus-for-the-future.html

https://lpelc.org/versatility-of-the-manure-phosphorus-extraction-maphex-system-in-removing-phosphorus-odor-microbes-and-alkalinity-from-dairy-manures/


The authors are solely responsible for the content of these proceedings. The technical information does not necessarily reflect the official position of the sponsoring agencies or institutions represented by planning committee members, and inclusion and distribution herein does not constitute an endorsement of views expressed by the same. Printed materials included herein are not refereed publications. Citations should appear as follows. EXAMPLE: Authors. 2022. Title of presentation. Waste to Worth. Oregon, OH. April 18-22, 2022. URL of this page. Accessed on: today’s date.
Phosphorus Densification and Availability From Manure-Derived Biochar

Purpose

Manure produced at livestock facilities contains plant essential nutrients, such as nitrogen and phosphorus, which is typically land applied as a fertilizer source for crops near where it is generated. However, in areas of high livestock density, due to the imbalance of nitrogen and phosphorus in manure compared to crop requirements, soil phosphorus concentrations have increased. This has resulted in soil phosphorus legacy issues throughout the Midwest, contributing to water quality issues in surrounding waterways. To reduce phosphorus application near livestock facilities, advanced manure management systems are needed to separate and concentrate manure nutrients, particularly phosphorus, to expand transport distances. In this study, we investigated converting separated anaerobically digested manure solids into biochar through pyrolysis to densify manure nutrients. In addition, we examined the availability of phosphorus from manure derived biochar in a soil incubation study to evaluate its fertilizer potential.

What Did We Do

We collected anaerobically digested manure solids from a screw press separator at a local dairy facility. Manure solids were dried and converted to biochar at two different temperatures (662°F and 932°F). The mass of the dried manure and biochar were determined and samples analyzed for total nitrogen, total phosphorus, and available phosphorus to evaluate densification of manure nutrients.

We additionally evaluated nutrient availability of manure solids and biochar in a soil incubation study. In the study manure solids and biochar were applied at equal agronomic phosphorus rates to two different soil textures (loam and sandy loam). Soils were then incubated for 182 days with samples collected and analyzed Every week for four weeks throughout the period to evaluate phosphorus release over time.

What Have We Learned

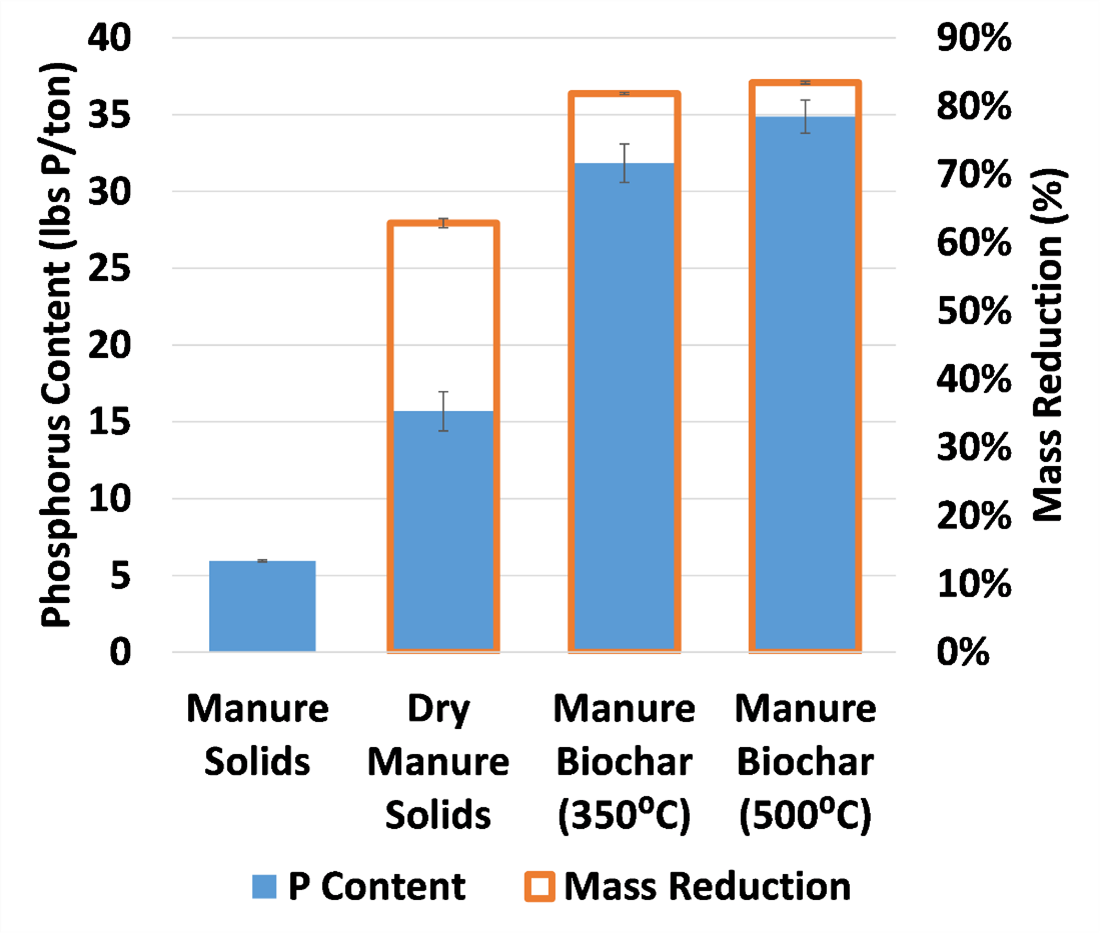
We found that converting manure solids to biochar is an effective method for reducing manure mass while retaining the original manure phosphorus content (as shown in Figure 1). However, manure derived biochar had lower available phosphorus following pyrolysis than the original separated manure solids, with the available P decreasing as the pyrolysis temperature increased.

Figure 1: Mass reduction and P content following drying and pyrolysis of manure.

During the soil incubation study, while soils with manure derived biochar application had lower available phosphorus at the start of the incubation period, within 28 days available soil phosphorus reached similar levels to those amended with separated manure solids in both soil textures. While nitrogen was applied at different rates, making comparisons difficult, there were minor changes in soil available nitrogen for manure derived biochar, suggesting no additional nitrogen availability during the incubation period.

Future Plans

We plan to further investigate manure derived biochar as a potential advanced manure processing pathway, by evaluating whether manure derived biochar can provide additional soil benefits, such as reducing nitrogen leaching when amended to agronomic soils and increasing crop yields in field studies.

Authors

Joseph R. Sanford, Assistant Professor and Wisconsin Dairy Innovation Hub Affiliate Researcher, School of Agriculture, University of Wisconsin-Platteville
sanfordj@uwplatt.edu

Additional Authors

Rebecca A. Larson, Associate Professor, Biological Systems Engineering, University of Wisconsin-Madison

Additional Information

Sanford, J., H. Aguirre-Villegas, R.A. Larson, M. Sharara, Z. Liu, & L. Schott. 2022. Biochar Production through Slow Pyrolysis of Animal Manure. University of Wisconsin-Extension, Publication No. A4192-006/AG919-06, I-01-2022.

Acknowledgements

This material is based on work that is supported by the National Institute of Food and Agriculture, U.S. Department of Agriculture, under award number 2017-67003-26055. Partial support was provided by the Wisconsin Dairy Innovation Hub. Any opinions, findings, conclusions, or recommendations expressed in this publication are those of the author(s) and do not necessarily reflect the view of the U.S. Department of Agriculture or Wisconsin Dairy Innovation Hub.


The authors are solely responsible for the content of these proceedings. The technical information does not necessarily reflect the official position of the sponsoring agencies or institutions represented by planning committee members, and inclusion and distribution herein does not constitute an endorsement of views expressed by the same. Printed materials included herein are not refereed publications. Citations should appear as follows. EXAMPLE: Authors. 2022. Title of presentation. Waste to Worth. Oregon, OH. April 18-22, 2022. URL of this page. Accessed on: today’s date.
Impact of Sludge on Nutrient Concentration in Anaerobic Swine Lagoon Supernatant

Purpose

The most common waste management practice on hog farms in Eastern North Carolina are anaerobic lagoons. Lagoons contain three zones: [1] sludge storage zone at the bottom, [2] treatment zone for incoming manure in near the middle, and [3] a liquid (supernatant) storage zone at the top. The supernatant is land applied throughout the year as a nutrient source for growing crops on farms while the middle (treatment) zone is required to remain full to ensure effective treatment.

Considering the risk that hurricanes pose to North Carolina and the hog sector (particularly during late summer months), close lagoon management is critical to avoid risk of overflow or breach. Currently, regulations allow swine growers to lower the effluent level in their lagoons by applying part of the treatment zone effluent. Conditional to this allowance, however, is that the treatment zone contains at least 4-feet of depth that is sludge-free. This condition aims to ensure applied effluent is safe for application.

While this condition is helpful to reducing the risk of applying higher concentration of phosphorus, zinc, and copper to crops, many producers do not meet this condition due to excessive sludge buildup and would not be able to lower the lagoon level which poses a significant risk during intense rainfall events.

This study aims to quantify the impact of the sludge-free depth in the lagoon on the quality of supernatant during the drawdown period. Findings will help with precision nutrient application from swine manure and allow for further drawdown during necessary storm events.

What Did We Do

This study used a dataset representing 27 swine operations in Eastern North Carolina between 2016-2021. The dataset includes:
1. Monthly effluent/waste sampling analysis,
2. Annual sludge surveys, as well as
3. Lagoon level readings.

This dataset was analyzed using statistical methods to quantify the impact of seasonality (time of year), farm type (sow, finisher, or farrowing), and sludge level on nutrient concentration in the effluent.

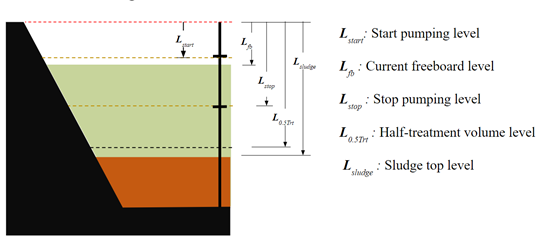
Most growers use depth, in inches, to report volumes applied or available for storage. However, when comparing lagoons with different designs, this can be a challenge. As such, we developed two parameters to facilitate cross-farm, cross-lagoon comparisons. The first is “freeboard ratio” (FBR), which refers to the relative “fullness” of the storage zone in the lagoon. FBR value between 0 and 1 indicates the lagoon is currently within the storage volume (between start and stop pumps), values greater than 1 indicate the lagoon is in drawdown, and negative values indicate the lagoon level exceeded the storage volume and is currently in the rainfall/storm storage zone and must be lowered promptly. The equation used to calculate FBR is as follows:

TBR= LFB-Lstart , variables defined in Figure 2.
Lstop-Lstart

The second variable is “sludge level ratio” (SLR), which refers to the relative treatment volume available compared to the 50% treatment volume required. SLR values greater than 1 indicate that more than 50% of the treatment volume is sludge-free in the lagoon and therefore drawdown can proceed, and no sludge removal is necessary. SLR values less than 1 indicate that less than 50% of the treatment volume is available and drawdown might not be feasible. The equation used to calculate SLR is as follows:

SLR= Lsludge-Lstop , variables defined in Figure 2.
L0.5. Trt-Lstop
Figure 2. Anaerobic lagoon zones used to calculate study parameters FBR and SLR

What Have We Learned

In analyzing the dataset we observed that only 2% of the samples were collected while the lagoon level exceeded storage level (above the start-pump level). This suggests the majority of studied operations were successful in managing effluent despite the wet years observed between 2016 and 2021. By comparison, 22% of the samples were collected while the lagoon was at a draw-down state (the entire storage volume is empty and the treatment zone is partially emptied).

Additionally, 38% of the samples collected were associated with lagoons that needed sludge removal (SLR < 1). These results are summarized in Table 1, with 12% of samples collected from lagoons in drawdown (FBR > 1) and in need of sludge removal (SLR < 1). This latter group of samples represent the primary concern for lagoon drawdown.


Table 1. Summary of FBR and SLR Interactions
Lagoon Sample Class Sludge Level Ratio (SLR)
No Removal Removal Due
Freeboard Ratio (FBR) Above stop-pump 40% 26%
In drawdown 22% 12%

The season was a significant predictor of the lagoon level (p < 0.001), with the late irrigation season (July – Sept) showing the least effluent volume in the lagoon. On average, 91% of the storage volume was unoccupied. This compares to the winter months (Oct – Feb) and the early irrigation season (Mar – June) with 81 and 69% of the storage volume empty, respectively.

For all seasons the mean ratio of N : P2O5 : K2O in the supernatant is 4 : 1 : 8.2. There was less variability for N and K content with the lagoon level than for P, Zn, and Cu. This can be attributed to the N and K being primarily in soluble forms in the lagoon supernatant compared to P2O5, Zn and Cu which are mostly bound to solids.

The analysis showed a greater variability in Zn, Cu, and P levels with changes in solid concentration in the supernatant as well as the amount of suspended solids as a result of wind or active lagoon agitation/sludge removal.

Overall, the results showed lagoon drawdown and existing sludge reserves to have a combined effect on nutrient concentrations in the supernatant, particularly for phosphorus.

Future Plans

This study will inform ongoing research to predict temporal variability in nutrient content in the lagoon due to weather, operational decisions, and time of year. Near term, these observations will help guide application rates to ensure P levels meet crop demands particularly during late-season drawdown without significantly increasing soil P levels. In addition, this work will be part of a larger study to predict the performance of anaerobic treatment lagoons under future climate conditions.

Authors

Presenting Author:
Carly Graves, Graduate Research Assistant, North Carolina State University

Corresponding Author:
Dr. Mahmoud Sharara, Assistant Professor & Waste Management Extension Specialist, North Carolina State University
msharar@ncsu.edu

Acknowledgements

Thank you to Smithfield Foods, Inc. for funding this research and providing datasets of sludge surveys.

Videos, Slideshows and Other Media

https://content.ces.ncsu.edu/sludge-sampling-in-anaerobic-treatment-swine-lagoons


The authors are solely responsible for the content of these proceedings. The technical information does not necessarily reflect the official position of the sponsoring agencies or institutions represented by planning committee members, and inclusion and distribution herein does not constitute an endorsement of views expressed by the same. Printed materials included herein are not refereed publications. Citations should appear as follows. EXAMPLE: Authors. 2022. Title of presentation. Waste to Worth. Oregon, OH. April 18-22, 2022. URL of this page. Accessed on: today’s date.

Can Grazing Systems Affect Plant Available N and P?

Purpose

A large percentage of the carbon (C), nitrogen (N), and phosphorus (P) cattle consume is released or deposited as cattle dung and urine. If we can develop grazing systems that retain these nutrients within the grazing system that is a first step in turning cattle manure into a resource rather than a waste. The second step is distributing the nutrients to the whole of the pasture. The third step is making the complex molecules of N and P plant available. The final step is keeping cattle manure in the grazing system to rebuild soil health.  We explored the impact of two grazing systems we named 1) conventional with hay distribution (CHD) and 2) strategic grazing (STR) on  soil C, N, P, bulk density (soil compaction, BD), and cattle density (CD) with the hypothesis that grazing systems can improve soil health and thereby retain and recycle C, N and P. Said more plainly rather than sacrificing areas of the pasture we hoped to regenerate areas that were less productive (cattle camping areas) and make them more productive.

What Did We Do?

We compared a conventional grazing system, baseline (year 2015) factors: C, N, P, BD, and CD to the same factors after two years of CHD and STR. We took soil samples every 50 m at three soil depths (0-5, 5-10 and 10-20 cm) in 2015 (Baseline) and in 2018 (post treatment). Project design follows:

    • Year 1 – Continuous Grazing in eight ~40 ac (16 ha) pastures
      • Waterers, shade, hay and mineral provided in same location
    • Year 2 and 3 – Improved Grazing systems applied:
      • CHD – 4 of eight in continuous with hay distribution and
      • STR – 4 of eight in strategic grazing
        Mixture of better grazing practices

        1. Manure distribution through Lure management of cattle
          Portable shades, Portable waterers, Portable hay rings
        2. Exclusion of compacted areas vulnerable to nutrient loss
        3. Over seeding of exclusions with forage mix
        4. Flash/Mob grazing of excluded areas for short time
        5. Moderate rotational grazing in the sub-paddocks

What Have We Learned?

We found that both the CHD and the STR significantly increased the amount of N and P in the top 5 cm of soil Figure 1. The increase in plant available N in 2018 (sum of ammonium and nitrate) in the top five cm of soil was 5.6 times more in CHD and 5.8 times more in STR when compared to Baseline (2015) (Dahal et al., 2020). The 2018 increase in plant available P was 6.1 times more in CHD and 4.9 times more in STR compared to 2015. We attribute the greater increase in P in CHD to the greater number of hay bales needed during an extensive drought in 2016 (Subedi et al., 2021).

Figure 1. Plant available P (Mehlich-1, left), plant available N (inorganic N, middle), and carbon (loss-on-ignition, right) during Baseline in black and two years after treatments in red.

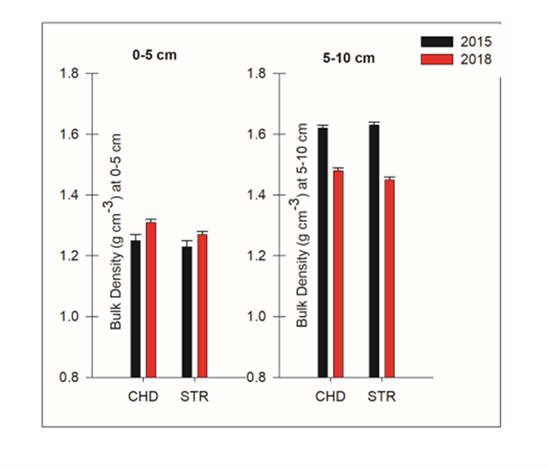
The impact of cattle management on bulk density varied greatly depending on where you were in the pasture which depended on improved management system. While there was a slight increase in bulk density in 0-5 cm soil layer from 2015 to 2018 for both CHD and STR the increases were not significant and would not cause any restrictions on forage growth (Figure 2). In the 5-10 cm soil layer, BDs in both the CHD and STR were significantly reduced. The STR did reduce BD slightly more than in the CHD pastures. Percent change in 2018 BD for STR was -10.5 and for CHD was -8.6.

Figure 2 Bulk density (BD) for the 0-5 cm soil layer (left) and the 5-10 cm soil layer (right).

The reduced compaction in the improved pasture management systems is important for several reasons but here we will discuss only the importance on root growth and nitrogen availability. Bulk density or compaction can restrict forage root growth.  During Baseline pastures had median BD values of greater than 1.6 g cm-3 (Hendricks et al., 2019) which can restrict forage growth. After two years of the improved grazing systems BD was reduced to below 1.45 g cm-3 a value which is usually not restrictive to plant growth. We believe that the decrease in compaction allowed rainfall to move manures into the soil and allow for greater microbial activity.  Above we noted the increase in nitrogen and phosphorus but we did not as yet mention the decrease in the Loss-on-ignition (LOI) carbon. The LOI carbon is composed of larger molecules and requires a great amount of microbial activity to break down and release the plant available nutrients within the molecule. We speculate with the reduced bulk density and associated greater ability of rainfall to move nutrients into the soil, the N and P associated with the cattle manure was able to be decomposed into plant available forms of nitrogen and phosphorus. These assumptions are supported with two indicators of soil microbial activity: greater CO2 emissions and an increase in a labile form of carbon (permanganate oxidizable carbon, in 2018 compared to 2015 (Dahal et al., 2020). The labile form of carbon was also found to increase with depth to 20 cm of soil which suggests that the carbon may not be lost to the atmosphere but maybe moving down in the soil profile.

Take-home messages

    • Cattle grazing can increase nitrogen and phosphorus soil content with improved grazing managements practices: hay distribution and strategic grazing practices designed to distribute cattle dung throughout the pasture and away from areas that are vulnerable to erosion.
    • Improved grazing practices can reduce soil compaction when cattle grazing is well distributed throughout the whole pasture.

Future Plans

We were greatly concerned with the decrease in carbon in both improved grazing systems. However, upon greater analysis of our data (in press) we have found additional information to indicate that carbon (LOI and the labile) is moving down the soil profile. We are in process of studying the C, N, P movement to greater depths and the impact this could also have on the grazing system to also capture and retain rainfall.

Authors

Corresponding and first Author

Dr. Dorcas H. Franklin; Professor; Department of Crop and Soil Sciences; University of Georgia; dfrankln@uga.edu or dory.franklin@uga.edu

Presenting Author

Anish Subedi; Department of Crop and Soil Sciences; University of Georgia; as07817@uga.edu

Additional Authors

Dr. Miguel Cabrera; Professor; Department of Crop and Soil Sciences; University of Georgia; mcabrera@uga.edu

Dr. Subash Dahal; Department of Crop and Soil Sciences; University of Georgia; dahal.green@gmail.com

Amanda McPherson; Department of Crop and Soil Sciences; University of Georgia; Amanda.McPherson@uga.edu

Additional Information

Dahal, S., Franklin, D., Subedi, A., Cabrera, M., Hancock, D., Mahmud, K., Ney, L., Park, C., & Mishra, D. (2020). Strategic grazing in beef-pastures for improved soil health and reduced runoff-nitrate-a step towards sustainability. Sustainability, 12(2), 558.

Subedi, A., Franklin, D., Cabrera, M., McPherson, A., & Dahal, S. (2020). Grazing Systems to Retain and redistribute soil phosphorus and to reduce phosphorus losses in runoff. Soil Systems, 4(4), 66.

Hendricks, T., Franklin, D., Dahal, S., Hancock, D., Stewart, L., Cabrera, M., & Hawkins, G. (2019). Soil carbon and bulk density distribution within 10 Southern Piedmont grazing systems. Journal of Soil and Water Conservation, 74(4), 323-333.

Acknowledgements

Funding: This research was funded by NRCS-USDA, Conservation Innovation Grant. Grant number 69-3A75-14-251.

Acknowledgments: The authors are grateful to USDA-NRCS for their assistance with the first-order soil survey, and to the Sustainable Agriculture Laboratory team, John Rema, and Charles T. Trumbo at the University of Georgia for their endless help in the laboratory and the field.

The Poultry Mega-Manureshed that is the Southeastern USA: Is It Sustainable?

Purpose

Scientists from across the Long-Term Agroecosystem Research (LTAR) network are working to address nutrient management challenges that confront the poultry industry (broilers, layers, pullets, and turkeys) in the context of a “manureshed” – the geographic area surrounding one or more livestock and poultry operations where excess manure nutrients can be recycled for agricultural production. This study focuses on poultry manuresheds identified east of the Mississippi across the Southeast and Mid-Atlantic regions where over 55% of the U.S. poultry production is located. Poultry manure has been used as a fertilizer most extensively on forage and pasture crops grown near poultry houses. Poultry is a highly specialized production system, with a portion of feed grains grown at substantial distance from where the animals are raised. Consequently, nutrients excreted in manure often exceed the nutrient requirements for local crop production. This situation results in surpluses in local soils that receive manure. The surpluses in turn lead to eutrophication of water bodies; that is, the biological enrichment of water bodies derived from nutrient pollution. Without a mechanism to redistribute manure nutrients more widely, the production and manure management system is unsustainable.

What Did We Do

Central to the concept of the manureshed are sources and sinks, which represent spatial extents where the nutrients in livestock and poultry manure produced exceeds the nutrient needs of crops in the area (sources) or falls short of crop needs (sinks). Although manure nitrogen (N) and phosphorus (P) must be co-managed, we focus our analysis on P since the ratio of plant-available N:P in poultry manure is low (< 4:1) relative to crop needs (~ 10:1). We used data from the U.S. Census of Agriculture and estimates from the International Plant Nutrition Institute’s (IPNI) Nutrient Use Geographic Information System (NuGIS) to identify manure-based P produced annually by poultry production, crop nutrient needs for all crops, and fertilizer applied to farmland in each of the 3109 U.S. counties of the 48 conterminous U.S. states in 2012. A classification approach was then used to determine whether each county was a source or a sink. The next step was a step-wise spatial analysis to identify the nearest sink counties available for redistribution of manure-based P from each source county cluster. The result was a “mega-manureshed,” the largest contiguous area of source and sink counties in the United States.

What Have We Learned

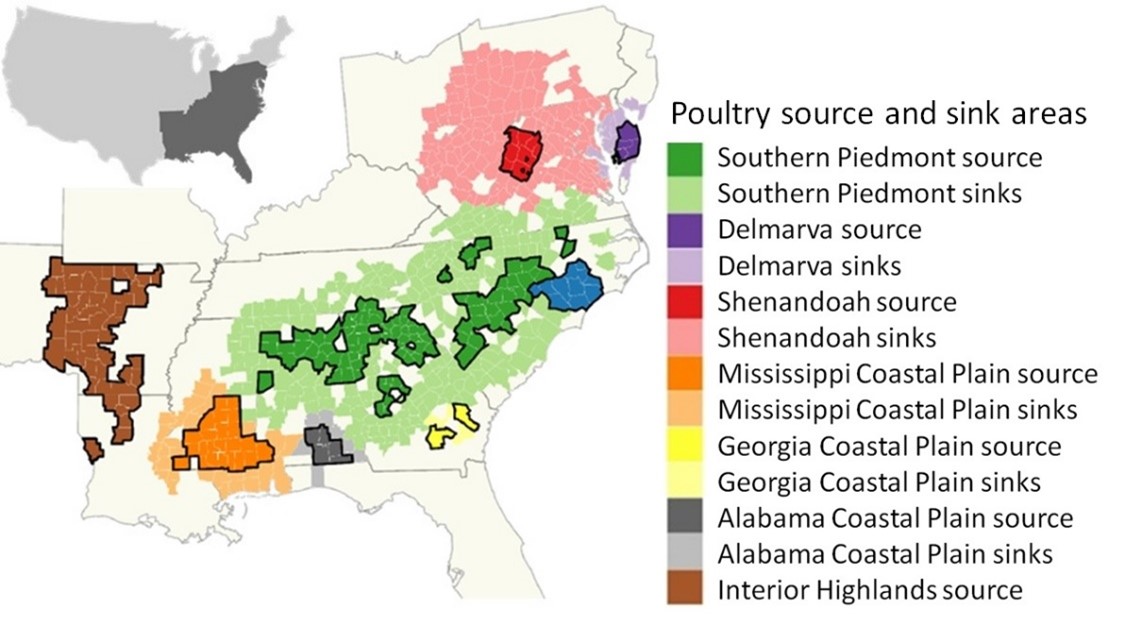
The poultry mega-manureshed extends from the Mid-Atlantic, across the southeast to the Mississippi River and beyond (Figure 1). In the Georgia Coastal Plain manureshed, a component of the megamanureshed, the maximum distance that manure would need to be hauled from source area to sink area is only nine miles. However, in the Southern Piedmont and the Shenandoah manuresheds, the maximum distance that manure would have to be hauled is 65 and 146 miles, respectively. These are conservative estimates. Our analysis does not account for the presence of a large swine manure source area in North Carolina. If those manure nutrients are to be land applied, then additional sink areas would be needed. Additionally, we do not have data on soils that allow us to identify areas where P levels are already excessively high such that additional P should not be added. Both factors would greatly expand the size of the manureshed and increase the maximum hauling distance. Since hauling manure a hundred miles or more is not economically feasible, alternatives, such as pelletizing; use as feedstock for bioenergy and biochar production; and biological, physical, or chemical removal and recovery of nutrients, are needed in order to sustain the poultry industry.

Figure 1. Poultry mega-manureshed: Sources and sinks for P from the Mid-Atlantic across the southeast. Counties shown in white are neither sources nor sinks; P inputs are roughly in balance with crop uptake. The blue area in North Carolina is a P source area from swine

The vertical integration that is characteristic of meat and egg production components of the poultry industry lends itself well to the infrastructure requirements and collective decision making needed to achieve manureshed management. As manure treatment innovations evolve, the U.S. poultry industry is poised to take advantage of insights gained from the manureshed approach to target manure nutrient redistribution efforts.

Future Plans

Over the next 10 years, LTAR researchers will be working with producer partners to conduct long-term field research on the economic and environmental costs and benefits of importing manure nutrients to cropland and grazing land in different climates. Beyond traditional land management and technology research, we will also be working to build societal awareness of the benefits and challenges of the manureshed approach and determine what is needed for widespread support of the concept. LTAR scientists will work to improve or develop new manure treatment technologies. We plan to conduct economic research on the cost effectiveness of different types of management practices, as well as the need for economic incentives.

Authors

Ray B. Bryant, Research Soil Scientist, USDA ARS Pasture Systems and Watershed Management Research Unit, University Park, PA
Ray.Bryant@usda.gov

Additional Authors

    • Dinku M. Endale, USDA-ARS Southeast Watershed Research Laboratory, Tifton, GA (Retired)
    • Sheri A. Spiegal, USDA-ARS Jornada Experimental Range, Las Cruces, NM
      -K. Colton Flynn, USDA-ARS Grassland Soil and Water Research Laboratory, Temple, TX
    • Robert J. Meinen, Senior Extension Associate, Dept. Animal Science, The Pennsylvania State University
    • Michel A. Cavigelli, USDA-ARS Sustainable Agricultural Systems Laboratory, Beltsville, MD
    • Peter J.A. Kleinman, USDA-ARS Soil Management and Sugar Beet Research Unit, Fort Collins, CO

Additional Information

Bryant RB, Endale DM, Spiegal SA, Flynn KC, Meinen RJ, Cavigelli MA, Kleinman PJA. Poultry manureshed management: Opportunities and challenges for a vertically integrated industry. J Environ Qual. 2021 Jul 26. doi: 10.1002/jeq2.20273. Epub ahead of print. PMID: 34309029.

Spiegal, S., Kleinman, P. J. A., Endale, D. M., Bryant, R. B., Dell, C., Goslee, S., … Yang Q. (2020). Manuresheds: Recoupling crop and livestock agriculture for sustainable intensification. Agricultural Systems. 181: 1-13. 102813. Doi: 10.1016/j.agsy.2020.102813.

https://youtu.be/8P2cI4BzLpY

Acknowledgements

This research was a contribution from the Long-Term Agroecosystem Research (LTAR) network. LTAR is supported by the U.S. Department of Agriculture, which is an equal opportunity provider and employer.


The authors are solely responsible for the content of these proceedings. The technical information does not necessarily reflect the official position of the sponsoring agencies or institutions represented by planning committee members, and inclusion and distribution herein does not constitute an endorsement of views expressed by the same. Printed materials included herein are not refereed publications. Citations should appear as follows. EXAMPLE: Authors. 2022. Title of presentation. Waste to Worth. Oregon, OH. April 18-22, 2022. URL of this page. Accessed on: today’s date.
Impacts of New Phosphorous Regulations on Composting of Animal Manures

The Problem

Concerns are mounting in states that have sensitive waterways about the release of P from manure and compost into ground and surface water. P is the limiting nutrient for many freshwater ecosystems and as such regulate the rate of eutrophication and oxygen depletion. The concerns have led to new regulations that limit the application of manure and in some cases compost products that have high concentrations of P.  Also, compost use in stormwater biofiltration swales has been called into question because of the potential leaching of P. There are concerns in the composting industry that the regulations will limit the application of compost and reduce the market for compost products.

Composting can theoretically increase the biological activity of the soil matrix and help the formation of aggregates that absorb nutrients. Compost also contains metals such as iron, magnesium, calcium and aluminum that help bind P to the soil particles.  Composting has a substantial impact on N as the high temperatures result in losses of ammonia. Depending on the stage of composting, the bacterial thermophilic phase of composting can release P during the breakdown of plant and animal tissue. In contrast the curing or fungal phase can bind nutrients into the hyphae and to the stabilized organic substrate. Additionally, soils high in organic C have lower bulk densities and prevent runoff because of the increased water holding capacity and infiltration rates*. The concept is that even though the overall P levels in the soils are increasing with compost application, only a small portion of the P is in the liquid phase and there is sufficient soil and plant uptake to limit P losses.  

*Spargo, J.T., G.K. Evanylo, and M.M. Alley. 2006. Repeated compost application effects on phosphorus runoff in the Virginia Piedmont. J. Environ. Qual. 35:2342–2351.

What did we do?

In 2014, Green Mountain Technologies (GMT) received an Animal Waste

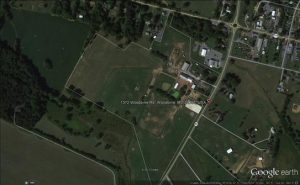
Figure 1. Site map for Days End Farm

Technology Fund (AWTF) grant from the Maryland Department of Agriculture to install an Earth Flow composting systems at Days End Farm (DEF, Fig. 1) in Howard County and Glamor View Farms in Frederick County.  There were two types of manures that were tested, dry pack manure from Glamour View Farms and bedded horse manure from Days End Farm.

Days End Farm Horse Rescue is a non-profit, volunteer-based animal welfare organization established in 1989 to provide care and treatment for horses that have been abused or mistreated.  DEF works to rehabilitate horses, find good homes for them and educate the public about humane treatment of horses. DEF cares for between 100-150 horses annually, rehabilitating them and preparing them for adoption.

Figure 2. Locator map for Glamor View Farms

Glamour View Farm (GVF, Fig. 2) is a 146-acre dairy operation which is a part of Lager Farms. Glamour View houses approximately 180 Holstein and Jersey cows.  In 2014, Green Mountain Technologies (GMT) and GVF received an AWTF grant from the Maryland Department of Agriculture to install an Earth Flow composting system at GVF in Frederick County, Maryland.

Description of the Earth Flow Composting System

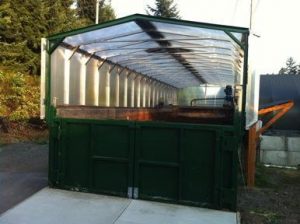
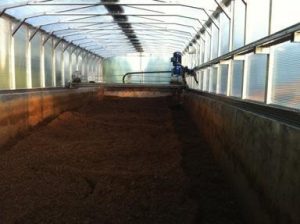
The Earth Flow (Fig. 3 & 4) is an in-vessel composting system that integrates an automated mixing system, aeration system and moisture addition system into the vessel.  The Earth Flow system accelerates the composting process by providing optimum conditions for aerobic composting. The combination of these features facilitates a thermophilic composting process for horse manure and bedding in 10-14 days.

Figure 3. Earth Flow composter end view
Figure 4. Earth Flow composter interior

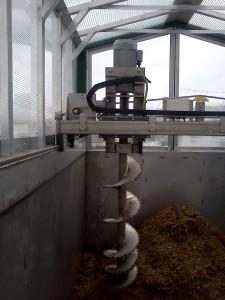
The Earth Flow has an integrated mixing system (Fig. 5) that allows the compost to be mixed on a daily basis (2-4 times per day).  The traveling auger is the key to the effectiveness of the Earth Flow. It provides seven different functions that facilitate the hot composting process:

  1. Shreds.  The auger breaks up manure balls to reduce particle size and expose nutrients to the microbes.
  2. Mixes.  The auger mixes material by smearing manure onto bedding.
  3. Aerates.  The auger continually fluffs the compost to add oxygen to the compost matrix.
  4. Distributes Moisture.  The auger sweeps up wet material from the lower portions of the compost pile and elevates it to the surface.  
  5. Homogenizes.  The auger homogenizes manure with bedding for an even distribution of nutrients.
Figure 5. Auger mixing system
  1. Transports.  The auger slowly increments compost from the load end to the discharge end.
  2. Stacks.  As compost reduces in volume, the auger continually stacks the material toward the back to maximize utilization of the space.


The Earth Flow is designed such that feedstocks are loaded on one end of the vessel and finished product is discharged from the opposite end of the vessel.

The Earth Flow at Days End Farm is operated as a continuous-flow system.  In a continuous-flow system, feedstocks can be loaded at any time on the load end and the traveling auger slowly migrates compost to the discharge end.  Material can be discharged once the vessel is full and/or the user is ready to discharge compost. The standard mixing pattern of the auger is shown below.

The basis of the study was to evaluate whether composting manure would reduce the amount of P, especially the water extractable P compared to raw manure.  The theoretical basis for this reduction is that composting would add more carbon and also tie up P in the increased biomass making it less available to run off.  While N can be lost to the atmosphere as ammonia or converted to elemental nitrogen gas, P is only transportable in liquid phase and can neither be created or destroyed by the normal biological processes.  P is essentially recycled through biomass and decaying plant and animal tissues release P that is the reabsorbed by new living tissue.

Samples of raw manure were collected prior to composting and the same manure was sampled 3-4 weeks later to determine the changes in nutrient levels and water extractable P.  Samples were taken every quarter for a one year period to assess any seasonal changes. One of the proposed applications for the compost product was bedding reuse so some of the focus of the study related to product quality as a recycled bedding material.

What we learned

Bedded Horse Manure

The average total Nitrogen (N) of 0.68% comprised 0.03% Ammonia-N of the loaded mixture (over the study period) with 52% moisture and 48% solids, with a total carbon content of about 40%, resulting in a C:N ratio of 29. Total P in the loaded mixture was 0.17% of which 0.40% was P2O5. For the compost produced during this period, the total N averaged 0.6% (5980 mg/kg) of which 0.06% was ammonia (577 mg/kg) and 0.54% was organic N (5436 mg/kg) and 470 mg/kg nitrate-nitrite N. The total carbon was 44.87% (44867 mg/kg), resulting in a C:N ratio of 214, with an average moisture content of 20% (Tables 3 and 4).

The average N:P ratio for the unloaded compost is 1.5 (5980:4140). Minerals analyzed from the manure and unloaded compost showed variability between samples collected on the different dates, but all measured concentrations of calcium, magnesium, sodium, iron, aluminum, manganese, copper, and zinc were within acceptable ranges. The nearly 30% decrease in moisture content over the composting period was measured, this is of interest as the compost process is optimal at 50% moisture content with a workable range from 40-60%. When moisture reaches 35% or less the material is suitable for screening when producing a product for landscape or horticultural uses. In addition, microbial decomposition (metabolic) activity decreases substantially resulting in insufficient metabolically generated heat within the compost mass. The TKN and C:N data indicate a substantial reduction in N during the compost process. We inquired with Waypoint about data reporting errors as the N values seemed surprisingly low. They had already disposed of the samples so they were not able to rerun the test. They did offer to retest and we may have them run the data points again. If the N data is correct, then a substantial amount of N would have been lost to the air as ammonia. In contrast, two of the three P values were higher in the compost than in the raw manure.  There may be several explanations for this trend. One point of interest as the bedding reuse continues is the accumulation of P in the compost product.

Dairy Dry Pack Manure

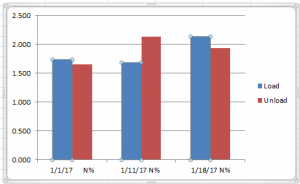
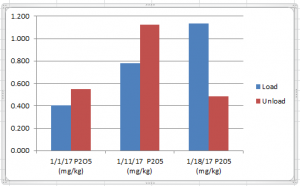
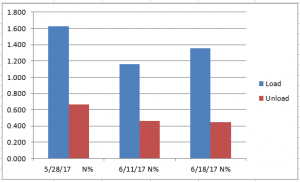
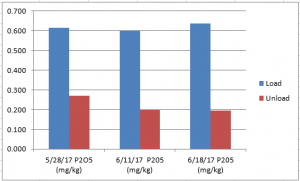
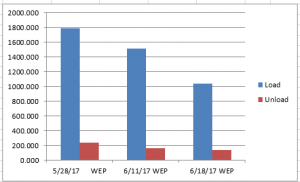
Penn State Labs performed the lab analysis of the raw manure and compost samples on 8/7/17. The lab samples were stored at Michael Calkin’s refrigerator and shipped to Penn State. Two samples were taken at the load and unload ends of the vessel each week and combined into a single grab sample.  Ammonia and Organic N were analyzed as well as P, extractable P and carbon. Because Glamor View is operated as a batch system, the initial sample on 5/28/17 represents the raw manure at both the load and unload ends of the vessel. Each subsequent lab analysis shows the weekly change in N or P as the manure turns into compost as shown below (Fig. 6 – 8).  

Figure 6. Nitrogen levels of dry pack manure before and after composting.
Figure 7. P2O5 levels of dry pack manure before and after composting.
Figure 8. Water extractable phosphorus levels before and after composting.

Winter 2017

The nutrient levels showed no clear trend of diminishment during the 3 weeks of monitoring as shown in Table 1. The average N actually increased which seems highly unlikely given ammonia losses typically experienced during composting. The good news is that it has reasonable fertilizer value when compared to typical composts. The average P2O5 levels were unchanged during the 3-week sampling also. The water extractable P showed a slight downward trend but once again the data was scattered. The only conclusion we can make from the data is that more P was liberated during the thermophilic phase of composting than was bound up by bacterial bodies.  In retrospect, additional water extractable samples should have been performed on the cured compost to see how much water extractable P is in the product immediately before the compost is applied to fields or gardens.

Table 1. Lab Analysis of Bedded Horse Manure Before and After Three Weeks of Composting
Average results for Compost Feedstock Loaded into the Earth Flow unit at

Days End Farm in

December 2015

Average results for Compost Unloaded from Earth Flow unit at

Days End Farm in

December 2015

TEST Dec 2015 Summary (%) Average result-Dec 2015 (mg/Kg) TESTα Dec 2015 Summary (%) Average result-Dec 2015 (mg/Kg)
As Received Dry basis
Nitrogen, N % 0.39 0.95
Ammonical-N % 0.07 0.16 Total Kjeldahl Nitrogen 1.12 11200.00
Phosphorus, P % 0.10 0.23 Total Phosphorus 0.33 3346.67
Potassium, K % 0.36 0.87 Total Potassium 1.10 11033.33
Sulfur, S % 0.06 0.14 Total Sulfur 0.19 1923.33*
Magnesium, Mg % 0.13 0.32 Total Magnesium 0.38 3760.00*
Calcium, Ca % 1.76 4.53 Total Calcium 2.35 23466.67*
Sodium, Na ppm 602.00 1480.00 Total Sodium 0.18 1773.33*
Iron, Fe ppm 889.00 2173.33 Total Iron 4310.00*
Aluminum, Al ppm 368.33 873.00 Total Aluminum 3500.00*
Manganese, Mn ppm 93.07 230.00 Total Manganese 278.67*
Copper, Cu ppm 8.05 19.77 Total Copper 26.33*
Zinc, Zn ppm 33.60 82.93 Total Zinc 91.33*
Boron, B ppm 2.50 6.12 Total Volatile Solids 78.14 781400.00
Test Result Result
Moisture % 59.5 Moisture † 31.46 Moisture †
Solid % 40.5 Total Solids † 68.54 685366.67
Additional Tests Result
P2O5 (as received) , % 16.41 C/N RATIO † 40.67
K2O (as received) , % 0.428 Carbon (TOC) † 45.43 454333.33
αAll values are on a dry weight basis, except as noted by†; Detection limit on all N series is on a wet basis.

*Within normal range, Analyses by Waypoint Laboratories, Richmond, VA

Figure 9. Nitrogen levels of dry pack manure before and after composting.
Figure 10. P2O5 levels of dry pack manure before and after composting.
Figure 11. Water extractable phosphorus levels before and after composting.

Spring 2017

Unlike the last sampling event over the winter, the nutrient levels showed a clear trend of diminishment during the 3 weeks of monitoring as shown in Fig. 9-11.  The average N reduced by 30% or more during the three weeks of composting. The average P2O5 levels showed a downward trend on the unload and unchanged on the load end which is expected given that P is not lost in the compost process.  The water extractable P had a clear downward trend for both the load and unload ends of the vessel with an average 42% reduction over the 3 weeks. Water extractable P is more important than a reduction in the P2O5 levels as it indicates the amount of P available for leaching.  In general, the lab data supported the trends that are typical of composting. It is not clear if the change over the winter results were seasonal or if the sampling methods were inconsistent. One possibility is the change in feed type that the heifers receive in the summer vs winter.  In retrospect, additional water extractable samples should have been performed on the cured compost to see how much water extractable P is in the product immediately before the compost is applied to fields or gardens. This sampling would have provided a more complete picture of the entire compost process for nutrient management.   

Next Steps

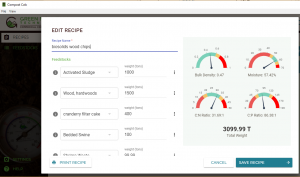
There is no doubt that P chemistry and bioavailability are complicated subjects.  Based on this work and studies done by Larry Sikora at USDA and John Spargo there needs to be a more comprehensive study performed with greater control of variables to demonstrate what might actually happen in the field with P availability and losses in compost. The other effort GMT is involved in is the development of a compost feedstock recipe calculator that includes values for different feedstock P concentrations and also performs C/P ratio calculations (Fig. 12).  The calculator has an interactive dial format that immediately shows the user how the volumes of different feedstocks changes not only C/N but C/P ratios as shown below. The hope is that the software will raise awareness about P and help to make compost products with balanced nutrient ratios.

Figure 12. User interface for Compost Calc recipe calculating software.

Authors

Michael Bryan-Brown, Green Mountain Technologies, mbb@compostingtechnology.com


The authors are solely responsible for the content of these proceedings. The technical information does not necessarily reflect the official position of the sponsoring agencies or institutions represented by planning committee members, and inclusion and distribution herein does not constitute an endorsement of views expressed by the same. Printed materials included herein are not refereed publications. Citations should appear as follows. EXAMPLE: Authors. 2019. Title of presentation. Waste to Worth. Minneapolis, MN. April 22-26, 2019. URL of this page. Accessed on: today’s date.
Predicting Manure Nitrogen and Phosphorus Characteristics of Beef Open Lot Systems

This project involves the analysis of a new data set for manure characteristics from open lot beef systems demonstrating both average characteristics and factors contribution to variability in manure characteristics among these systems. Defining the characteristics and quantities of harvested manure and runoff from open earthen lot animal systems is critical to planning storage requirements, land requirements for nutrient utilization, land application rates, and logistical issues, such as equipment and labor requirements. Accuracy of these estimates are critical to planning processes required by federal and state permitting programs. Poor estimates can lead to discharges that result in court action and fines, neighbor nuisance complaints, and surface and ground water degradation. Planning procedures have historically relied upon standard values published by NRCS (Stettler et al., 2008), MWPS (Lorimor et al., 2000), and ASABE (2014) for average characteristics.

What Did We Do?

A large data set of analyses from manure samples collected over a 15-year period from 444 independent cattle feedlot pens at a single eastern Nebraska research facility was reviewed to provide insight to the degree of variability in observed manure characteristics and to investigate the factors influencing this variability. No previous efforts to define these characteristics have included data gathered over such a wide range of dietary strategies and weather conditions. This exclusive research data set is expected to provide new insights regarding influential factors affecting characteristics of manure and runoff harvested from open lot beef systems. The objective of this paper is to share a preliminary summary of findings based upon a review of this data set.

What Have We Learned?

A review of this unique data set reveals several important preliminary observations. Standard values reported by ASABE and MWPS for beef manure characteristics in open lot systems are relatively poor indicators of the significant variability that is observed within open lot feeding systems. Our data set reveals significant differences between manure characteristics as a function of feeding period (Table 1) and substantial variability within feeding period, as illustrated by the large coefficients of variation for individual characteristics. Differences in winter and summer conditions influence the characteristics and quantities of solids, organic matter, and nutrients in the harvested manure. The timing of the feeding period has substantial influence on observed differences in nitrogen loss and nitrogen in manure (Figure 1). Nitrogen recovery for the warmer summer feeding periods averaged 51 and 6 grams/head/day in the manure and runoff, respectively, with losses estimated to be 155 grams/head/day.  Similarly, nitrogen recovery in manure and runoff for the winter feeding period was 90 and 4 grams/head/day, respectively, with losses estimated at 92 grams/head/day (Figure 1 and Koelsch, et al., 2018). In addition, differences in weather and pen conditions during and following winter and summer feeding periods impact manure moisture content and the mixing of inorganics with manure (Table 1).

Table 1. Characteristics of manure collected from 216 and 228 cattle feedlot pens during Summer and Winter feeding periods, respectively1.
University of Nebraska Feedlot in East Central Nebraska Standard Values
Summer Winter ASABE NRCS MWPS3
Mean CV2 Mean CV2 Mean Mean
Total Manure (wet basis), kg/hd/d 9.3 99% 13.1 43% 7.5 7.9
DM    % 71% 10% 63.2% 15% 67% Collected 55%
    kg/hd/d 5.4 80% 8.0 41% 5.0 manure 4.3
OM    % 24% 28% 25.3% 41% 30% is not 50%
    kg/hd/d 1.00 52% 1.87 41% 1.5 reported. 2.2
Ash    % 76% 9% 74.7% 14% 70% 50%
    kg/hd/d 4.16 72% 6.10 49% 3.5 2.2
N    % 1.3% 36% 1.19% 23% 1.18% 1.2%
    g/hd/d 51 50% 90 33% 88 95
P    % 0.37% 41% 0.34% 29% 0.50% 0.35%
    k/hd/d 17.7 55% 26.0 42% 37.5 27.7
DM = dry matter; OM = organic matter (or volatile solids)

1    Summer = April to October feeding period, Winter = November to May feeding period

2    Coefficient of variation, %

3    Unsurfaced lot in dry climate with annual manure removal.

two pie charts
Figure 1. Distribution of dietary nitrogen consumed by beef cattle among four possible ed points for summer and winter feeding periods.

Dietary concentration of nutrients was observed to influence the harvested manure P content (Figure 2) but produce minimal impact on harvested manure N content (not shown). Diet was an important predictor in observed N losses, especially during the summer feeding period. However, its limited value for predicting harvested manure N and moderate value for predicting harvesting manure P suggests that other factors such as weather and management may be influential in determining N and P recovered (Koelsch, et al., 2018).

scatter plot with trendlines
Figure 2. Influence of dietary P concentration on harvested manure P.

Significant variability exists in the quantity of total solids of manure harvested with a factor of 10 difference between the observed low and high values when compared on a mass per finished head basis (note large CVs in Table 1). This variability has significant influence on quality of the manure collected as represented by organic matter, ash content, and moisture content.

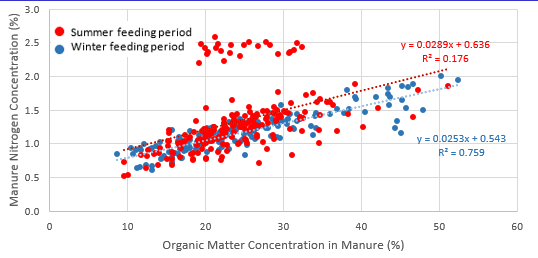
Although individual experimental trials comparing practices to increase organic matter on the feedlot surface have demonstrated some benefit to reducing nitrogen losses, the overall data set does not demonstrate value from higher pen surface organic matter for conservation of N in the manure (Koelsch, et al., 2018). However, higher organic matter manure is correlated to improved nitrogen concentration in the manure suggesting a higher value for the manure (Figure 3).

scatter plot with trendlines
Figure 3. Influence of pen surface organic matter measured as organic matter in the harvested manure) on nitrogen concentration in the manure.

It is typically recommended that manure management planning should be based upon unique analysis for manure characteristics representative of the manure being applied.  The large variability in harvested manure from open lot beef systems observed in this study further confirms the importance of this recommendation. The influence of weather on the manure and the management challenges of collecting manure from these systems adds to the complexity of predicting manure characteristics.  In addition, standard reporting methods such as ASABE should consider reporting of separate standard values based upon time of the year feeding and/or manure collection period. This review of beef manure characteristics over a 15 year period further documents the challenge of planning based upon typical or standard value for open lot beef manure.

Future Plans

The compilation and analysis of the manure and runoff data from these 444 independent measure of feedlot manure characteristics is a part of an undergraduate student research experience. Final review and analysis of this data will be completed by summer 2019 with the data published at a later time. The authors will explore the value of this data for adjusting beef manure characteristics for ASABE’s Standard (ASABE, 2014).

References

ASABE. 2014.  ASAE D384.2 MAR2005 (R2014):  Manure Production and Characteristics. ASABE, St. Joseph, Ml. 32 pages.

Koelsch, R. , G. Erickson2, M. Homolka2, M. Luebbe. 2018. redicting Manure Nitrogen, Phosphorus, and Carbon Characteristics of Beef Open Lot Systems. Presented at the 2018 ASABE Annual International Meeting. 15 pages.

Lorimor, J., W. Powers, and A. Sutton. 2000. Manure characteristics. Manure Management Systems Series MWPS-18. Midwest Plan Service. Ames Iowa: Iowa State University.

Stettler, D., C. Zuller, D. Hickman. 2008. Agricultural Waste Characteristics.  Chapter 4 of Part 651, NRCS Agricultural Waste Management Field Handbook. pages 4-1 to 4-32.


Authors

Richard (Rick) Koelsch, Professor of Biological Systems Engineering and Animal Science, University of Nebraska-Lincoln

rkoelsch1@unl.edu

Megan Homolka, student, and Galen Erickson Professor of Animal Science, University of Nebraska-Lincoln

Additional Information

Koelsch, R. , G. Erickson2, M. Homolka2, M. Luebbe. 2018. Predicting Manure Nitrogen, Phosphorus, and Carbon Characteristics of Beef Open Lot Systems. Presented at the 2018 ASABE Annual International Meeting. 15 pages.


The authors are solely responsible for the content of these proceedings. The technical information does not necessarily reflect the official position of the sponsoring agencies or institutions represented by planning committee members, and inclusion and distribution herein does not constitute an endorsement of views expressed by the same. Printed materials included herein are not refereed publications. Citations should appear as follows. EXAMPLE: Authors. 2019. Title of presentation. Waste to Worth. Minneapolis, MN. April 22-26, 2019. URL of this page. Accessed on: today’s date.