
This webinar focuses on nitrogen and phosphorus inventories at two watershed scales, and how manure nutrients are incorporated. This presentation was originally broadcast on September 20, 2019. More… Continue reading “Watershed Nutrient Inventories – Opportunities and Needs”
Impacts of New Phosphorous Regulations on Composting of Animal Manures
The Problem
Concerns are mounting in states that have sensitive waterways about the release of P from manure and compost into ground and surface water. P is the limiting nutrient for many freshwater ecosystems and as such regulate the rate of eutrophication and oxygen depletion. The concerns have led to new regulations that limit the application of manure and in some cases compost products that have high concentrations of P. Also, compost use in stormwater biofiltration swales has been called into question because of the potential leaching of P. There are concerns in the composting industry that the regulations will limit the application of compost and reduce the market for compost products.
Composting can theoretically increase the biological activity of the soil matrix and help the formation of aggregates that absorb nutrients. Compost also contains metals such as iron, magnesium, calcium and aluminum that help bind P to the soil particles. Composting has a substantial impact on N as the high temperatures result in losses of ammonia. Depending on the stage of composting, the bacterial thermophilic phase of composting can release P during the breakdown of plant and animal tissue. In contrast the curing or fungal phase can bind nutrients into the hyphae and to the stabilized organic substrate. Additionally, soils high in organic C have lower bulk densities and prevent runoff because of the increased water holding capacity and infiltration rates*. The concept is that even though the overall P levels in the soils are increasing with compost application, only a small portion of the P is in the liquid phase and there is sufficient soil and plant uptake to limit P losses.
*Spargo, J.T., G.K. Evanylo, and M.M. Alley. 2006. Repeated compost application effects on phosphorus runoff in the Virginia Piedmont. J. Environ. Qual. 35:2342–2351.
What did we do?
In 2014, Green Mountain Technologies (GMT) received an Animal Waste

Technology Fund (AWTF) grant from the Maryland Department of Agriculture to install an Earth Flow composting systems at Days End Farm (DEF, Fig. 1) in Howard County and Glamor View Farms in Frederick County. There were two types of manures that were tested, dry pack manure from Glamour View Farms and bedded horse manure from Days End Farm.
Days End Farm Horse Rescue is a non-profit, volunteer-based animal welfare organization established in 1989 to provide care and treatment for horses that have been abused or mistreated. DEF works to rehabilitate horses, find good homes for them and educate the public about humane treatment of horses. DEF cares for between 100-150 horses annually, rehabilitating them and preparing them for adoption.

Glamour View Farm (GVF, Fig. 2) is a 146-acre dairy operation which is a part of Lager Farms. Glamour View houses approximately 180 Holstein and Jersey cows. In 2014, Green Mountain Technologies (GMT) and GVF received an AWTF grant from the Maryland Department of Agriculture to install an Earth Flow composting system at GVF in Frederick County, Maryland.
Description of the Earth Flow Composting System
The Earth Flow (Fig. 3 & 4) is an in-vessel composting system that integrates an automated mixing system, aeration system and moisture addition system into the vessel. The Earth Flow system accelerates the composting process by providing optimum conditions for aerobic composting. The combination of these features facilitates a thermophilic composting process for horse manure and bedding in 10-14 days.


The Earth Flow has an integrated mixing system (Fig. 5) that allows the compost to be mixed on a daily basis (2-4 times per day). The traveling auger is the key to the effectiveness of the Earth Flow. It provides seven different functions that facilitate the hot composting process:
- Shreds. The auger breaks up manure balls to reduce particle size and expose nutrients to the microbes.
- Mixes. The auger mixes material by smearing manure onto bedding.
- Aerates. The auger continually fluffs the compost to add oxygen to the compost matrix.
- Distributes Moisture. The auger sweeps up wet material from the lower portions of the compost pile and elevates it to the surface.
- Homogenizes. The auger homogenizes manure with bedding for an even distribution of nutrients.

- Transports. The auger slowly increments compost from the load end to the discharge end.
- Stacks. As compost reduces in volume, the auger continually stacks the material toward the back to maximize utilization of the space.
The Earth Flow is designed such that feedstocks are loaded on one end of the vessel and finished product is discharged from the opposite end of the vessel.
The Earth Flow at Days End Farm is operated as a continuous-flow system. In a continuous-flow system, feedstocks can be loaded at any time on the load end and the traveling auger slowly migrates compost to the discharge end. Material can be discharged once the vessel is full and/or the user is ready to discharge compost. The standard mixing pattern of the auger is shown below.
The basis of the study was to evaluate whether composting manure would reduce the amount of P, especially the water extractable P compared to raw manure. The theoretical basis for this reduction is that composting would add more carbon and also tie up P in the increased biomass making it less available to run off. While N can be lost to the atmosphere as ammonia or converted to elemental nitrogen gas, P is only transportable in liquid phase and can neither be created or destroyed by the normal biological processes. P is essentially recycled through biomass and decaying plant and animal tissues release P that is the reabsorbed by new living tissue.
Samples of raw manure were collected prior to composting and the same manure was sampled 3-4 weeks later to determine the changes in nutrient levels and water extractable P. Samples were taken every quarter for a one year period to assess any seasonal changes. One of the proposed applications for the compost product was bedding reuse so some of the focus of the study related to product quality as a recycled bedding material.
What we learned
Bedded Horse Manure
The average total Nitrogen (N) of 0.68% comprised 0.03% Ammonia-N of the loaded mixture (over the study period) with 52% moisture and 48% solids, with a total carbon content of about 40%, resulting in a C:N ratio of 29. Total P in the loaded mixture was 0.17% of which 0.40% was P2O5. For the compost produced during this period, the total N averaged 0.6% (5980 mg/kg) of which 0.06% was ammonia (577 mg/kg) and 0.54% was organic N (5436 mg/kg) and 470 mg/kg nitrate-nitrite N. The total carbon was 44.87% (44867 mg/kg), resulting in a C:N ratio of 214, with an average moisture content of 20% (Tables 3 and 4).
The average N:P ratio for the unloaded compost is 1.5 (5980:4140). Minerals analyzed from the manure and unloaded compost showed variability between samples collected on the different dates, but all measured concentrations of calcium, magnesium, sodium, iron, aluminum, manganese, copper, and zinc were within acceptable ranges. The nearly 30% decrease in moisture content over the composting period was measured, this is of interest as the compost process is optimal at 50% moisture content with a workable range from 40-60%. When moisture reaches 35% or less the material is suitable for screening when producing a product for landscape or horticultural uses. In addition, microbial decomposition (metabolic) activity decreases substantially resulting in insufficient metabolically generated heat within the compost mass. The TKN and C:N data indicate a substantial reduction in N during the compost process. We inquired with Waypoint about data reporting errors as the N values seemed surprisingly low. They had already disposed of the samples so they were not able to rerun the test. They did offer to retest and we may have them run the data points again. If the N data is correct, then a substantial amount of N would have been lost to the air as ammonia. In contrast, two of the three P values were higher in the compost than in the raw manure. There may be several explanations for this trend. One point of interest as the bedding reuse continues is the accumulation of P in the compost product.
Dairy Dry Pack Manure
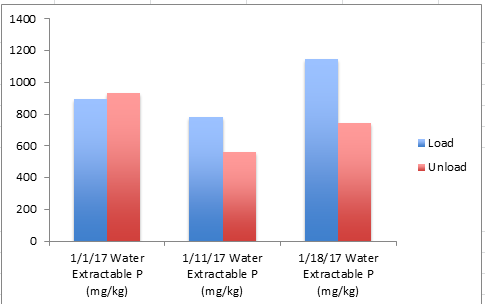
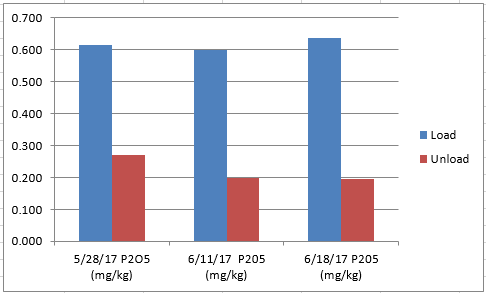
Penn State Labs performed the lab analysis of the raw manure and compost samples on 8/7/17. The lab samples were stored at Michael Calkin’s refrigerator and shipped to Penn State. Two samples were taken at the load and unload ends of the vessel each week and combined into a single grab sample. Ammonia and Organic N were analyzed as well as P, extractable P and carbon. Because Glamor View is operated as a batch system, the initial sample on 5/28/17 represents the raw manure at both the load and unload ends of the vessel. Each subsequent lab analysis shows the weekly change in N or P as the manure turns into compost as shown below (Fig. 6 – 8).


Winter 2017
The nutrient levels showed no clear trend of diminishment during the 3 weeks of monitoring as shown in Table 1. The average N actually increased which seems highly unlikely given ammonia losses typically experienced during composting. The good news is that it has reasonable fertilizer value when compared to typical composts. The average P2O5 levels were unchanged during the 3-week sampling also. The water extractable P showed a slight downward trend but once again the data was scattered. The only conclusion we can make from the data is that more P was liberated during the thermophilic phase of composting than was bound up by bacterial bodies. In retrospect, additional water extractable samples should have been performed on the cured compost to see how much water extractable P is in the product immediately before the compost is applied to fields or gardens.
| Table 1. Lab Analysis of Bedded Horse Manure Before and After Three Weeks of Composting | |||||
|---|---|---|---|---|---|
| Average results for Compost Feedstock Loaded into the Earth Flow unit at
Days End Farm in December 2015 |
Average results for Compost Unloaded from Earth Flow unit at
Days End Farm in December 2015 |
||||
| TEST | Dec 2015 Summary (%) | Average result-Dec 2015 (mg/Kg) | TESTα | Dec 2015 Summary (%) | Average result-Dec 2015 (mg/Kg) |
| As Received | Dry basis | ||||
| Nitrogen, N % | 0.39 | 0.95 | |||
| Ammonical-N % | 0.07 | 0.16 | Total Kjeldahl Nitrogen | 1.12 | 11200.00 |
| Phosphorus, P % | 0.10 | 0.23 | Total Phosphorus | 0.33 | 3346.67 |
| Potassium, K % | 0.36 | 0.87 | Total Potassium | 1.10 | 11033.33 |
| Sulfur, S % | 0.06 | 0.14 | Total Sulfur | 0.19 | 1923.33* |
| Magnesium, Mg % | 0.13 | 0.32 | Total Magnesium | 0.38 | 3760.00* |
| Calcium, Ca % | 1.76 | 4.53 | Total Calcium | 2.35 | 23466.67* |
| Sodium, Na ppm | 602.00 | 1480.00 | Total Sodium | 0.18 | 1773.33* |
| Iron, Fe ppm | 889.00 | 2173.33 | Total Iron | 4310.00* | |
| Aluminum, Al ppm | 368.33 | 873.00 | Total Aluminum | 3500.00* | |
| Manganese, Mn ppm | 93.07 | 230.00 | Total Manganese | 278.67* | |
| Copper, Cu ppm | 8.05 | 19.77 | Total Copper | 26.33* | |
| Zinc, Zn ppm | 33.60 | 82.93 | Total Zinc | 91.33* | |
| Boron, B ppm | 2.50 | 6.12 | Total Volatile Solids | 78.14 | 781400.00 |
| Test | Result | Result | |||
| Moisture % | 59.5 | Moisture † | 31.46 | Moisture † | |
| Solid % | 40.5 | Total Solids † | 68.54 | 685366.67 | |
| Additional Tests | Result | ||||
| P2O5 (as received) , % | 16.41 | C/N RATIO † | 40.67 | ||
| K2O (as received) , % | 0.428 | Carbon (TOC) † | 45.43 | 454333.33 | |
| αAll values are on a dry weight basis, except as noted by†; Detection limit on all N series is on a wet basis.
*Within normal range, Analyses by Waypoint Laboratories, Richmond, VA |
|||||


Spring 2017
Unlike the last sampling event over the winter, the nutrient levels showed a clear trend of diminishment during the 3 weeks of monitoring as shown in Fig. 9-11. The average N reduced by 30% or more during the three weeks of composting. The average P2O5 levels showed a downward trend on the unload and unchanged on the load end which is expected given that P is not lost in the compost process. The water extractable P had a clear downward trend for both the load and unload ends of the vessel with an average 42% reduction over the 3 weeks. Water extractable P is more important than a reduction in the P2O5 levels as it indicates the amount of P available for leaching. In general, the lab data supported the trends that are typical of composting. It is not clear if the change over the winter results were seasonal or if the sampling methods were inconsistent. One possibility is the change in feed type that the heifers receive in the summer vs winter. In retrospect, additional water extractable samples should have been performed on the cured compost to see how much water extractable P is in the product immediately before the compost is applied to fields or gardens. This sampling would have provided a more complete picture of the entire compost process for nutrient management.
Next Steps
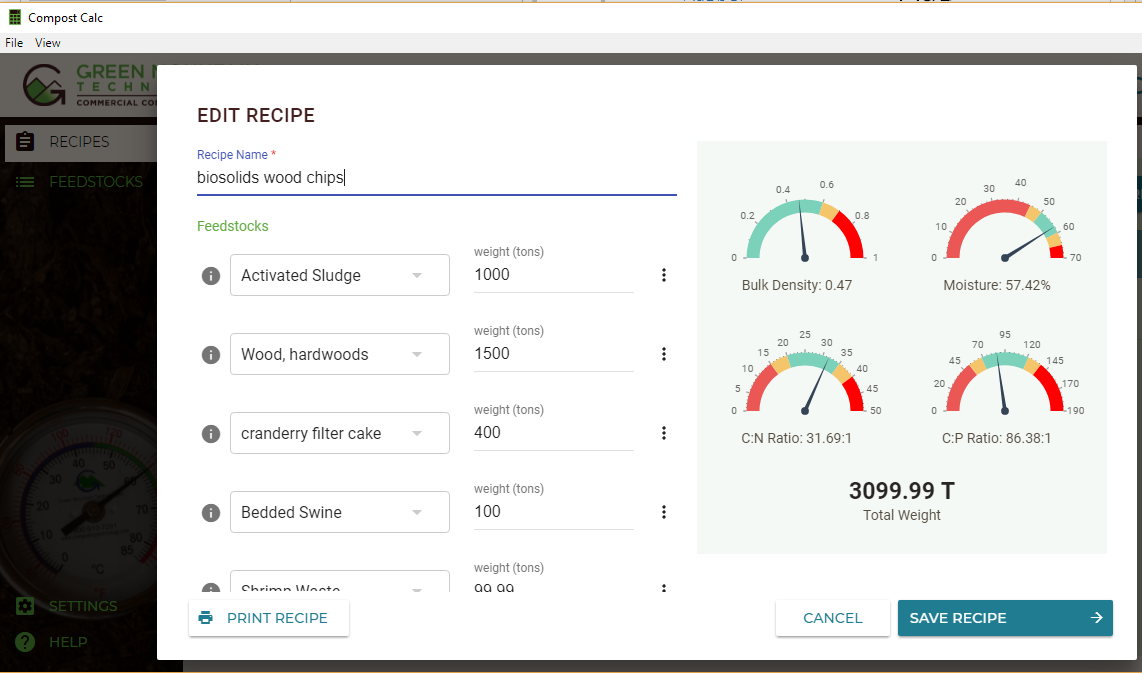
There is no doubt that P chemistry and bioavailability are complicated subjects. Based on this work and studies done by Larry Sikora at USDA and John Spargo there needs to be a more comprehensive study performed with greater control of variables to demonstrate what might actually happen in the field with P availability and losses in compost. The other effort GMT is involved in is the development of a compost feedstock recipe calculator that includes values for different feedstock P concentrations and also performs C/P ratio calculations (Fig. 12). The calculator has an interactive dial format that immediately shows the user how the volumes of different feedstocks changes not only C/N but C/P ratios as shown below. The hope is that the software will raise awareness about P and help to make compost products with balanced nutrient ratios.
Authors
Michael Bryan-Brown, Green Mountain Technologies, mbb@compostingtechnology.com
The authors are solely responsible for the content of these proceedings. The technical information does not necessarily reflect the official position of the sponsoring agencies or institutions represented by planning committee members, and inclusion and distribution herein does not constitute an endorsement of views expressed by the same. Printed materials included herein are not refereed publications. Citations should appear as follows. EXAMPLE: Authors. 2019. Title of presentation. Waste to Worth. Minneapolis, MN. April 22-26, 2019. URL of this page. Accessed on: today’s date.
Predicting Manure Nitrogen and Phosphorus Characteristics of Beef Open Lot Systems
This project involves the analysis of a new data set for manure characteristics from open lot beef systems demonstrating both average characteristics and factors contribution to variability in manure characteristics among these systems. Defining the characteristics and quantities of harvested manure and runoff from open earthen lot animal systems is critical to planning storage requirements, land requirements for nutrient utilization, land application rates, and logistical issues, such as equipment and labor requirements. Accuracy of these estimates are critical to planning processes required by federal and state permitting programs. Poor estimates can lead to discharges that result in court action and fines, neighbor nuisance complaints, and surface and ground water degradation. Planning procedures have historically relied upon standard values published by NRCS (Stettler et al., 2008), MWPS (Lorimor et al., 2000), and ASABE (2014) for average characteristics.
What Did We Do?
A large data set of analyses from manure samples collected over a 15-year period from 444 independent cattle feedlot pens at a single eastern Nebraska research facility was reviewed to provide insight to the degree of variability in observed manure characteristics and to investigate the factors influencing this variability. No previous efforts to define these characteristics have included data gathered over such a wide range of dietary strategies and weather conditions. This exclusive research data set is expected to provide new insights regarding influential factors affecting characteristics of manure and runoff harvested from open lot beef systems. The objective of this paper is to share a preliminary summary of findings based upon a review of this data set.
What Have We Learned?
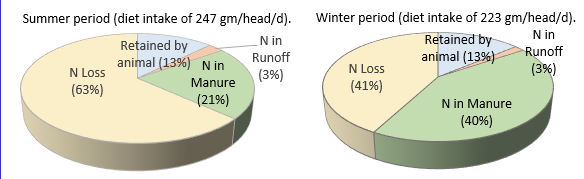
A review of this unique data set reveals several important preliminary observations. Standard values reported by ASABE and MWPS for beef manure characteristics in open lot systems are relatively poor indicators of the significant variability that is observed within open lot feeding systems. Our data set reveals significant differences between manure characteristics as a function of feeding period (Table 1) and substantial variability within feeding period, as illustrated by the large coefficients of variation for individual characteristics. Differences in winter and summer conditions influence the characteristics and quantities of solids, organic matter, and nutrients in the harvested manure. The timing of the feeding period has substantial influence on observed differences in nitrogen loss and nitrogen in manure (Figure 1). Nitrogen recovery for the warmer summer feeding periods averaged 51 and 6 grams/head/day in the manure and runoff, respectively, with losses estimated to be 155 grams/head/day. Similarly, nitrogen recovery in manure and runoff for the winter feeding period was 90 and 4 grams/head/day, respectively, with losses estimated at 92 grams/head/day (Figure 1 and Koelsch, et al., 2018). In addition, differences in weather and pen conditions during and following winter and summer feeding periods impact manure moisture content and the mixing of inorganics with manure (Table 1).
| Table 1. Characteristics of manure collected from 216 and 228 cattle feedlot pens during Summer and Winter feeding periods, respectively1. | ||||||||||
|---|---|---|---|---|---|---|---|---|---|---|
| University of Nebraska Feedlot in East Central Nebraska | Standard Values | |||||||||
| Summer | Winter | ASABE | NRCS | MWPS3 | ||||||
| Mean | CV2 | Mean | CV2 | Mean | Mean | |||||
| Total Manure (wet basis), kg/hd/d | 9.3 | 99% | 13.1 | 43% | 7.5 | 7.9 | ||||
| DM % | 71% | 10% | 63.2% | 15% | 67% | Collected | 55% | |||
| kg/hd/d | 5.4 | 80% | 8.0 | 41% | 5.0 | manure | 4.3 | |||
| OM % | 24% | 28% | 25.3% | 41% | 30% | is not | 50% | |||
| kg/hd/d | 1.00 | 52% | 1.87 | 41% | 1.5 | reported. | 2.2 | |||
| Ash % | 76% | 9% | 74.7% | 14% | 70% | 50% | ||||
| kg/hd/d | 4.16 | 72% | 6.10 | 49% | 3.5 | 2.2 | ||||
| N % | 1.3% | 36% | 1.19% | 23% | 1.18% | 1.2% | ||||
| g/hd/d | 51 | 50% | 90 | 33% | 88 | 95 | ||||
| P % | 0.37% | 41% | 0.34% | 29% | 0.50% | 0.35% | ||||
| k/hd/d | 17.7 | 55% | 26.0 | 42% | 37.5 | 27.7 | ||||
| DM = dry matter; OM = organic matter (or volatile solids)
1 Summer = April to October feeding period, Winter = November to May feeding period 2 Coefficient of variation, % 3 Unsurfaced lot in dry climate with annual manure removal. |
||||||||||
Dietary concentration of nutrients was observed to influence the harvested manure P content (Figure 2) but produce minimal impact on harvested manure N content (not shown). Diet was an important predictor in observed N losses, especially during the summer feeding period. However, its limited value for predicting harvested manure N and moderate value for predicting harvesting manure P suggests that other factors such as weather and management may be influential in determining N and P recovered (Koelsch, et al., 2018).

Significant variability exists in the quantity of total solids of manure harvested with a factor of 10 difference between the observed low and high values when compared on a mass per finished head basis (note large CVs in Table 1). This variability has significant influence on quality of the manure collected as represented by organic matter, ash content, and moisture content.
Although individual experimental trials comparing practices to increase organic matter on the feedlot surface have demonstrated some benefit to reducing nitrogen losses, the overall data set does not demonstrate value from higher pen surface organic matter for conservation of N in the manure (Koelsch, et al., 2018). However, higher organic matter manure is correlated to improved nitrogen concentration in the manure suggesting a higher value for the manure (Figure 3).

It is typically recommended that manure management planning should be based upon unique analysis for manure characteristics representative of the manure being applied. The large variability in harvested manure from open lot beef systems observed in this study further confirms the importance of this recommendation. The influence of weather on the manure and the management challenges of collecting manure from these systems adds to the complexity of predicting manure characteristics. In addition, standard reporting methods such as ASABE should consider reporting of separate standard values based upon time of the year feeding and/or manure collection period. This review of beef manure characteristics over a 15 year period further documents the challenge of planning based upon typical or standard value for open lot beef manure.
Future Plans
The compilation and analysis of the manure and runoff data from these 444 independent measure of feedlot manure characteristics is a part of an undergraduate student research experience. Final review and analysis of this data will be completed by summer 2019 with the data published at a later time. The authors will explore the value of this data for adjusting beef manure characteristics for ASABE’s Standard (ASABE, 2014).
References
ASABE. 2014. ASAE D384.2 MAR2005 (R2014): Manure Production and Characteristics. ASABE, St. Joseph, Ml. 32 pages.
Lorimor, J., W. Powers, and A. Sutton. 2000. Manure characteristics. Manure Management Systems Series MWPS-18. Midwest Plan Service. Ames Iowa: Iowa State University.
Stettler, D., C. Zuller, D. Hickman. 2008. Agricultural Waste Characteristics. Chapter 4 of Part 651, NRCS Agricultural Waste Management Field Handbook. pages 4-1 to 4-32.
Authors
Richard (Rick) Koelsch, Professor of Biological Systems Engineering and Animal Science, University of Nebraska-Lincoln
rkoelsch1@unl.edu
Megan Homolka, student, and Galen Erickson Professor of Animal Science, University of Nebraska-Lincoln
Additional Information
The authors are solely responsible for the content of these proceedings. The technical information does not necessarily reflect the official position of the sponsoring agencies or institutions represented by planning committee members, and inclusion and distribution herein does not constitute an endorsement of views expressed by the same. Printed materials included herein are not refereed publications. Citations should appear as follows. EXAMPLE: Authors. 2019. Title of presentation. Waste to Worth. Minneapolis, MN. April 22-26, 2019. URL of this page. Accessed on: today’s date.
Comparison of Sulfuric vs. Oxalic Sulfuric When Forming Struvite from Liquid Dairy Manure
Purpose
The purpose of this project was to demonstrate a mobile fluidized-bed cone for extraction of phosphorus in the form of struvite (magnesium-ammonium phosphate) from undigested (raw) liquid dairy manure. Since Ca binds inorganic P, a particular emphasis was placed on evaluating the effect of oxalic acid as an acidifier and Ca binder.
Dairies often have excess P in manure in relation to the need for on-farm crop production. Easily mineable reserves of phosphorus (P) worldwide are limited, with a majority residing in Morocco (USGS 2013). One approach to recycling P is to capture excess P from dairy manure in the form of struvite for off-farm export as a nutrient source for crop production.
What we did
A portable trailer-mounted fluidized-bed cone (volume of 3200 L) was used to extract phosphorus in the form of struvite (magnesium-ammonium phosphate) from undigested (raw) liquid dairy manure. Batches of 13,000 liters of manure were evaluated and the system was operated at a flow rate of ~ 32 liters per minute. Sulfuric acid or oxalic acid-sulfuric acid were used to decrease the pH, and sodium hydroxide was used to raise the pH. Oxalic acid was chosen for evaluation due to its dual ability to decrease pH and bind calcium.
What we learned
Results of concentration of total P or ortho-P (OP) after manure treatment through the fluidized bed suggested no advantage of the combination of oxalic acid with sulfuric acid to decrease the concentration of P (see Figures 1 and 2). More detailed analyses of centrifuged post-bed samples of manure effluent indicated that the oxalic acid was binding the free calcium, but the resulting Ca compounds remained suspended in the effluent. Centrifuged manure samples had Ca contents ~23% of un-centrifuged samples when oxalic/sulfuric acid was used as a pH reducer. Centrifuged manure samples had Ca contents ~84% of un-centrifuged samples when sulfuric acid was used as a pH reducer. With raw manure, oxalate does not appear to be beneficial, unless there is a more effective step to drop Ca-oxalate out of suspension, such as centrifuging.


Future Plans
Anaerobically digested (AD) manure will be evaluated with the same set of conditions that were utilized with raw dairy manure to determine potential benefits of using oxalic acid with AD manure.
Authors
Joe Harrison1, Kevin Fullerton1, Elizabeth Whitefield1, and Keith Bowers2.
1Washington State University
2Multiform Harvest
jhharrison@wsu.edu
Citations and video links
U.S. Geological Survey, Mineral Commodity Summaries, January 2013. http://minerals.usgs.gov/minerals/pubs/commodity/phosphate_rock/mcs-2013-phosp.pdf
The Mobile Struvite Project Overview Video: Capturing Phosphorus from Liquid Dairy Manure and Cost Efficient Nutrient Transport
Dairy Struvite Video: Capturing Phosphorus from Dairy Manure in the Form of Struvite on 30 Dairy Farms in WA state
Alfalfa Struvite Video: Struvite, a Recycled Form of Phosphorus from Dairy Manure, used as Fertilizer for Alfalfa Production
Acknowledgements
This project funded by the USDA NRCS CIG program and the Dairy Farmers of Washington.
The authors are solely responsible for the content of these proceedings. The technical information does not necessarily reflect the official position of the sponsoring agencies or institutions represented by planning committee members, and inclusion and distribution herein does not constitute an endorsement of views expressed by the same. Printed materials included herein are not refereed publications. Citations should appear as follows. EXAMPLE: Authors. 2019. Title of presentation. Waste to Worth. Minneapolis, MN. April 22-26, 2019. URL of this page. Accessed on: today’s date.
Comparison of Struvite to Mono-Ammonium-Phosphate as a Phosphorus Source on Commercial Alfalfa Fields
The purpose of this project was to demonstrate a regional nutrient (phosphorus (P)) recycling relationship between the dairy industry and alfalfa forage growers. Dairies often have excess P in manure in relation to the need for crop production on-farm. Easily mineable reserves of phosphorus (P) worldwide are limited, with a majority residing in Morocco (USGS 2013). One approach to recycling P is to capture excess P from dairy manure in the form of struvite for off-farm export for use as a nutrient source of crop production. Washington State produces a significant amount of alfalfa for domestic and international sales.
What did we do
Struvite (Magnesium Ammonium Phosphate – NH4MgPO4· 6H2O) and Mono Ammonium Phosphate (MAP) were applied to 33 and 30 acres (control and treatment, Farm 1); and 60 and 55 acres (control and treatment, Farm 2) sections of alfalfa fields at two commercial forage producers in Eastern Washington. Fertilizer (struvite or MAP) was applied on an equivalent P2O5 basis in August 2017 and September 2018 (Farm 1 – existing stand) and September 2017 and September 2018 (Farm 2 – new seeding).
What have we learned
Accumulative yield of alfalfa in 2018 for Farm 1 was struvite = 7.14 tons, MAP = 7.51 tons. Accumulative yield (2 of 3 cuttings) of alfalfa in 2018 for Farm 2 was struvite = 3.08 tons, MAP = 2.95 tons. Average P concentration of alfalfa in 2018 for Farm 1 was struvite = 0.27, MAP = 0.27 (% DM). Average P concentration in alfalfa in 2017 for Farm 1 was struvite = 0.31, MAP = 0.32 (% DM). Average P concentration of alfalfa in 2018 for Farm 2 for struvite and MAP was 0.27 and 0.28 % DM, respectively. Average accumulative P uptake of alfalfa in 2018 for Farm 1 was 38 and 39 lbs P/acre for struvite and MAP, respectively. Average accumulative P uptake (2 of 3 cuttings) of alfalfa in 2018 for Farm 2 was struvite = 15 lbs, MAP = 16 lbs P/acre. Results indicate that struvite is equivalent to MAP as a P source for commercial production of alfalfa.
Future Plans
The nutrient recycling project will continue through 2019. In addition, companion replicated plots studies are underway to evaluate the effects of ratio of MAP:Struvite and amount of P application for yield and quality of alfalfa.
Authors
Joe Harrison1, Steve Norberg1, Kevin Fullerton1, Elizabeth Whitefield1, Erin Mackey1, and Keith Bowers2.
1Washington State University, jhharrison@wsu.edu
2Multiform Harvest
Citations and video links
U.S. Geological Survey, Mineral Commodity Summaries, January 2013. http://minerals.usgs.gov/minerals/pubs/commodity/phosphate_rock/mcs-2013-phosp.pdf
The Mobile Struvite Project Overview Video: Capturing Phosphorus from Liquid Dairy Manure and Cost Efficient Nutrient Transport
Dairy Struvite Video: Capturing Phosphorus from Dairy Manure in the Form of Struvite on 30 Dairy Farms in WA state
Alfalfa Struvite Video: Struvite, a Recycled Form of Phosphorus from Dairy Manure, used as Fertilizer for Alfalfa Production
Acknowledgements
This project funded by the USDA NRCS CIG program and the Dairy Farmers of Washington.
The authors are solely responsible for the content of these proceedings. The technical information does not necessarily reflect the official position of the sponsoring agencies or institutions represented by planning committee members, and inclusion and distribution herein does not constitute an endorsement of views expressed by the same. Printed materials included herein are not refereed publications. Citations should appear as follows. EXAMPLE: Authors. 2019. Title of presentation. Waste to Worth. Minneapolis, MN. April 22-26, 2019. URL of this page. Accessed on: today’s date.
Phosphorus contribution from distillers grains to corn and wheat in North Dakota
There is growing interest from farmers to know if distillers grains (DGs) could be used as a cheap alternative or supplemental input for cereal production. Condensed distillers solubles (CDS) and wet distillers grains (WDG) are co-products from ethanol production that are mainly used as sources of feed for livestock. They are sometimes available to farmers when in excess of demands as feed, or when for whatever reason, the plant encounters some storage limitations, and have to dispose of the products. Potential environmental problems and cost of freighting huge loads to distant places for disposal has been a concern for ethanol plants. However, the cost of procurement and transportation of DGs, storage, and availability of appropriate equipment to apply these products to farmlands, are some of the bottlenecks for farmers interested in their value as fertilizer sources. Despite these concerns, farmers who farm in close proximity to ethanol plants, or who have the means to transport and apply these products in nearby fields are the ones likely to benefit from the DGs as fertilizer inputs. Preliminary studies indicate that when DGs are applied to soil as sources of nitrogen (N) or phosphorus (P), yields have been similar or better in comparison to synthetic fertilizers. Farmers also appreciate the environmental value in that nutrients removed with the corn following harvest from their fields to the ethanol plants can be recycled back to farmlands. Procurement of DGs by farmers also creates and enhances a synergism between farmers and the ethanol plants, considering the latter could cut down on storage, drying, or disposal costs if farmers are willing to buy or take any excess DGs.
What Did We Do?
Methods are reported for field studies that assess the effects of P from three sources on grain yield and quality of corn in 2017, and wheat in 2017 and 2018. Study sites were located at the NDSU Carrington Research Extension Center, Carrington (ND). The P sources were CDS, WDG, and triple super phosphate (TSP) fertilizer. Rates of P were 0, 40, and 80 lbs P2O5 for wheat in addition to 120 lbs/ac for corn. Wheat treatments in 2017 and 2018 included surface application versus incorporation following application. The weight or volume of WDG or CDS applied varied by year, depending on the nutrient analysis. In 2018, to apply 20 lbs P, 3.3 T/ac of WDG, and 270 gallons/ac of CDS were required. At these rates, 112 lbs N, 17 lbs S, and 27 lbs K2O were applied with WDG. CDS contributed 32 lbs N, 31 lbs K20, and 15 lbs S at the 40 lbs P rate. Urea was applied up to the N rate recommended (79 lbs) to prevent deficiency for the check (0 lbs P) and TSP treatments, and less for the 40 lbs P rate of CDS. Sulfur (as ammonium sulfate) was also added to the check plots and those that received TSP. Treatments were surface applied and incorporated. CDS was mixed with water to facilitate manual application to the small plots, 5 x 25 ft.
What Have We Learned?
In 2017, P did not impact yields for both corn and wheat trials. This was probably due to high soil P level, 16 and 13 ppm P from the corn and wheat respective fields, before planting. P sources did not affect yields. Following harvest, P removed with the grain, on a dry weight basis, was significantly greater with WDG (76.2 lbs/ac) compared to TSP (69 lbs). The difference in grain P removed between WDG and CDS (75.7 lbs/ac) was not statistically significant. Neither yields nor protein differed between P sources.
In 2018, yields improved significantly from P application with DGs and TSP as sources. The P unfertilized plot (0 lbs P) produced 42 bushels, which was significantly less (by 10 bushels) than yields at 40 lbs P. Yields were also significantly less at 40 lbs P (by 5 bushels) compared to 80 lbs P. Yields produced by CDS, WDG, and TSP were similar (54 bushels). Earlier in the season, Normalized Difference Vegetation Index data were collected using a remote sensor to provide an index of crop vigor. There were no differences in vigor between P rates. Meanwhile, the crop vigor of TSP treatment was significantly greater than for both DGs. This was likely due to better availability of P and N, early in the growing season, from urea and TSP. However, these nutrients were later available after mineralization from DGs, in amounts that were adequate to satisfy the crop’s needs similar to respective P rates from TSP. Grain P removal was not different between P sources. When averaged across P rates, P removal in the grain was 33 lbs P2O5. Grain P removal was 23, 30, and 35 lbs/ac at 0, 40, and 80 lbs rates, respectively.

Grain protein was significantly greater with WDG compared to CDS and TSP, probably due to higher N applied with DGs at the 80 lbs rate of P, 223 lbs N at 80 lbs P compared to 79 lbs applied with TSP and CDS on a soil that already had 47 lbs and previous crop was soybeans.
Considering the 2018 results and results previously reported from the 2015 and 2016 trials, CDS and WDG can be valuable sources of P and other nutrients for grain crops in North Dakota. For farmers who can transport DGs short distances, pay little or nothing for it, and apply with their manure applicators, they should feel comfortable applying DGs as a good source of P and N.
Future Plans
Some farmers have been curious about the dried distillers grains as P sources. We will conduct another study in 2019 including the dry product (DDG), even though we understand it is very unlikely that farmers would make any profit with the dry product as a source of nutrients.
Authors
Jasper M Teboh, Research Soil Scientist, NDSU – Carrington Research Extension Center
Jasper.Teboh@ndsu.edu
Szilvia Yuja, Research Soil Specialist, NDSU – Carrington Research Extension Center
Additional Information
Where can people go to learn more about this project or research? List journal articles, websites, publications, articles, social media, or other resources.
Please contact me with questions at Jasper.Teboh@ndsu.edu, or by phone at 701-652-2951 (Ext 109).
Results from this research were first presented at the ASA/SSSA/CSSA 2016 annual conference in Phoenix and is accessible at: https://scisoc.confex.com/crops/2016am/webprogram/Paper100533.html
A summary of findings was later presented on the NDSU – Carrington REC blog at: https://www.ag.ndsu.edu/CarringtonREC/center-points/distillers-grains-impacted-yields-of-corn-and-spring-wheat-when-used-as-a-source-of-p
NDSU Carrington Research and Extension Center Annual report, 2018. https://www.ag.ndsu.edu/carringtonrec/documents/annual-reports/2018-annual-report
Acknowledgements
The authors are grateful to the North Dakota Corn Council, and North Dakota Agricultural Products Utilization Commission for funding the corn and wheat projects, respectively, and also to Tharaldson Ethanol (Casselton, ND) for supplying us with the distillers grains.
The authors are solely responsible for the content of these proceedings. The technical information does not necessarily reflect the official position of the sponsoring agencies or institutions represented by planning committee members, and inclusion and distribution herein does not constitute an endorsement of views expressed by the same. Printed materials included herein are not refereed publications. Citations should appear as follows. EXAMPLE: Authors. 2019. Title of presentation. Waste to Worth. Minneapolis, MN. April 22-26, 2019. URL of this page. Accessed on: today’s date.
Macropore Characterization to Enable the Selection of Practices that Minimize Soluble Phosphorus Loss
Soluble nutrients are believed to be contributing to the recent high-profile impacts in the Great Lakes including excessive cyanobacteria growth (Ohio 2010; Baker et al. 2014). Retaining nutrients, and especially phosphorus in the Great Lakes region, on crop land is also important to the producer as it is non-renewable, scarce, expensive, exhibits high price variability, and can cause adverse environmental impacts when discharged into fresh water systems.
This research program was designed to quantitatively investigate preferential flow pathways caused by macropores by conducting field analyses using the mobile macropore characterization unit. Such pathways enable soluble nutrients, such as phosphorous, to rapidly migrate through soil, into tile drains, and then to surface water (Geohring et al. 2001; Heathwaite and Dils 2000). Results, along with site characteristics such as farm-management practices, topography, soil texture, depth to water table, depth and spacing of subsurface drains, if applicable, topography, and proximity to surface water, enable the qualitative selection of the best management practice to retain nutrients. This approach recognizes that all farm fields are unique and best practices to maximize nutrient uptake and minimize its transport off site are not equally applicable
What did we do?
Forrer et al., 2000, developed a visual technique to assess liquid flow through microporous soil. The technique entails adding dye to small plots of saturated soil and excavating trenches in each area. This method was expanded by photographing the soil profiles, processing the image to convert pixels with dye to white and soil without dye to black, and quantifying each with depth using MATLAB (Figure 1). The result is an estimate of the amount and extent of the macropores.
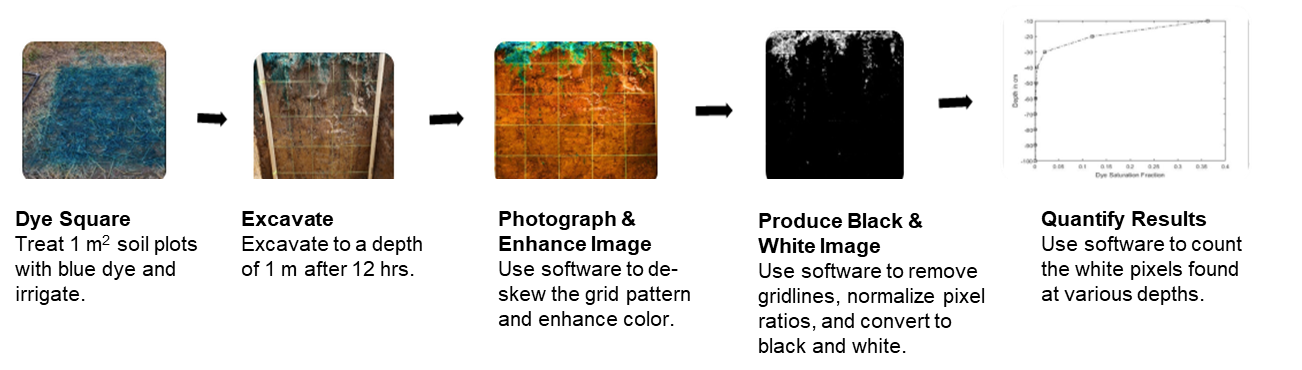
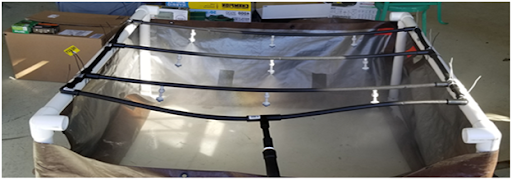
This technique was packaged into the mobile macropore characterization unit to allow for efficient measurements (Figures 2 and 3).

What we have learned?
Five sites across Michigan with varied management practices and soil structure were tested using the newly developed protocol as shown in Figure 4.

What are the next steps?
The mobile micropore characterization unit will be used extensively at an ongoing edge-of-field monitoring research site in Michigan to develop correlations between soluble pollutants in the tile drain water and quantitative macropore characterization. Thereafter, the unit will be used by extension educators for field-specific measurements to help producers decide on the most appropriate best management practices.
Authors
Steven I. Safferman1, Jason S. Smith2, Thiramet Sothiyapai3, Ehsan Ghane4
1 Associate Professor; Michigan State University, Biosystems and Agricultural Engineering; Corresponding Author: SteveS@msu.edu
2 Teaching Specialist, Michigan State University, Engineering CoRe
3 Undergraduate Research Assistant, Michigan State University, Biosystems and Agricultural Engineering
4 Assistant Professor and Extension Specialist, Michigan State University, Biosystems and Agricultural Engineering
Additional Information
Baker, D. B., R. Confesor, D. E. Ewing, L. T. Johnson, J. W. Kramer, and B. J. Merryfield. 2014. “Phosphorus Loading to Lake Erie from the Maumee, Sandusky and Cuyahoga Rivers: The Importance of Bioavailability.” Journal of Great Lakes Research 40 (3): 502–17. https://doi.org/10.1016/j.jglr.2014.05.001.
Forrer, I., A. Papritz, R. Kasteel, H. Flühler, and D. Luca. 2000. “Quantifying Dye Tracers in Soil Profiles by Image Processing.” European Journal of Soil Science 51 (2): 313–22. https://doi.org/10.1046/j.1365-2389.2000.00315.x.
Geohring, Larry D, Oloro V Mchugh, M Todd Walter, Tammo S Steenhuis, M Saleem Akhtar, and Michael F Walter. 2001. “Phosphorus Transport Into Subsurface Drains By Macropores After Manure Applications :” Soil Science 166 (12): 896–909.
Heathwaite, A. L., and R. M. Dils. 2000. “Characterising Phosphorus Loss in Surface and Subsurface Hydrological Pathways.” Science of the Total Environment 251–252: 523–38. https://doi.org/10.1016/S0048-9697(00)00393-4.
Ohio, E P A. 2010. “Ohio Lake Erie Phosphorus Task Force Final Report.” Ohio EPA OH Task Force.
Acknowledgements
This project was funded by the Michigan Soybean Promotion Committee, Corn Marketing Program of Michigan, and Michigan Wheat Program. The author wish to acknowledge contributions from Brendon Kelly, Lyndon Kelly, Steve Miller, and the MSU Soil and Plant Nutrient Laboratory.
The authors are solely responsible for the content of these proceedings. The technical information does not necessarily reflect the official position of the sponsoring agencies or institutions represented by planning committee members, and inclusion and distribution herein does not constitute an endorsement of views expressed by the same. Printed materials included herein are not refereed publications. Citations should appear as follows. EXAMPLE: Authors. 2019. Title of presentation. Waste to Worth. Minneapolis, MN. April 22-26, 2019. URL of this page. Accessed on: today’s date.
Phosphorus Release from Sewage Sludge Incinerator Ash in a Corn and Soybean Field Study
In the Twin Cities, sewage sludge is incinerated and in the process 5 MW of power is generated per day. Incineration produces significant amounts of ash (38 tons/day) which contains nearly 30% total phosphate (P2O5). Currently, sewage sludge incinerator ash (SSA) is landfilled at a cost to taxpayers, but previous studies have shown that the ash has the potential to be a source of phosphorus (P) for crop production. Additionally, P is a limited and difficult-to-renew resource.
What did we do?
To determine the viability of SSA as a P fertilizer, we are in the middle of conducting a 3-year corn and soybean field study comparing this ash to other P sources including conventional P fertilizer (triple super phosphate), dried pelletized biosolids, and struvite. Each P source was applied in the spring at 40, 80, 120, and 160 lb P2O5/ha, with a zero-P control included. Soil and plant samples were taken throughout the season and after harvest and then were analyzed for available P and EPA 503 metals (elements monitored by the EPA in biosolids land application). In-situ probes that act as a proxy for ions in soil solution were also analyzed.

What we have learned?
After two years of field studies, there is evidence to show that SSA can be a viable phosphorus fertilizer as well as a source of copper (Cu) and zinc (Zn), although additional years of study on a more P-responsive soil are required to draw definitive conclusions. While soils amended with biosolids or SSA have higher levels of DTPA-Cu and DTPA-Zn compared with TSP- or struvite-amended soils, only grain concentrations of zinc reflected this difference in source.
While Cu and Zn are both elevated in biosolids and SSA soils, in-situ probes show that these elements are significantly more available in the biosolids-amended soils. This may be due to the difference in matrices and requires more study. However, our results demonstrate that land-application of ash and biosolids for crop production are two potential options for resolving sewage solids disposal and beneficial reuse of nutrients that go through our food systems. While land-applying biosolids is a good source of carbon and nitrogen where SSA is not, SSA has the benefit of having minimal organic contaminants (pathogens, pharmaceuticals) due to the incineration process. Additionally, biosolids are applied to meet a crop’s nitrogen requirements whereas SSA is applied to meet a crop’s phosphorus requirements. Because of this, the total amount of SSA-amendment added is significantly less than biosolids and thus results in lower or equal amounts of EPA 503 metals.
Future plans:
We will continue our study through a third field season (2019) and will continue to monitor P and 503 metals concentrations in soils and uptake by plants. We are also analyzing soil samples for changes in microbial populations due to SSA application. However, an early proof-of-concept incubation showed no significant effects of SSA when applied at agronomic P-rates.
Authors:
Persephone Ma1, phma@umn.edu
Carl Rosen1
1Department of Soil, Water, and Climate, University of Minnesota, Twin Cities
Additional information:
Bierman P, Rosen C. 1994a. Phosphate and trace-metal availability from SSA. JEQ. 23(4):822-830. Bierman P, Rosen C. 1994b. SSA effects on soil chem-prop and growth of lettuce and corn. Comm in SS and Plant Analysis. 25(13-14):2409-2437. Crants, J., C. Rosen, C. Blake, and M. McNearney. “Is SSAa Safe and Effective Phosphate Fertilizer?” U of Minn, 2015. Abs. Syn in Sci: Partn .for Sol. ASA, CSSA, SSSA, 16 Nov. 2015. Jasinski, S. “Phosphate Rock Statistics and Information.”Phosphate Rock Stat. and Info., USGS, 2017. Walker, J., et al. A Plain English Guide to the EPA Part 503 Biosolids Rule , USEPA, Off. of Ww. Mgmt, 1994.
Acknowledgements:
Metropolitan Council, Rosen Lab field crew, Rosemount Research and Outreach Center field crew, Department of Soil, Water, and Climate field crew
The authors are solely responsible for the content of these proceedings. The technical information does not necessarily reflect the official position of the sponsoring agencies or institutions represented by planning committee members, and inclusion and distribution herein does not constitute an endorsement of views expressed by the same. Printed materials included herein are not refereed publications. Citations should appear as follows. EXAMPLE: Authors. 2019. Title of presentation. Waste to Worth. Minneapolis, MN. April 22-26, 2019. URL of this page. Accessed on: today’s date.
Nitrogen and Phosphorus Cycling Efficiency in US Food Supply Chains – A National Mass-Balance Approach
Proceedings Home | W2W Home 
Purpose
Assessing and improving the sustainability of livestock production systems is essential to secure future food production. Crop-livestock production systems continue to impact nitrogen (N) and phosphorus (P) cycles with repercussions for human health (e.g. secondary particle formation due to ammonia emission and drinking water contamination by nitrate) and the environment (e.g. eutrophication of lakes and coastal waters and exacerbation of hypoxic zones). Additionally, P is a limited resource, and sustaining an adequate P supply is a major emerging challenge. To develop strategies for a more sustainable use of N and P, it is essential to have a quantitative understanding of the flows and stocks of N and P within the society. In this study, we developed detailed national N and P budgets to assess nutrient cycling efficiency in US (livestock) food supply chains, to identify hotspots of nutrient loss and to indicate opportunities for improvement!
What did we do?
1. National nutrient mass-balance
A mass-balance framework was developed to quantify nutrient flows within the US. In this framework, the national US system is represented by 9 major sectors are relevant in terms of nutrient flows: mining (relevant for P only), industrial production, agriculture, food & feed processing industry, retail, households and other consumers, energy and transport, humans, and waste treatment. These sectors can exist of several sub-sectors. For example, the agricultural sector consists of several secondary sub-systems including pasture, agricultural soil, livestock and manure management (WMS – waste management system).
Different livestock categories can have distinct environmental impacts and nutrient use efficiencies (e.g. (Hou et al. 2016), (Eshel et al. 2014), (Herrero et al. 2013)), we therefore distinguish six livestock categories (dairy cattle, beef cattle, poultry (meat), poultry (layers), sheep, hogs) and
their associated food commodities (dairy products, beef from dairy cattle, beef, poultry, eggs, lamb, pork).
For each sub-system, we identify and quantify major flows to and from this compartment. All flows are expressed in a common unit, i.e. metric kiloton N per year (kt N/yr) for nitrogen and metric kiloton P per year (kt P/yr) for phosphorus. Quantified flows include nutrient related emissions to the environment and waste flows.
At present, the waste sectors and environmental compartment are outside the system boundaries, that is, we quantify flows to these compartments, but we do not attempt to balance these sectors. We do, however, keep track of the exact chemical species (e.g. emission of N2O-N to air instead of N to air) emitted as far as possible. The municipal waste treatment (MSW) and municipal waste water treatment (WWTP) are treated in more detail: major flows from and to these compartments are quantified. These sub-sectors are treated in more detail because of their role in nutrient recycling through e.g. sewage sludge application on agricultural soils.
Data were collected in priority from national statistics (e.g. USDA NASS for livestock population) and peer-reviewed literature, and were supplemented with information from industrial reports and extension files if needed. If available, data were collected for the years 2009 to 2012 and averaged, when unavailable, we collected data for the closest year.
2. Scenario analysis
In the scenario analysis, we test the opportunity for dairy livestock production systems to contribute to a more efficient nutrient use through anaerobic co-digestion of dairy manure and organic food waste. Recently, Informa Economics assessed the national
market potential of anaerobic digester products for the dairy industry (Informa Economics 2013). Next to a reduction in greenhouse gas emissions, anaerobic co-digestion of dairy manure and organic food waste can contribute to improve nutrient cycling efficiency (Informa Economics 2013). Dairy manure contains high levels of nitrogen and phosphorus, which can be used as a natural crop fertilizer, if recuperated from manure. Presently, non-farm organic substrates such as food waste are typically disposed of in landfills, which causes greenhouse gas (GHG) emissions and also results in a permanent removal of valuable nutrients from the food supply chain (Informa Economics 2013). By anaerobic co-digestion, a part of the nutrien! ts contai ned in dairy manure and food waste can be recovered. These nutrients can be used to fertilize crops and substitute synthetic fertilizer application. In the scenario analysis, we test to what extent anaerobic co-digestion of dairy manure and food waste can contribute to improve nutrient cycling efficiency, particularly by substituting synthetic fertilizers. We develop the scenario based on data provided in the InformaEconomics report.
What have we learned?
In general, our results show that livestock production is the least efficient part of the total food supply chain with large losses associated with manure management and manure and fertilizer application to crops. In absolute terms, the contribution of the household stage to total and N and P losses from the system is small, approximately 5 and 7% for N and P, respectively. However, households ‘waste’ a relatively large percentage of purchased products, (e.g. 16% and 18% of N and P in dairy products end up as food waste), which presents an opportunity for improvement. A scenario was developed to test to what extent anaerobic co-digestion of dairy manure and food waste can contribute to improving nutrient cycling efficiency on a national scale. Results suggest that 22% and 63% of N and P applied as synthetic fertilizer could potentially be avoided in dairy food supply chains by large scale implementation of anaerobic co-digestion o! f manure and food waste.
Future Plans
Future research plans include a further development of scenarios that are known to reduce nutrient losses at the farm scale and to assess the impact of these scenarios on national nutrient flows and losses.
Corresponding author, title, and affiliation
Karin Veltman, PhD, University of Michigan, Ann Arbor
Corresponding author email
Other authors
Carolyn Mattick, Phd, Olivier Jolliet, Prof., Andrew Henderson, PhD.
Additional information
Additional information can be obtained from the corresponding author: Karin Veltman, veltmank@umich.edu
Acknowledgements
The authors wish to thank Ying Wang for her scientific support, particularly for her contribution in developing the anaerobic co-digestion scenario.
This work was financially supported by the US Dairy Research Institute.
The authors are solely responsible for the content of these proceedings. The technical information does not necessarily reflect the official position of the sponsoring agencies or institutions represented by planning committee members, and inclusion and distribution herein does not constitute an endorsement of views expressed by the same. Printed materials included herein are not refereed publications. Citations should appear as follows. EXAMPLE: Authors. 2017. Title of presentation. Waste to Worth: Spreading Science and Solutions. Cary, NC. April 18-21, 2017. URL of this page. Accessed on: today’s date.
Cultivation of Duckweed on Anaerobically Digested Dairy Manure for Nitrogen and Phosphorus Removal
Proceedings Home | W2W Home 
Purpose
The purpose of this research included identifying the optimum cultivation conditions of five different strains of duckweed while evaluating the nutrient uptake of nitrogen (N) and phosphorus (P) in anaerobically digested dairy manure to promote biomass production.
What did we do?
The growth of duckweed was assessed on the cultivation parameters of temperature, pH, dissolved oxygen, light intensity, nutrient concentrations, and biomass production. Three strains, namely Landoltia punctata, Lemna gibba and Lemna minuta, were identified as the promising candidates for their high levels of nutrient uptake and biomass production. The temperature and light intensity were maintained in an environmental chamber at 25°C and 10,000 lux, respectively. The nutrient uptake through duckweed cultivation, characterized by the changes of total nitrogen (TN), total Kjeldahl nitrogen (TKN), and total phosphorus (TP), was assessed on the anaerobically digested dairy manure in three dilution ratios i.e., 1:13, 1:18, and 1:27 by volume.
What have we learned?
In the dilution ratios 1:18 and 1:27 all duckweed strains grew successfully. However, in dilution ratio 1:13 all three duckweed species were inhibited by the high nutrient concentration. The batch system created an aerobic environment within the anaerobically digested dairy manure medium with a dissolved oxygen content of 2-6 mg/L. At the high light intensity of 10,000 (lux) a buffer was needed in order to keep the medium’s pH constant to promote duckweed growth. This research compared the nutrient reduction of the microbial growth within the anaerobically digested dairy manure and a standard solution of 1.6 g/L of Hoagland E-medium to the nutrient reduction from the three strains of duckweed at the dilution ratios of 1:13, 1:18, and 1:27. Experimental results revealed that the average duckweed productivities were 1.50, 1.30 and 0.50 grams per square foot per day for Landoltia punctata, Lemna gibba, and Lemna minuta, respectively. At the dilution ratio of 1:27 the highest significant reductions came from Landoltia punctata at 86.0% for TN, 87.5% for TKN, and a TP of 89.5%. At the dilution ratio of 1:18 Lemna gibba got the next highest at 83.8% for TN, 85.6% for TKN, and a TP of 76.2%. Lemna minuta came in last with the highest nutrient reductions in dilution ratio 1:18 with 83.1% for TN, 84.7% for TKN, and a TP of 76.5%. A light intensity of 10,000 lux, pH of 6.5, a temperature of 25°C and a dilution ratio of 1:27 promoted active duckweed growth on anaerobically digested dairy manure.
Future Plans
We will continue the duckweed cultivation work to optimize manure nutrient uptake and to convert duckweed biomass into bioethanol.
Corresponding author, title, and affiliation
Lide Chen, Assistant Professor/Waste Management Engineer, University of Idaho
Corresponding author email
Other authors
Kevin Kruger (University of Idaho)
Additional information
Kevin Kruger is a graduate student who conducted the duckweed cultivation tests.
Acknowledgements
This work is supported by the USDA NIFA and Idaho Agricultural Experiment Station.