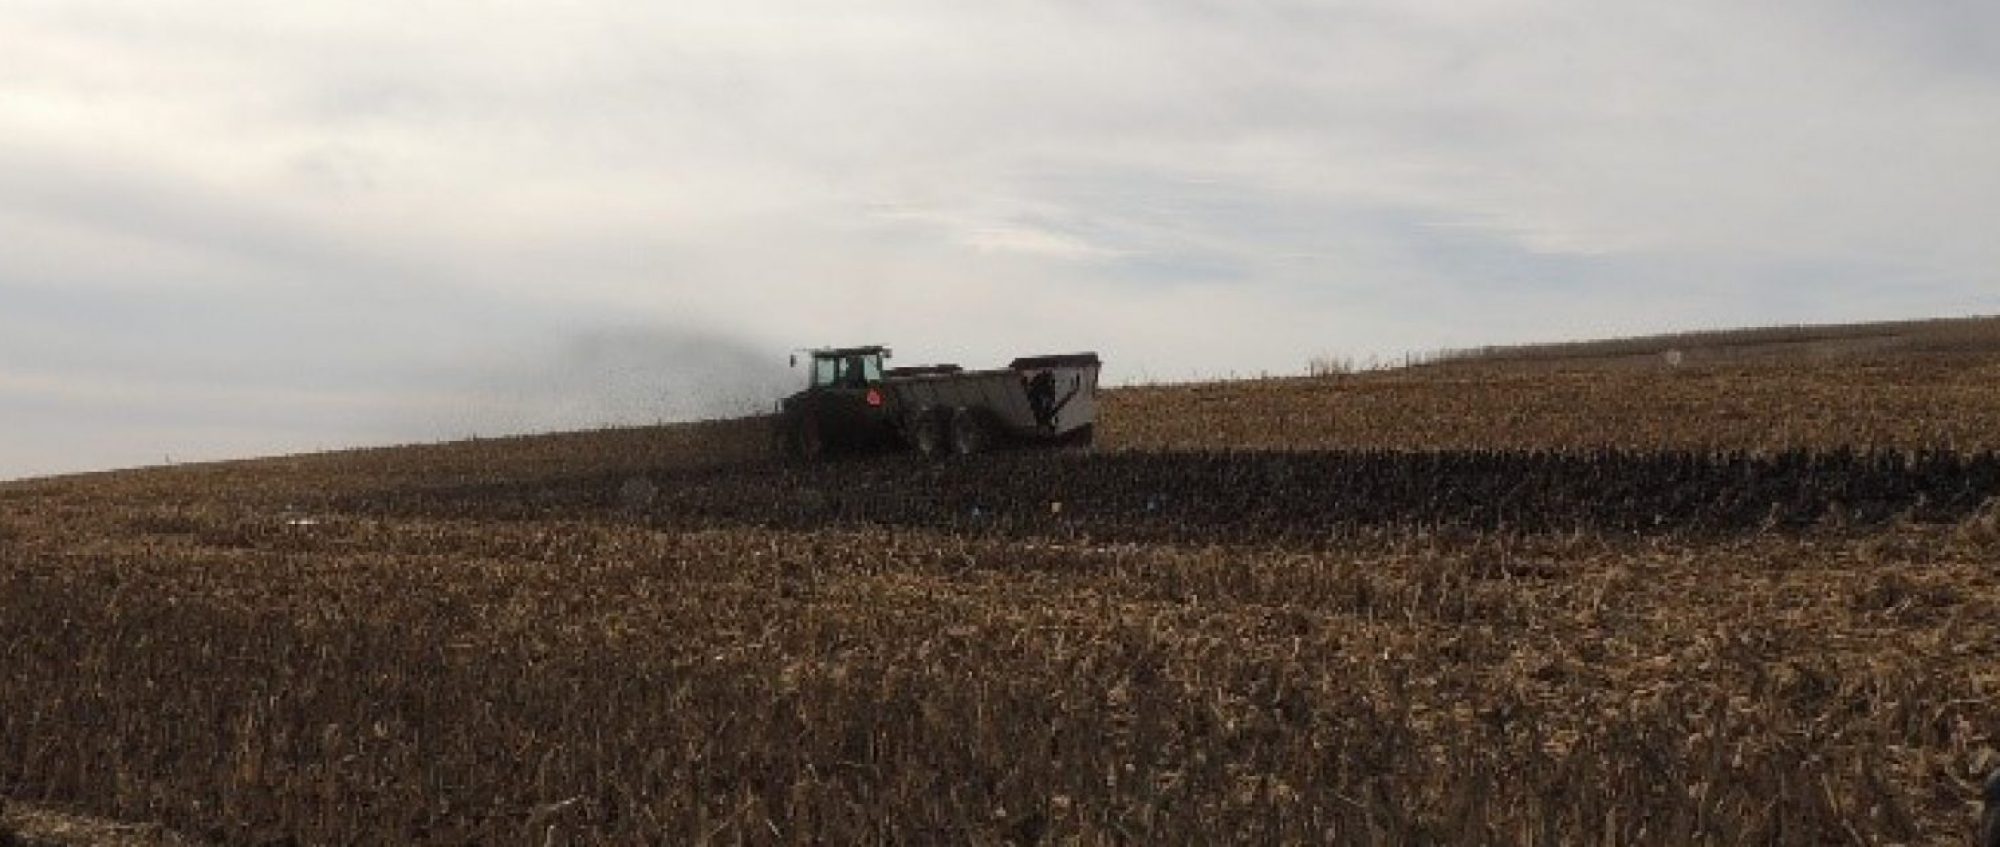
To be sustainable, producers need to conserve energy while still maintaining or improving their facilities and the lives of the animals they house. This presentation was originally broadcast on December 15, 2023. Continue reading “Energy Conservation in Livestock and Poultry Operations”
Quantification of greenhouse gas emissions from US dairy farms
Purpose
Dairy farming is known to emit greenhouse gases (GHG), both from direct and indirect emission sources. Carbon dioxide (CO2) is emitted from the combustion of deep sequestered fossil fuel while non/temporarily sequestered, biologically mediated, methane (CH4) and nitrous oxide (N2O) are emitted by various sources, most notably by cattle, feed production, and manure management.
Dairy farmers and their key advisors, the balance of the dairy value chain, policy makers, government officials, non-governmental organizations (NGOs), and astute consumers value best available information about the greenhouse gas (GHG) emissions associated with milk production. In 2020, the Innovation Center for US Dairy (IC) set three 2050 environmental stewardship goals spanning from cradle to processor gate (i.e., milk production and milk processing), including GHG neutrality. Further, the IC committed to outwardly reporting on progress towards the goals every five years starting in 2025.
What Did We Do?
Work focused on the cradle to farm gate (milk production) segment of the overall GHG neutrality goal. A list of considerations deemed important to conduct a robust US dairy GHG analysis was developed and evaluated. The most important key considerations determined were geographic-driven factors and assessment focused approach (i.e., sampling farm population, not sampling). Boundaries for the four areas making up a cradle to farm gate categories for analysis – Cattle (Enteric), Feed, Manure, and Energy – were developed based in part on understanding of where available data is housed and managed by farmers and their custom operators and following Life Cycle Assessment (LCA) practices.
What Have We Learned?
The most important lesson learned was that sampling a farm population and scaling results to represent the US dairy industry GHG emission footprint cannot be used for multiple reasons. First, classical statistics requires a sample needs to be normally distributed about the mean – herd size is not normally distributed among farm size, 80 % cows owned by 20% of the farms and milk production is higher, between 3,000 and 5,000 lbs./cow annually, for larger herds. Second, the data needed from every farm doesn’t exist today. Third, random sampling of MILK and COWS is required, however, farmers are surveyed. Fourth, accurate emission results require a percentage of cows surveyed and the percentage of milk surveyed to be the same; however, the estimated probably is less than 0.0001 that this would occur (once in every 10,000 years if annual surveys were conducted). Lastly, analysis showed that unavoidable and unpredictable error resulted when scaling up sample analysis results to the US dairy population, meaning that a reported carbon dioxide equivalent (CO2e) value would have tremendous uncertainty in direction and magnitude. This is especially challenging when measuring progress toward the 2050 GHG neutrality goal; a population sampling and scaling based approached can result in higher calculated emissions in five years over a current value, even though many farms made notable changes to reduce GHG emissions.
Leaders of the US dairy industry were educated on the challenges of farm sampling and scaling. As a result, the decision was made to approach quantification of the progress toward the 2050 GHG neutrality goal using an approach that removes the need for scaling. That approach is called USDA Cow and Milk Data Focused approach.
Future Plans
Measurement of US dairy’s progress towards its 2050 GHG neutrality goal will be made using the USDA Cow and Milk Data Focused approach; first report on progress due in 2025.
Authors
Curt A. Gooch, Sustainable Dairy Product Owner, Land O’Lakes – Truterra
Corresponding author email address
Additional author
Roger Cady, Freelance Sustainability Consultant (Retired from industry)
Acknowledgements
Dairy Management Incorporated and the Innovation Center for US Dairy Environmental Stewardship Committee
The authors are solely responsible for the content of these proceedings. The technical information does not necessarily reflect the official position of the sponsoring agencies or institutions represented by planning committee members, and inclusion and distribution herein does not constitute an endorsement of views expressed by the same. Printed materials included herein are not refereed publications. Citations should appear as follows. EXAMPLE: Authors. 2022. Title of presentation. Waste to Worth. Oregon, OH. April 18-22, 2022. URL of this page. Accessed on: today’s date.
Active participation in livestock and poultry sustainability initiatives
Purpose
Whether at the farm, integrator or industry level, sustainability programs have unique goals, metrics and approaches. In many cases, there is no definitive path for meeting long-term goals, but in the ambiguity is opportunity. Meeting sustainability goals will take a community of persons on and off farm willing to support measurements, communication and technology development. This session builds on the Livestock and Poultry Environmental Learning Community’s (LPELC) September 2021 Webinar, Industry Initiatives for Environmental Sustainability – a Role for Everyone.
This Waste to Worth workshop features small and large group discussions to identify modes for active participation in livestock and poultry sustainability initiatives.
What Did We Do?
Industry-led sustainability programs are in various stages of charting a destination for environmental metrics, like greenhouse gas emissions, water quality, water use, etc. However, with respect for the range of individual farm resources, climates and systems, there is no prescriptive path.
As farmers and organizations chart their own sustainability journey, there is a need for on-farm baseline metrics, goal setting, and technology guidance. LPELC’s mission is to provide on-demand access to “the nation’s best science-based resources that is responsive to priority and emerging environmental issues associated with animal agriculture” (LPELC.org). The LPELC is in a strong position to share science and support communication efforts. However, like sustainability journeys, LPELC needs a roadmap.
This workshop will illuminate what resources are currently available, knowledge, technology and communication gaps, and how LPELC members can support on-farm sustainability initiatives. Participants will collectively shape a logic model for a “Community of Support for Producer Engagement in Livestock Industry Environmental Sustainability Initiatives”.
What Have We Learned?
A summary of the workshop results will be shared following the conference.
Future Plans
We intend the workshop results to foster stronger networks and collaborative directions for advancing on-farm sustainability initiatives. We aim for short, medium and long-term outcomes that include stronger understanding of current efforts within the livestock industries and LPELC, along with support mechanisms for decision making and funding opportunities.
Authors
Erin Cortus, Associate Professor and Extension Engineer, University of Minnesota
Corresponding author email address
ecortus@umn.edu
Additional authors
Marguerite Tan, Director of Environmental Programs, National Pork Board; Hema Prado, Director of Sustainability, American Egg Board; Michelle Rossman, Vice President – Environmental Stewardship, Dairy Management Inc.
Additional Information
Webinar – Industry Initiatives for Environmental Sustainability – a Role for Everyone https://lpelc.org/industry-initiatives-for-environmental-sustainability-a-role-for-everyone/#more-33017
US Pork Industry Sustainability Goals https://www.porkcares.org/pork-industry-sustainability-goals-and-metrics/
US Roundtable for Sustainable Poultry https://www.us-rspe.org/
US Dairy Net Zero Initiative https://www.usdairy.com/getmedia/89d4ec9b-0944-4c1d-90d2-15e85ec75622/game-changer-net-zero-initiative.pdf?ext=.pdf
The authors are solely responsible for the content of these proceedings. The technical information does not necessarily reflect the official position of the sponsoring agencies or institutions represented by planning committee members, and inclusion and distribution herein does not constitute an endorsement of views expressed by the same. Printed materials included herein are not refereed publications. Citations should appear as follows. EXAMPLE: Authors. 2022. Title of presentation. Waste to Worth. Oregon, OH. April 18-22, 2022. URL of this page. Accessed on: today’s date.
Quantification of greenhouse gas emission reductions for eight dairy manure management systems employed in the Northeast and upper Midwest
Purpose
Dairy farmers and their key advisors, the balance of the dairy value chain, policy makers, government officials, non-governmental organizations (NGOs), and astute consumers value best available information about the greenhouse gas (GHG) emissions associated with milk production. In 2020, the Innovation Center for US Dairy set three 2050 environmental stewardship goals spanning from cradle to processor gate, including GHG neutrality. Further, they committed to reporting on progress towards the goals every five years starting in 2025.
Dairy farming economics will continue to drive production consolidation, a trend that substantially began in the 1960s. Consolidation results in fewer total farms yet only somewhat fewer total cows overall; thus, the number of cows per farm has substantially increased. The best management practice of long-term manure storage (LTS) was developed by USDA NRCS decades ago to protect water quality due to manure runoff and infiltration. The number of farms with LTS increased as the number of cows per farm increases. Overall, LTSs are largely anaerobic, resulting in the emission of methane (CH4) and in some cases nitrous oxide (N2O). It is generally understood that the 2nd largest cradle to farm gate CH4 emission source is LTS. Continued industry consolidation will result in more LTS over time.
Continued use of (LTS) to protect water quality, coupled with today’s use of manure treatment practices on-farm and the US dairy and other GHG reduction goals set are important reasons to quantify manure-based GHG emissions.
What Did We Do
To help dairy farmers and others understand the relative impact manure management (MM) has on GHG emissions, seven integrated MM systems that are utilized by farmers in the Northeast/upper Midwest were analyzed. The approach was to calculate the GHG emission impacts using best available information and procedures. The seven systems analyzed, each shown in process flow order, were:
1. Long-term storage (LTS)
2. Solid-liquid separation (SLS), LTS
3. SLS, LTS with cover/flare (CF)
4. Anaerobic digestion (AD) of manure only, SLS, LTS
5. AD, SLS, LTS with CF
6. AD of manure/food waste, SLS, LTS with CF
7. AD of manure/food waste, SLS, LTS with cover/gas utilization
The resulting net GHG emission values were compared to the baseline MM practice of daily spreading.
Impact of systems on GHG emissions associated with LTS and offsets from net energy production and landfill organics diversion (anaerobic digestion systems only) were included. Results were normalized on a metric ton of carbon dioxide equivalent (CO2e) per cow-year basis. A 100-year global warming potential (GWP100) value of 25 and a 20-year GWP20 (84) were used for comparative purposes in calculating CO2e. A sensitivity analysis was conducted to understand the impact of volatile solid (VS) biodegradability on GHG emissions and anaerobic digester system biogas leakage.
What Have We Learned
Not surprisingly, results show that the largest GHG reduction opportunity was from anaerobic co-digestion of dairy manure with community substrate (7. above). The net GHG emission from this system was -16 (GWP100) and -43 (GWP20) metric tons CO2e per cow-year (GHG avoidance). This is compared to the GHG emission of 1.9 (GWP100) and 5.6 (GWP20) metric tons CO2e per cow-year from the LTS (1. above). Sensitivity analysis results showed manure VS degradability had meaningful impact on GHG emissions, particularly for Scenario 4, and for the co-digestion scenarios, the most significant impact – 5% – resulted in a leakage increased from 1% to 3%. While using SLS with an impermeable cover and flare system on a separated liquid manure LTS reduces CH4 emissions as compared to uncovered long-term liquid manure storage, the practice does not provide an opportunity to achieve net zero or better manure enterprise GHG footprint because the energy in the biomass is wasted and diversion of organics from landfills cannot be effectively included.
Future Plans
Next step is to develop additional results for integrated MM systems that included advanced manure treatment technologies that further reduce the organic loading on LTSs. Further parallel work will focus on quantifying these same advanced manure treatment technologies on their partitioning of digester effluent nutrients for off-farm export.
Authors
Curt A. Gooch, Sustainable Dairy Product Owner, Land O’Lakes – Truterra
cgooch@landolakes.com
Additional Authors
-Peter E. Wright, Extension Associate, Cornell PRO-DAIRY Dairy Environmental Systems Program
-Lauren Ray, Extension Support Specialist III, Cornell PRO-DAIRY Dairy Environmental Systems Program
Additional Information
More information on related work can be found on the Cornell University PRO-DAIRY Dairy Environmental Systems Program website: https://cals.cornell.edu/pro-dairy/our-expertise/environmental-systems.
Acknowledgements
The Coalition for Renewable Natural Gas and the New York State Department of Agriculture and Markets provided financial resources to support this work.
The authors are solely responsible for the content of these proceedings. The technical information does not necessarily reflect the official position of the sponsoring agencies or institutions represented by planning committee members, and inclusion and distribution herein does not constitute an endorsement of views expressed by the same. Printed materials included herein are not refereed publications. Citations should appear as follows. EXAMPLE: Authors. 2022. Title of presentation. Waste to Worth. Oregon, OH. April 18-22, 2022. URL of this page. Accessed on: today’s date.
Incentives for Sustainable Practices
This webinar focuses on on adoption of place-based conservation practices to improve water quality. This presentation was originally broadcast on October 22, 2021. Continue reading “Incentives for Sustainable Practices”
Industry Initiatives for Environmental Sustainability – a Role for Everyone
This webinar introduces current and future industry-based initiatives for environmental sustainability in the livestock and poultry sector, and how Livestock and Poultry Environmental Learning Community learners can play a critical role in their region. This presentation was originally broadcast on September 17, 2021. Continue reading “Industry Initiatives for Environmental Sustainability – a Role for Everyone”
Translating Beef Production Research to Marketing Outcomes
The audience will learn about different beef production systems and their performance outcomes. Participants will have the opportunity to expound upon the information shared, inquire with panelists, and actively participate in beef marketing improvements.
Interactive Panel
Moderators
Dr. Megan Webb, Assistant Professor and Beef Production Systems Extension Specialist, University of Minnesota
Ms. Karin Schaefer, Executive Director, Minnesota Beef Council
Panelists
Ms. June Dunn, Field Specialist, Greater Omaha Packing Company
Dr. Alan Rotz, Agricultural Engineer, USDA-ARS Pasture Systems and Watershed Management
Dr. Garrett Steede, Teaching Assistant Professor, Ag. Education, Communication and Marketing, University of Minnesota
Mr. Jerry Wulf, Partner at Wulf Cattle Company
Corresponding Author
Megan Webb, University of Minnesota, mwebb@umn.edu
The authors are solely responsible for the content of these proceedings. The technical information does not necessarily reflect the official position of the sponsoring agencies or institutions represented by planning committee members, and inclusion and distribution herein does not constitute an endorsement of views expressed by the same. Printed materials included herein are not refereed publications. Citations should appear as follows. EXAMPLE: Authors. 2019. Title of presentation. Waste to Worth. Minneapolis, MN. April 22-26, 2019. URL of this page. Accessed on: today’s date.
Energy Consumption in Commercial Midwest Dairy Barns
Consumer interest and concern is growing in regards to sustainability of livestock production systems. Demand for reduced carbon emissions within agricultural systems has been growing along with increasing demand for food. Baseline fossil fuel consumption within agricultural systems, including dairy production, is scarce. Therefore, there is a need to discern where and how fossil energy is being used within dairy production systems. Determining baseline energy use is the first step in investigating the demand for a reduced carbon footprint within dairy production systems. The objective of this study was to measure total electricity use and determine specific areas of high energy consumption in commercial dairy barns located in the Upper Midwest of the United States.
What did we do?
Four commercial dairy barns representative of typical Midwest dairy farms and located in west central Minnesota were evaluated in the study. The dairy farms were: 1) a 9,500 cow cross-ventilated barn with a rotary milking parlor (Farm A), 2) a 300 cow naturally-ventilated barn with stirring fans for air movement and 6 automatic milking systems (Farm B), 3) a 200 cow naturally-ventilated barn with stirring fans for air movement and a parabone milking parlor (Farm C), and 4) a 400 cow naturally-ventilated barn with stirring fans for air movement and a parallel milking parlor (Farm D).
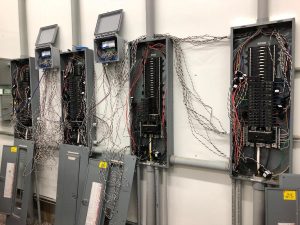
Electricity use was monitored from July 2018 to December 2018 with a goal of collecting two years of total energy usage. Two-hundred ninety-two electric loads across the four farms were monitored on the farm side of the electric utility meter to evaluate areas of highest energy usage (Figure 1). Some of the monitored electric loads included freestall barn fans, water heaters, compressors, chillers, manure pumps, and pressure washers. The electric loads were monitored by data loggers (eGauge, Boulder, CO) and electric current sensors at the circuit panels. Electrical use data (kWh) of each load were collected and analyzed on a monthly basis. In addition, monthly inventory of cows on farm, cows milked per day, and milk production was recorded. Bulk tank production records (milk, fat percentage, protein percentage, and somatic cell count) were also recorded.
What have we learned?
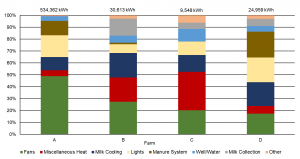
Based on preliminary results, fans were the largest electrical load across all four dairy farms. Fan usage during the summer ranged from 36 to 59% of the total electricity measured (Figure 2). Regular maintenance, proper control settings, design, sizing, location, selecting energy efficient fans and motors, and other factors all could influence the efficiency of these ventilation/cooling systems. Farms B, C, and D had greater electricity usage across all months for milk cooling (compressors and chillers) than Farm A. This is likely due to the fact that Farm A does not utilize bulk tanks to store milk, but instead, milk is directly loaded onto bulk milk trucks. Lighting use ranged from 7 to 21% of the total electricity use measured across the four farms, which suggests there is potential to reduce energy usage by upgrading to more efficient lighting systems such as LEDs. For heating, energy usage includes water heating, heating units in the milking parlor or work rooms, waterer heating elements, and generator engine block heaters. Average monthly heating use ranged from 5% of electricity used in Farm A to 32% of electricity used in Farm C.
Future plans
Based on the preliminary analysis, clean energy alternatives and energy-optimized farms will be modeled as clean energy alternatives for Minnesota dairy facilities. An economic analysis will also be conducted on the clean energy alternatives and farms. Potential on-site renewable electric generation may supply some or the entire electric load allowing the buildings to approach net-zero (producing as much energy as is used).
The results of this study provide recent energy usage for farm energy benchmarks, agricultural energy policy, economic evaluations, and further research into dairy farm energy studies. The data will also be useful to producers who are searching for areas for reduced energy usage in their own production systems. Improving the efficiency of electrical components in dairy operations could provide opportunities to improve the carbon footprint of dairy production systems.
Authors
Kirsten Sharpe, Animal Science Graduate Research Assistant, West Central Research and Outreach Center (WCROC), Morris, MN, sharp200@umn.edu
Bradley J. Heins, Associate Professor, Dairy Management, WCROC, Morris, MN
Eric Buchanan, Renewable Energy Scientist, WCROC, Morris, MN
Michael Cotter, Renewable Energy Researcher, WCROC, Morris, MN
Michael Reese, Director of Renewable Energy, WCROC, Morris, MN
Additional information
The West Central Research and Outreach Center (WCROC) has developed a Dairy Energy Efficiency Decision Tool to help provide producers a way to estimate possible energy and costs savings from equipment efficiency upgrades. The tool can be used to evaluate areas of a dairy farm that may provide the best return on investment for energy usage. Furthermore, a guidebook has been developed for Optimizing Energy Systems for Midwest Dairy Production. This guidebook provides additional information about energy usage issues as well as a decision tool. More information may be found at https://wcroc.cfans.umn.edu/energy-dairy
Acknowledgements
The funding for this project was provided by the Minnesota Environment and Natural Resources Trust Fund as recommended by the Legislative-Citizen Commission on Minnesota Resources (LCCMR).
The authors are solely responsible for the content of these proceedings. The technical information does not necessarily reflect the official position of the sponsoring agencies or institutions represented by planning committee members, and inclusion and distribution herein does not constitute an endorsement of views expressed by the same. Printed materials included herein are not refereed publications. Citations should appear as follows. EXAMPLE: Authors. 2019. Title of presentation. Waste to Worth. Minneapolis, MN. April 22-26, 2019. URL of this page. Accessed on: today’s date.
A National Assessment of the Environmental Impacts of Beef Cattle Production
Environmental effects of cattle production and the overall sustainability of beef have become national and international concerns. Our objective was to quantify important environmental impacts of beef cattle production throughout the United States. This provides baseline information for evaluating potential benefits of alternative management practices and mitigation strategies for improving the sustainability of beef.
What did we do?
Surveys and visits of farms, ranches and feedlots were conducted throughout seven regions of the United States (Northeast, Southeast, Midwest, Northern Plains, Southern Plains, Northwest and Southwest) to determine common practices and characteristics of cattle production. These data along with other information sources were used to create about 150 representative production systems throughout the country, which were simulated with the Integrated Farm System Model using local soil and climate data. The simulations quantified the performance and environmental impacts of beef cattle production systems within each region. A farm-to-gate life cycle assessment was used to determine resource use and emissions for all production systems including traditional beef breeds and cull animals from the dairy industry. Regional and national totals were determined as the sum of the production system outputs multiplied by the number of cattle represented by each simulated system.
What we have learned?
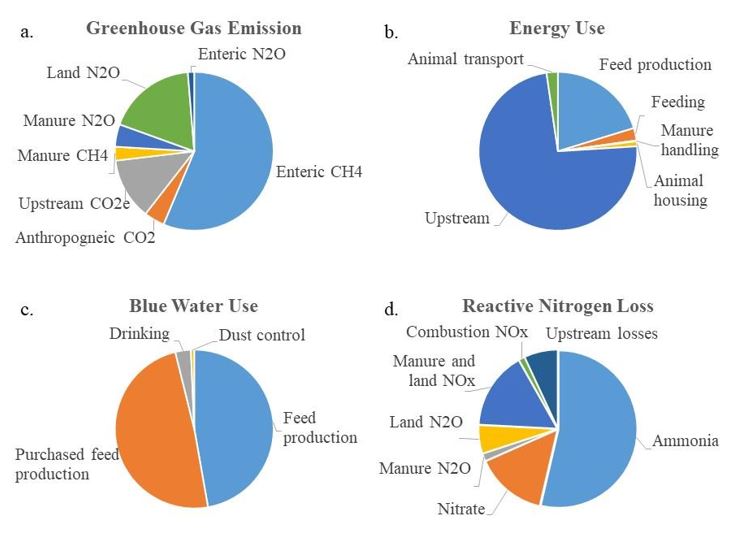
Average annual greenhouse gas emission related to beef cattle production was determined as 268 ± 29 million tons of carbon dioxide equivalent, which is approximately 3.3% of the reported total U.S. emission. Fossil energy use was 539 ± 50 trillion BTU, which is less than 1% of total U.S. consumption. Non-precipitation water use was 6.2 ± 0.9 trillion gallons, which is on the order of 5% of estimated total fresh water use for the country. Finally, reactive N loss was 1.9 ± 0.15 million ton, which indicates about 15% of the gaseous emissions of reactive N for the nation are related to beef cattle production. Expressed per lb of carcass weight produced, these impacts were 21.3 ± 2.3 lb CO2,e, 21.6 ± 2.0 BTU, 0.155 ± 0.012 lb N and 244 ± 37 gal for carbon, energy, reactive N and water footprints, respectively. Many sources throughout the production system contributed to these footprints (Figure 1). The majority of most environmental impacts was associated with the cow-calf phase of production (Figure 2).
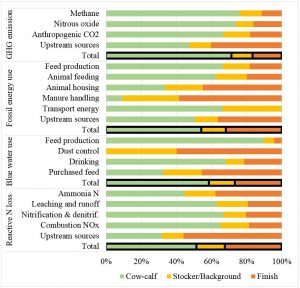
Take-home message: This study is the most detailed, yet comprehensive, study conducted to date that provides baseline measures for the sustainability of U.S. beef.
Future plans
These farm-to-gate values are being combined with sources in packing, processing, distribution, retail, consumption and waste handling to produce a full life cycle assessment of U.S. beef considering additional metrics of environmental and economic impact. Further work is ongoing to complete this full LCA and to more fully assess opportunities for mitigating environmental impacts and improving the sustainability of beef.
Authors
Alan Rotz, USDA-ARS; Senorpe Asem-Hiablie, USDA-ARS; Sara Place, National Cattlemen’s Beef Association; Greg Thoma, University of Arkansas.
Additional information
Information on the Integrated Farm System Model is available in the reference manual:
Rotz, C., Corson, M., Chianese, D., Montes, F., Hafner, S., Bonifacio, H., Coiner, C., 2018. The Integrated Farm System Model, Reference Manual Version 4.4. Agricultural Research Service, USDA. https://www.ars.usda.gov/ARSUserFiles/80700500/Reference%20Manual.pdf.
Further information on the national assessment of the environmental impacts of U.S. cattle production is available in:
Rotz, C. A., S. Asem-Hiablie, S. Place and G. Thoma. 2019. Environmental footprints of beef cattle production in the United States. Agric. Systems 169:1-13.
Acknowledgements
This work was funded in part by The Beef Checkoff and the USDA’s Agricultural Research Service. USDA is an equal opportunity provider and employer.
The authors are solely responsible for the content of these proceedings. The technical information does not necessarily reflect the official position of the sponsoring agencies or institutions represented by planning committee members, and inclusion and distribution herein does not constitute an endorsement of views expressed by the same. Printed materials included herein are not refereed publications. Citations should appear as follows. EXAMPLE: Authors. 2019. Title of presentation. Waste to Worth. Minneapolis, MN. April 22-26, 2019. URL of this page. Accessed on: today’s date.
Environmental Impacts of Dairy Production Systems in the Changing Climate of the Northeast
To meet the nutritional needs of a growing population, dairy producers must increase milk production while minimizing farm environmental impacts. As we look to the future, management practices must also be adapted to maintain production under projected climate change. To plan for the future, better information is needed on practices that can reduce emissions from the farm and adapt to changes in the climate while maintaining or improving production and profitability.
What did we do?
We conducted a comprehensive assessment of the effects of climate change on both the productivity and environmental performance of farms as influenced by strategies to reduce emissions and adapt to the changing climate. Production systems were evaluated using three representative northeastern dairy farms: a 1500-cow farm in New York, a 150-cow farm in Wisconsin and a 50-cow farm in southern Pennsylvania. A cradle-to-farm gate life cycle assessment was conducted using farm-scale process-based modeling and climate projections for high and low emission scenarios. Environmental considerations included the carbon footprint of the milk produced and reactive N and P losses from the farms.
What we have learned?
We found that the environmental impact of the three representative dairy farms generally increased in the near future (2050) climate if no mitigation measures were taken. Overall, feed production was maintained as decreases in corn grain yield were compensated by increases in forage yields. Adaptation of the cropping system through changes in planting and harvest dates and corn variety led to a smaller reduction in corn grain yield, but the detrimental effects of climate change could not be fully negated. Considering the increased forage yield, total feed production increased except for the most severe projected climate change. Adoption of farm-specific beneficial management practices substantially reduced the greenhouse gas emissions and nutrient losses of the farms in current climate conditions and stabilized the environmental impact in future climate conditions, while maintaining feed and milk production (See Figure 1 for example results).
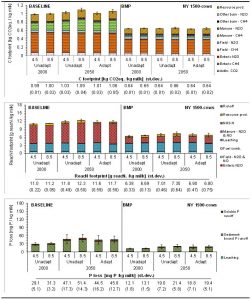
The take-home message is that with appropriate management changes, our dairy farms can become more sustainable under current climate and better prepared to adapt to future climate variability.
Future plans
A more comprehensive life cycle assessment is being done by linking the output of the farm model with life cycle assessment software. The process level simulation of the farm provides inventory information for an inclusive life cycle assessment with multiple environmental considerations. This integrated software will provide a more complete sustainability assessment of the potential benefits of alternative management strategies for both now and the future.
Authors
Karin Veltman, University of Michigan; C. Alan Rotz, USDA-ARS; Larry Chase, Cornell University; Joyce Cooper, Washington State University; Chris Forest, Penn State University; Pete Ingraham, Applied GeoSolutions; R. César Izaurralde, University of Maryland; Curtis D. Jones, University of Maryland; Robert Nicholas, Penn State University; Matt Ruark, University of Wisconsin; William Salas, Applied GeoSolutions; Greg Thoma, University of Arkansas; Olivier Jolliet, University of Michigan.
Additional information
Information on the Integrated Farm System Model is available in the reference manual:
Rotz, C., Corson, M., Chianese, D., Montes, F., Hafner, S., Bonifacio, H., Coiner, C., 2018. The Integrated Farm System Model, Reference Manual Version 4.4. Agricultural Research Service, USDA. Available at: https://www.ars.usda.gov/northeast-area/up-pa/pswmru/docs/integrated-farm-system-model/#Reference.
Information on the analysis of Best Management Practices on northeastern dairy farms is available in:
Veltman, K., C. A. Rotz, L. Chase, J. Cooper, P. Ingraham, R. C. Izaurralde, C. D. Jones, R. Gaillard, R. A. Larsson, M. Ruark, W. Salas, G. Thoma, and O. Jolliet. 2017. A quantitative assessment of beneficial management practices to reduce carbon and reactive nitrogen footprints and phosphorus losses of dairy farms in the Great Lakes region of the United States. Agric. Systems 166:10-25.
Acknowledgements
This work was supported by the National Institute of Food and Agriculture, U.S. Department of Agriculture, under award number 2013-68002-20525. Any opinions, findings, conclusions, or recommendations expressed in this publication are those of the authors and do not necessarily reflect the view of the U.S. Department of Agriculture. USDA is an equal opportunity provider and employer.
The authors are solely responsible for the content of these proceedings. The technical information does not necessarily reflect the official position of the sponsoring agencies or institutions represented by planning committee members, and inclusion and distribution herein does not constitute an endorsement of views expressed by the same. Printed materials included herein are not refereed publications. Citations should appear as follows. EXAMPLE: Authors. 2019. Title of presentation. Waste to Worth. Minneapolis, MN. April 22-26, 2019. URL of this page. Accessed on: today’s date.
