Development of a Livestock Siting Assessment Matrix

Growth in the livestock and poultry industries in Nebraska faces hurdles is greatly influenced by county zoning and local decision-making. Variation in policies from one county to the next and in decisions made by county boards creates significant challenges for agricultural operations and for local communities looking to remain vibrant and grow.  Many were requesting that a common tool be developed for county officials to use that would bring greater consistency and objectivity to the evaluation of proposals to expand animal feeding operations.

What was done?

In 2015, the Nebraska Legislature passed legislation (LB106) that directed the Nebraska Department of Agriculture to convene a committee of experts to develop an assessment matrix for livestock development.  A 10-person advisory committee, including county officials, livestock industry representatives, and me [representing the University of Nebraska] was approved by Governor Ricketts later that year.  In keeping with directions outlined in Nebraska LB106, the committee:

  • Reviewed tools already developed by counties in Nebraska and by other states, mainly those used in Iowa and Wisconsin.
  • Developed a tool (Excel spreadsheet or pdf) that produces quantifiable results based upon scoring of objective criteria;
  • Made concerted efforts to assure that the tool is practical to use when applying for conditional-use permits or special exceptions and when county officials score these applications; and
  • Ensured that all criteria had definite point selections and provided a minimum threshold total score that is required to ‘pass’.

In 2016, the resulting Nebraska Livestock Siting Assessment Matrix (‘Livestock Matrix’) was posted for comments and approved for dissemination by the Nebraska Department of Agriculture.   The Livestock Matrix was recently reviewed and updated by the advisory committee, and the current version is available for public access at http://www.nda.nebraska.gov/promotion/livestock_matrix/index.html.

What we have learned?

Development of the Livestock Matrix was a highly formative process.  Overall, the factors that consumed the vast majority of discussion and effort involved the following:

  • Need for simplicity. Strong sentiments were expressed that the Livestock Matrix should be easy to complete, with little or no need for assembling additional information or consultation.
  • Desire for transparency. Clarity was paramount, with parties on both sides expecting to see numbers and requirements specified up front, which excluded process-based approaches.
  • Questions of merit. Many ‘generally good ideas’ and recommendations were removed when benefits were not well understood or defined, or a practice was considered an industry norm.
  • Will to retain control. Perceived loss of control or potential for new regulation ended discussion of some ideas that otherwise had merit.

Voluntary tool:

LB106 specified that the matrix be “Designed to promote the growth and viability of animal agriculture in this state”, and as a result, the advisory committee was comprised of supporters of [responsible growth of] the livestock and poultry industries.  Support for local control runs deep in Nebraska, though, and one of the most significant hurdles arose early on due to amended language in the final bill, “…develop an assessment matrix which may be used by county officials to determine whether to approve or disapprove” applications.  Voluntary consideration and adoption of the Livestock Matrix at local levels totally changed the nature of the discussions, and made it very challenging to develop a single tool that would have widespread appeal and rate of adoption, virtually guaranteeing that varied policies and practices would still exist.  Despite this challenge, the matrix committee pushed through to develop a ‘template tool’, which has been adopted – either as is or as a template – by some counties.

County setbacks:

The next major hurdle faced was how to handle county setback distances.  With the Livestock Matrix being voluntary, it quickly became clear that county officials were not going to adopt a tool that limited their use of and control over setback distance requirements.  After mulling over options, the committee decided that satisfying the county’s setback requirement would be the primary criterion for obtaining 30 of the 75 points needed to receive a passing score.  To promote positive change, the committee developed sets of sliding-scale ‘base separation distances for odor’ using an approach that drew from the science-based Nebraska Odor Footprint Tool (NOFT).  The intent was that county officials would use these distances [preferably] in establishing county setbacks or as an alternative approach that could be accepted by a county.  Direct use of the NOFT and inherent NOFT concepts within the Livestock Matrix was greatly limited by concerns over the NOFT requiring additional work of applicants, not being sufficiently transparent, and not being applicable for all applicants (esp. open-lot cattle feeders).

The idea of using ‘transitional planning zones’ that add or deduct points based upon consideration of locations of all residents within 1.5 times the separation distance for odor is presented in the alternative approach (Figure 1).

Figure 1. Illustration of planning zones for assessing odor risk.

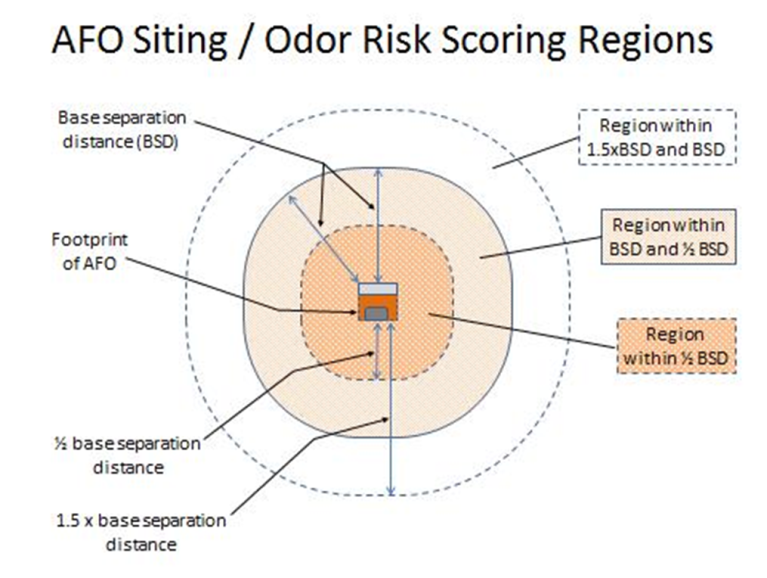
The intent was to bring more information into decisions than just what is the distance to the closest neighbor relative to the county setback.  The zones are mainly presented for information purposes, as there was considerable hesitance to adopt a scoring system that was not considered sufficiently simple and transparent to merit replacing a set separation distance being the criterion.

Water quality / permits:

Committee members shared the view that a proposed expansion that would secure required environmental permits (via Nebraska Department of Environmental Quality, NDEQ) and meet the county’s setback requirement, if any, should generally earn a passing score and not be exposed to local requirements that are often employed to delay and deter operations from expanding.  There was disagreement, however, on whether an applicant should need to complete the rest of the assessment if these two conditions were met.  This issue weighed the applicant’s time and effort completing the assessment against the potential that glaring concerns (point deductions) may arise in another area and that communities may not see the matrix as being comprehensive and credible.  The current matrix conveys an expectation that all main sections be scored, but has been streamlined to minimize required time and effort.

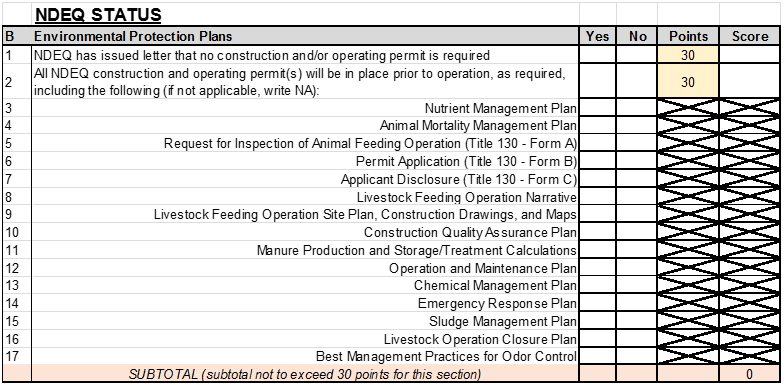
There were also differing views on whether the Livestock Matrix should highlight the various water quality protections that would be put in place or simply that NDEQ requirements would be satisfied.  While there was significant early interest by several committee members to promote and educate the public on stewardship practices required of permitted feeding operations, the desire to reinforce the value of determinations made by NDEQ and to keep the tool very practical to complete and assess carried in the end.  As a result, applicants must indicate that NDEQ approval has been or will be secured to obtain 30 of the 75 points needed to receive a passing score (Figure 2), while indication of the practices that will be implemented is encouraged, but does not affect the score received.

Figure 2. Section to be completed within the Livestock Matrix that addresses environmental protection plans and permits.

This section of the Livestock Matrix arose was discussed again as the committee considered those applicants who would receive a letter from NDEQ stating that a permit would not be required – primarily applicable to small animal feeding operations and operations that involved dry manure.  The challenge presented was, ‘Does having official approval to go forward without needing a permit offer the same protections and merit the same points as would exist if required plans were developed to secure permits?’  The issue became prominent when a broiler processing facility was approved for construction, which required constructing hundreds of new broiler (chicken) houses in the state, none of which would likely require an NDEQ permit.  The main concern was that such facilities could be approved without having nutrient management plans (and a few other desired plans) in place to limit potential nutrient loading of ground and surface waters from application of manure at rates exceeding crop needs.  The company associated with the current large poultry expansion took a proactive stance and internally requires all of its growers to have nutrient management plans in place and qualify for an NDEQ permit, resolving the immediate concerns, but not the longer-term issue with the Livestock Matrix.  The committee will continue to examine ways to better highlight and reinforce the importance of nutrient management within the Livestock Matrix without suggesting changes in NDEQ regulation.

Other environmental sections:

Six more sections address various environmental risks and protections, including:

  • Environmental and zoning compliance record
  • Water quality protection – livestock facilities
  • Odor and dust control for facilities
  • Manure application practices
  • Manure application separation
  • Additional assurance of environmental protection

Each of these sections was refined down to a list of items that the committee believed merited inclusion in determining the total score.

Non-environmental sections:

Additional sections address other topics such as:

  • Traffic
  • Locations of the authorized representative and the site manager relative to the facility
  • Communication with the community
  • Economic impact
  • Landscaping and aesthetics

Each of these areas was well-understood to influence acceptance by the community.  Probably the biggest challenge for the committee was assigning appropriate section scores and total passing scores to value the importance of these areas without suggesting that an environmentally risky application could achieve a passing score through strong scores in these other areas.

Impacts and Implications

In developing the Nebraska Livestock Siting Assessment Matrix, the committee made available a well-critiqued tool for voluntary consideration by county officials.  Overall, the Livestock Matrix strikes a sometimes uncomfortable balance between being comprehensive and scientifically correct and being transparent and easy to use.  Although the Livestock Matrix will likely fall short of the original goal of achieving consistency and uniformity in Nebraska’s county zoning policies and practices, county officials are considering the matrix as a template zoning tool or as a gauge for evaluating and adjusting current policy.

 Next Steps

The Nebraska Department of Agriculture is continuing to promote adoption of the Nebraska Livestock Siting Assessment Matrix, especially to counties looking to be officially designated as “Livestock Friendly”.  The matrix will be evaluated again in 1-2 years.

Authors

Richard R. (Rick) Stowell, Extension Specialist – Animal Environment, Rick.Stowell@unl.edu

Additional Information

For more information on the Nebraska Odor Footprint Tool, visit https://water.unl.edu/manure/odor-footprint-tool.

Acknowledgements

The other members serving  on the committee included: John Csukker; Elizabeth Doerr, Leon Kolbet, Dean Krueger, Mark McHargue, Jennifer Myers, Sarah Pillen, Andrew Scholting, Steve Sill.


The authors are solely responsible for the content of these proceedings. The technical information does not necessarily reflect the official position of the sponsoring agencies or institutions represented by planning committee members, and inclusion and distribution herein does not constitute an endorsement of views expressed by the same. Printed materials included herein are not refereed publications. Citations should appear as follows. EXAMPLE: Authors. 2019. Title of presentation. Waste to Worth. Minneapolis, MN. April 22-26, 2019. URL of this page. Accessed on: today’s date.

Comparison between Different Approaches to Estimating Nutrient Balances in Livestock Production Watersheds

Nutrient budgets have been historically developed on livestock farms to improve nutrient use efficiency and reduce field losses. There is growing interest in developing nutrient budgets, particularly for nitrogen and phosphorus, on larger spatial scales such as watersheds and river basins to guide water quality improvement efforts. A big obstacle to developing such budgets is the lack of access to management practices on individual farms. On the other hand, publicly-available data for larger spatial scales, such as survey and census data compiled by the U.S. Department of Agriculture, is typically aggregated to the county or state level. There is a need for a methodology that reliably estimates nutrient budgets in individual watersheds across different production conditions. This study investigates the potential of incorporating spatial data products to refine estimated nutrient budgets. Three different approaches for nutrient budget development will be evaluated across different watersheds, HUC-10 level. Sources of uncertainty in the developed nutrient budgets will be assessed and their respective contribution to the overall budgets will be quantified.

Corresponding Author

Sharara Mahmoud, North Carolina State University, m_sharara@ncsu.edu

Other authors

Horacio Aguirre-Villegas, University of Wisconsin-Madison

Rebecca Larson, University of Wisconsin-Madison


The authors are solely responsible for the content of these proceedings. The technical information does not necessarily reflect the official position of the sponsoring agencies or institutions represented by planning committee members, and inclusion and distribution herein does not constitute an endorsement of views expressed by the same. Printed materials included herein are not refereed publications. Citations should appear as follows. EXAMPLE: Authors. 2019. Title of presentation. Waste to Worth. Minneapolis, MN. April 22-26, 2019. URL of this page. Accessed on: today’s date.

Evaluating Manure Nutrient Density and Paths for Improved Distribution

Increased density of livestock farms in some locations has increased manure nutrient density applied to the land base in that area. The increased nutrient density in some cases exceeds crop demands and leads to increased nutrient losses to the environment. In this study, we are using new approaches (including optimization modeling) to better inform stakeholders on locations which have excess manure nutrients produced as compared to crop uptake and pathways to improve distribution of manure nutrients including manure processing and transport options. The output of this work can be used to guide policy and development of methodologies to transport manure nutrients most cost effectively to improve nutrient distribution over a larger land-base area (such as a watershed).

What did we do?

We gathered data for livestock facilities in Wisconsin including location and production of manure to determine nutrient production as well as cropping information to determine nutrient uptake over a given land base. We then gathered information on several manure processing systems and used optimization models to identify the most cost effective methods of processing and transport to improve nutrient distribution.  

What have we learned?

We have found that some manure processing technologies are more economically viable than other technologies based on the desired environmental goal. In addition, we have begun to outline specific policy incentives that may be needed to begin to see increased installations of the manure processing systems modeled.  

Future plans

We plan to further investigate additional manure technologies, develop a website so others can integrate data into the models, and run additional scenarios to guide investments on manure processing systems. In addition, out next steps look to integrate life cycle assessment data into the optimization models for refinement of integration of environmental impacts.

Authors

Rebecca A. Larson, Associate Professor, Biological Systems Engineering, University of Wisconsin-Madison, rebecca.larson@wisc.edu

Horacio Aguirre-Villegas, Assistant Scientist, Biological Systems Engineering, University of Wisconsin-Madison

Mahmoud Sharara, Assistant Professor, North Carolina State University

Victor Zavala, Associate Professor, Chemical & Biological Engineering, University of Wisconsin-Madison

Apoorva Sampat, Chemical & Biological Engineering, University of Wisconsin-Madison

Yicheng Hu, Chemical & Biological Engineering, University of Wisconsin-Madison

Acknowledgements   

This material is based on work that is supported by the National Institute of Food and Agriculture, U.S. Department of Agriculture, under award number 2017-67003-26055.


The authors are solely responsible for the content of these proceedings. The technical information does not necessarily reflect the official position of the sponsoring agencies or institutions represented by planning committee members, and inclusion and distribution herein does not constitute an endorsement of views expressed by the same. Printed materials included herein are not refereed publications. Citations should appear as follows. EXAMPLE: Authors. 2019. Title of presentation. Waste to Worth. Minneapolis, MN. April 22-26, 2019. URL of this page. Accessed on: today’s date.

Sand bedding for cows, is it a contaminant? Is it sustainable for our soils?

The question came up at an extension meeting on manure as to how adding 18,250 lbs. of sand per cow stall per year was impacting the soil.  Words like a “it will take a long time” and “not sure” didn’t serve as satisfactory answers.

Upon talking to a soil scientist, I found in 25 to 50 years the soil texture could include 20% more sand, when using a vertical tillage system.  By the look on his face I could tell that was not a good thing. This has led me to ask what impact will this have on our soil if it continues?

What did we find?

First, I confirmed the recommendation of 50 lbs. of sand per cow stall per day from the Dairyland Initiative.  50 lbs./ stall/ day x 365 days = 18,250 lbs./stall/year. About 2/3 of a dump truck per year per cow stall.truck

In surveying dairies in the Midwest, the average dairy has between 2 and 4 acres of land for which to spread manure, for each cow.  At that rate, if equally spread, the dairy farmer will be adding between 4,550 lbs. and 9,125 lbs. per acre per year.

Also, in interviewing the farmers we found a majority of them utilize vertical tillage.  In vertical tillage the top 3 inches of soil material is mixed. The sand will accumulate in the top 3” unless another system of tillage is utilized.  At a rate of 4,550 – 9,125 lbs./year depending if you have 2, 3, 4 acres of area to spread your manure on with vertical tillage, it will take between 25 and 50 years to change the soil 20% more sand.   Example-from a 40% loam to a 60% sandy loam.

soil samples
Sand added Top 3″

W.H. Gardner published (1962) work he was doing on infiltration when there was a difference in soil texture.  It showed when the pore space or texture differed, water infiltration slowed down.

If the pore space is smaller on top it will hold water tightly and will not allow it to infiltrate to the larger pore space until the pore spaces are filled up.
If the pore spaces are larger on top, the water more easily will move in the large spaces before moving downward once the upper pore spaces are filled.

We did an experiment adding 20% more sand to the top 3” of a glass cylinder (1).  A second glass cylinder was filled with the same parent soil as the first (2).

Every soil will be unique, but in this trial, it took 5 minutes for the water to infiltrate to the bottom on the original parent soil (2).  In the cylinder with sand added (1), it took 1 hour and 10 minutes to reach the bottom.

In several follow up trials with various soils the pattern was repeated.  The sand added cylinder was significantly slower to let water in. Unlike the example with the cylinders we do not have a containment system on fields to hold the water in place until it can soak in.  If our fields have no containment runoffsystem around them the water will become runoff as in this picture.

As we add sand to the top 3“of soil, organic matter is diluted.  Organic matter plays a part in several areas.

sand propertiesSand has a cation exchange of 10 or less.  Organic matter significantly increases the cation exchange of the soil.  More sand and less organic matter decrease the ability of the soil to retain nutrients, such as phosphorus.  If we cannot hold onto the nutrients, nutrification of our waters will occur and have negative consequences for the environment.

A second benefit of organic matter is at a 3” depth, for each 1% of organic matter we lose, we also lose 13,500 gallons of water holding capacity.  This is important for filling out ears of corn and maturation of crops in a timely manner.

Summary of what we have learned.

    1. The addition of sand at these levels decreases the rate of infiltration of rainfall causing runoff.  This runoff takes with it soil, nutrients and the water we could use for our crops.
    2. The cation exchange decreases as sand dilutes the top 3” of vertically tilled fields.  With a lower cation exchange, there is a decrease in the soils ability to hold nutrients.  Nutrients the crops could use. Nutrients that cost money to provide. Nutrients in too abundant supply, do harm in our water system.
    3. A decrease in organic matter also decreases the ability of soils to hold water.  For each 1% loss of organic matter we lose 13,500 gallons of water holding capacity.
    4. The quality per volume of manure is also diminished.   As sand is added to the manure the % of N, P, K, and sulfur is diminished.semisolid dairy manure: Sand vs mattresses or organic bedding

A definition of a contaminant is “either biological, chemical, physical or radiological substance that becomes harmful for humans or living organisms”.  If sand bedding is not a contaminant, it acts like one.

 Future plans.  

The challenge is to make this information aware to dairy farmers and people who assist them in understanding the options available and making decisions.  Specifically, the challenge is to be able to bring the future to the present so the ramifications of the current practice of adding 18,250 lbs. of sand per cow stall per year to our soils is recognized as unsustainable and another system can be implemented to benefit the soils.  

Author

Mark Misch of DCC Waterbeds, markm@advancedcomforttechnology.com

Acknowledgements.  

I would like to thank Professors Bill Bland and Francisco Arriaga-University of Wisconsin Department of Soil Science for their assistance.  One of several videos showing the dynamics of water movement through the soil can be accessed by the following link. https://www.youtube.com/watch?v=ego2FkuQwxc

The authors are solely responsible for the content of these proceedings. The technical information does not necessarily reflect the official position of the sponsoring agencies or institutions represented by planning committee members, and inclusion and distribution herein does not constitute an endorsement of views expressed by the same. Printed materials included herein are not refereed publications. Citations should appear as follows. EXAMPLE: Authors. 2019. Title of presentation. Waste to Worth. Minneapolis, MN. April 22-26, 2019. URL of this page. Accessed on: today’s date.

Innovative Use of Solar Energy to Mitigate Heat Stress in Sows

Food retailers and consumers worldwide are pressuring producers to reduce the use of fossil fuels and the carbon footprint of swine production systems. The primary objective of this study was to evaluate a solar-powered system designed to cool sows that might reduce the use of fossil fuels in farrowing rooms and improve performance of lactating sows.

What did we do?

Two mirror-image, farrowing rooms equipped with 16 farrowing stalls each were used for this study.  Each farrowing stall in the COOL room was equipped with a cooled flooring insert (Cool Sow, Nooyen Manufacturing) under the sow and a single nipple drinker delivering chilled drinking water.  Circulating water cooled by a water-source heat pump powered by a 20 kW photovoltaic solar array cooled the floor inserts (60 to 65 °F) and chilled the drinking water (55 to 60 °F). Warm water (110 to 119 °F) was circulated through pads in the piglet creep area.  The CONTROL room was nearly identical to the COOL room except there was no cooling of floor inserts or drinking water and supplemental heat for piglets was provided by one heat lamp (125 W) per farrowing stall (Group 1) or an electric heating pad (Hog Hearth, Innovative Heating Technologies; Group 2).  Groups (n = 28 CONTROL sows and 28 COOL sows) were studied during summer months and room heaters were operated to keep rooms above 75 °F to ensure sows were heat stressed. Electric consumption for all systems (ventilation, piglet heating, lights, and cooling system) was measured and performance of sows and piglets were recorded over lactation.

What have we learned?

The COOL room consistently used more electricity than the CONTROL room (Figures 1 and 2).  For Group 1, the COOL room used 93.0 kWh/day while the CONTROL room used 35.3 kWh/day. Similarly in Group 2, the COOL and CONTROL rooms required 71.5 and 19.7 kWh/day, respectively.  Production of electricity from the solar panels totaled 95.3 and 86.7 kWh/day, respectively. Sows housed in the COOL room were more comfortable as indicated by a lower respiration rate (64.4 vs 96.8 breaths/min; P < 0.01), higher feed intake (11.39 vs 9.25 lb/d; P < 0.01) and reduced lactation body weight loss (35.1 vs. 54.2 lbs; P < 0.06) compared with sows housed in the CONTROL room.  Litter size at birth and weaning as well as piglet weaning weights were not different across rooms.

The cooling systems (cooled floor and cooled drinking water) and piglet heating systems studied effectively mitigated heat stress of lactating sows but did not enhance pig performance.  Furthermore, these systems required over 2.5 times more total electrical energy than a traditional lactation housing system without sow cooling.

Future Plans:

Effects of cooled floors and cooled drinking water were confounded in this study.  Cooled floors are expensive and difficult to install in existing facilities. The effects of cooled drinking water will be assessed independent of cooled floors in future studies.  Cooled drinking water will be easier to install in existing barns. Future analyses will consider the economic feasibility of various components of the sow cooling and piglet heating systems.  

Corresponding authors, titles, and affiliations:

B. M. Lozinski1, M. Reese1, E. Buchanan1, A. M. Hilbrands1, K. A. Janni2, E. Cortus2, B. Hetchler2, J. Tallaksen1, Y. Li1, and L. J. Johnston1

1West Central Research and Outreach Center, University of Minnesota, Morris, and

2Department of Biosystems and Biological Engineering, University of Minnesota, St. Paul

Acknowledgements:

The authors would like to express gratitude to the Minnesota Environment and Natural Resources Trust Fund for their financial support of this project.


Figure 1. Total energy use by room (kWh) and total solar energy produced (kWh) per day for Group 1.


Figure 2. Total energy use by room (kWh) and total solar energy produced (kWh) per day for Group 2.


The authors are solely responsible for the content of these proceedings. The technical information does not necessarily reflect the official position of the sponsoring agencies or institutions represented by planning committee members, and inclusion and distribution herein does not constitute an endorsement of views expressed by the same. Printed materials included herein are not refereed publications. Citations should appear as follows. EXAMPLE: Authors. 2019. Title of presentation. Waste to Worth. Minneapolis, MN. April 22-26, 2019. URL of this page. Accessed on: today’s date.

Quantitative Analysis of Words in Popular Press Articles about Livestock and Environment

Livestock farming practices and technologies, like many aspects of agriculture and industry, continue to evolve. As technology and attitudes change regarding livestock farming, public response changes as well; this is reflected in the way that people talk and write about the subject. This change and growth is a common topic  of both public and technical debate and scrutiny. Databases on the internet collect public articles and documents related to livestock farming dating back to the early 1980’s. The information in these articles can be evaluated using a number of computer science based approaches. These data can help to highlight how significant past events and their impacts were perceived, and possibly predict  how future trends within the industry will be described in popular press/media.

What Did We Do?

We gathered popular press articles from an online database, Factiva, with the search terms “livestock and odor,” from the year 2000 to the present. A computer program developed using machine learning processes: (1) cleans and structures the individual articles into text files; and (2) quantifies the importance and frequency of words in individual and groups of articles, by year. The program assigns two measures of importance to each word. Words that frequently occur in many articles per year provide broad overarching ideas and subjects. Words that are deemed important to each  individual article provide more nuanced data including companies, people, and equipment discussed in livestock farming. To demonstrate the results, this data is visualized in tables and graphs to show patterns in subjects as they develop and change over time.

What Have We Learned?

This analysis method gives us a quantitative basis for reviewing the change in importance of words over time. All analysis after choosing the subject and search terms is done by a computer program, protecting the outcomes from reader bias. Changes in word importance or frequency can be supported with numerical data and easily visualized from year to year. The different approaches also allow for inferences between long-term subjects and ideas (Table 1), and shorter term players in the industry (Table 2).

This analysis method does not pull out the context that any of the words are used. Manure and waste are two means of describing the same material, with different connotations. Manure and waste appeared at similar frequencies in many, but not all years. Dairy was more prominent in 2011 and 2013, but hogs (or synonyms) appeared in most years. Refinements to the article search protocol could limit the articles to those of opinion (i.e. editorials) or regional perspectives. There are opportunities for this method to inform historical reviews of livestock and the environment, and inform future communication efforts.

Future Plans

There are a number of opportunities to extend this project in the future. One would be to experiment with different search terms and databases to see how outcomes depend on the data source. Another opportunity would be to apply the quantitative method to other applications. The computer program could be applied to any database and so the method has utility to topics other than livestock farming.

Authors

Ryan Felton, Undergraduate Research Assistant, University of Minnesota

Erin Cortus, Assistant Professor and Extension Engineer, University of Minnesota

ecortus@umn.edu

Additional Information

Project support provided by the University of Minnesota UROP program.

Table 1. The top twenty words by year that most frequently appeared in a popular press article database search based on the keywords “livestock and odor”, by year. The relative frequency of some livestock types (cattle, hog, dairy) and manure-related words (manure, waste) are highlighted.


Table 2. The top twenty words by year that were the important focus of articles in a popular press article database search based on the keywords “livestock and odor”.


The authors are solely responsible for the content of these proceedings. The technical information does not necessarily reflect the official position of the sponsoring agencies or institutions represented by planning committee members, and inclusion and distribution herein does not constitute an endorsement of views expressed by the same. Printed materials included herein are not refereed publications. Citations should appear as follows. EXAMPLE: Authors. 2019. Title of presentation. Waste to Worth. Minneapolis, MN. April 22-26, 2019. URL of this page. Accessed on: today’s date.


Feed Manipulation, Manure Treatment and Sustainable Poultry Production

This study examined the effects of different treatments of poultry faecal matter on potential greenhouse gas emission and its field application and also evaluated dietary manipulation of protein on the physico-chemical quality of broiler faeces and response of these qualities to 1.5% alum (Aluminium sulphate) treatment during storage.

Poultry litters were randomly assigned to four treatments: salt solution, alum, air exclusion and the control (untreated). Chicks were allotted to corn-soy diets for 42d. The diets were 22 and 20% CP with methionine + lysine content balance and, 22 and 20% CP diets with 110% NRC recommendation of methionine and lysine.

Alum treated faeces had higher (p<0.05) nitrogen retention than other treatments. Treated faecal samples retained more moisture (p < 0.05) than control. The pH tended to be acidic in treated samples (alum, 6.03, p<0.05) and alkaline in the control (7.37, p<0.05). Mean faecal temperature was lower for alum treated faecal samples (28.58oC, p<0.05) and highest for air-tight (29.4oC, p<0.05). Nitrogen depletion rate was significant lower (p<0.05) in alum treated faecal samples. Post-storage, samples treated with alum increased substantially (≥ 46.51%) in total microbial count, while total viable count was lower (p>0.05; 2.83×10⁶ cfu/ml) in air-tight treatment. Maize seeds planted on alum, air-excluded and control litter soils had average germination percentage range of 65–75%, 54–75% and 74-75%, respectively. In Sorghum plots, GP was 99%, and 89%, respectively for alum and air-tight treated soil 2WAP. Average maize height 21DAP was 48 cm and 23 cm for alum and air-tight treatment, respectively. Salt treated faecal samples did not support germination. Faecal pH of broiler fed low protein diets was acidic (4.76-4.80) while treatment with alum (1.5%) led to further reduction in pH (4.78 to 4.58) faecal nitrogen and organic matter compared with control faeces in a 7 days storage. Faecal minerals were generally lower. In conclusion, feeding low level of dietary protein with or without methionine and lysine supplementation in excess of requirement is a suitable mitigation for nitrogen emission and mineral excretion in broiler production. Alum treated poultry litter will mitigate further nitrogen loss in storage because it lowered nitrogen depletion rate, pH, weight, temperature and supports potential agronomic field application index.

On-farm Demonstration of the application of these results to assist farmers to produce poultry sustainably.

Further reading

https://scholar.google.com/citations?hl=en&user=NZGTKC8AAAAJ#d=gs_md_cita-d&u=%2Fcitations%3Fview_op%3Dview_citation%26hl%3Den%26user%3DNZGTKC8AAAAJ%26citation_for_view%3DNZGTKC8AAAAJ%3AW7OEmFMy1HYC%26tzom%3D-60  

*BOLU, Steven Abiodun, ADERIBIGBE, Simeon Adedeji  OLAWALE, Simon, Malomo, G. A., Olutade, S.G and Suleiman, Z.G. Department of Animal Production, University of Ilorin, Ilorin, Kwara State, Nigeria.
*Corresponding Author: Department of Animal Production, University of Ilorin, Ilorin, Kwara State, Nigeria.
Email: bolusao2002@yahoo.co.uk Phone: +234 8060240049

The authors are solely responsible for the content of these proceedings. The technical information does not necessarily reflect the official position of the sponsoring agencies or institutions represented by planning committee members, and inclusion and distribution herein does not constitute an endorsement of views expressed by the same. Printed materials included herein are not refereed publications. Citations should appear as follows. EXAMPLE: Authors. 2019. Title of presentation. Waste to Worth. Minneapolis, MN. April 22-26, 2019. URL of this page. Accessed on: today’s date.

Revenue Streams from Poultry Manure in Anaerobic Digestion (AD)

DUCTOR Corp. has developed a biological process that separates and captures nitrogen (ammonia) from organic waste streams. The biogas industry is a natural platform for this biotechnology as it solves the problem of ammonia inhibition, which has long bedeviled traditional anaerobic digestion (AD) processes. DUCTOR’s technology allows for stabilized and optimized biogas production from 100% high nitrogen feedstocks (such as poultry manure) and significantly strengthens the economics of biogas facilities: relatively inexpensive inputs, optimized gas production as well as new, higher value revenue streams from the organically produced byproducts—a pure Nitrogen fertilizer and a high Phosphorus soil amendment. DUCTOR’s mission is to promote biogas as a renewable energy source while securing efficient waste management and sustainable food & energy production, supporting the development of circular economies.

Purpose

Figure 1. High Nitrogen Feedstock-molecular structure
Figure 1. High Nitrogen Feedstock

High concentrations of ammonia in organic waste streams have been a perpetual challenge to the biogas industry as ammonia is a powerful inhibitor of biogas production. In typical methanogenic communities, as ammonia levels exceed 1500mg/L Ammonia-N, the inhibition of methane production begins until it reaches toxic levels above 3000mg/L. Traditionally, various mechanical and chemical methods have been deployed to lower ammonia concentrations in high nitrogen organic feedstocks prior to or following biodigestion (Figure 1). These methods have proven cumbersome and operationally unstable. They either require dilution with often costly supplemental feedstocks, are fresh water intensive, waste valuable nutrients, or require caustic chemicals injurious to the environment. Without the application of these methods, nitrogen levels will build up in the digester and negatively affect the efficiency of biogas (methane) production. DUCTOR’s proprietary process revolutionizes ammonia removal with a biological approach, which not only optimizes the operational and economic performance of biogas production, it also allows for the ammonia to be recaptured and recycled as an organic fertilizer product (a 5-0-0 Ammonia Water). This biotechnical innovation represents a significant advancement in biogas technology.  

What did we do?

DUCTOR’s innovation is the invention of a fermentation step prior to the classic anaerobic digestion process of a biogas facility (Figure 2).  During this fermentation step in a pre-treatment tank, excess nitrogen is biologically converted into ammonia/ammonium and captured through a physical process involving volatilization and condensation of the liquid portion of the digestate.


Typical DUCTOR facility layout
Figure 2. Typical DUCTOR facility layout

We ran a demonstration biogas facility with these two steps in Tuorla, Finland for 2000 hours using 100% poultry litter as fermenter feedstock without experiencing ammonia inhibition of the methanogenesis process. While the control, a single-stage traditional digester, showed increased buildup of toxic ammonia, the fermented material coming out of the first stage of the DUCTOR process (having ~50-60% of its nitrogen volatilized and removed) exhibited uniform levels of nitrogen below the inhibition threshold (Figure 3). This allowed a stable and efficient digestion by the methanogenic microbial community in the second stage digester. The fermentation step effectively eliminates the need for co-digestion of poultry manures with other higher C/N ratio substrates.

Figure 3: Ammonium concentration & Methane quantities in treated and untreated substrates

What we have learned?

In addition to solving the problem of ammonia inhibition, DUCTOR’s innovation realizes the separation of valuable recycled nutrients in a manner that can produce additional revenue streams. The result of the fermentation process in the first stage digestion tank is an organically produced non-synthetic ammonia (NH4OH), which is condensed and collected. This ammonia water product can be marketed and sold as an organic fertilizer as it is the result of a completely biological process with no controlled chemical reactions. The non-synthetic ammonia produced comes from the digestion of poultry litter by ammonifying microorganisms in anaerobic conditions. Furthermore, this ammonia water is in a plant available form that can be metered onto fields based on crop demands and thus reduce the amount of excess nitrates leaching into the water table and surrounding watershed.

The solids byproduct that results from the completion of the anaerobic digestion process has a large fraction of phosphorus and potash. This digestate can be dried and pelleted to produce a high-phosphorus soil amendment. While recognizing demand for this product would vary by region based on existing phosphorus levels in the soil, it offers a transportable & storable way to return these valuable elements to the nutrient cycle.

nutrient life cycle

Finally, the importance of gas production as a form of sustainable, renewable energy cannot be understated. With 2/3rds of the world’s greenhouse gas emissions coming from the burning of fossil fuels for energy or electricity generation,1 biogas derived from anaerobic digestion can displace some of those processes and reduce environmental greenhouse gas emissions.2 Currently, there are many state and federal policies focusing on renewable energy credits and low carbon fuel standards to incentivize this displacement.3 With the ability to unlock poultry litter as an additional AD feedstock, biogas facilities can offer greater volumes of biogas production per ton of manure than either dairy or swine.

Future plans

We have several commercial projects that will feature the DUCTOR technology at various stages of development in North America. The demonstration facility at Tuorla has been disassembled and shipped to Mexico where it will be reassembled as part of a larger commercial project there. In cooperation with our Mexican partner, we will demonstrate successful operations under a new set of conditions, including different climate and a new source of poultry litter from different regional growing practices. We further intend to demonstrate the highly efficient water use of the process in a drought-prone area.

Additionally, we have received approval from the North Carolina Utilities Commission for entry into their pilot program for injecting biomethane into North Carolina’s natural gas pipelines. Our first project there is expected to begin construction in Spring 2019 to be completed and operational by early 2020. These projects, and others in development, will bring a very attractive and new manure management option to poultry farmers, while recycling nutrients from the waste stream and returning them to the soil in a measurable and sustainable manner.

Author

Bill Parmentier, Project Development, DUCTOR Americas

bill.parmentier@ductor.com

Additional information

https://www.ductor.com


1Global Greenhouse Gas Emissions Data, US Environmental Protection Agency (EPA), https://www.epa.gov/ghgemissions/global-greenhouse-gas-emissions-data

2Sources of Greenhouse Gas Emissions, US Environmental Protection Agency, https://www.epa.gov/ghgemissions/sources-greenhouse-gas-emissions

3Methane is a potent greenhouse gas that is over 20 times more damaging on the environment than carbon dioxide. Anaerobic digestion stops the release of methane into the environment by capturing it and using it for energy production or transportation fuel.

Federal incentives include the Rural Energy for America Program (REAP), Alternative Fuel Excise Tax Credit, & Federal Renewable Energy Production Tax Credit to name a few. Examples of state level incentives include various states Renewable Portfolio Standards (RPS) as well as California’s Low Carbon Fuel Standard (LCFS) or Oregon’s Clean Fuels Standard (CFS).


The authors are solely responsible for the content of these proceedings. The technical information does not necessarily reflect the official position of the sponsoring agencies or institutions represented by planning committee members, and inclusion and distribution herein does not constitute an endorsement of views expressed by the same. Printed materials included herein are not refereed publications. Citations should appear as follows. EXAMPLE: Authors. 2019. Title of presentation. Waste to Worth. Minneapolis, MN. April 22-26, 2019. URL of this page. Accessed on: today’s date.

Pasture-based Dairy Impact on Nitrogen and Phosphorus Cycling in Response to Grazing Grass-Legume Mixtures over Monocultures

There are over 3.5 million milk cows in the Western United States, making dairy one of the dominant sectors of western agriculture. Organic milk production is the fastest growing segment of U.S. organic agriculture and as a result there has been an increase in pasture-based milk production. To meet this increasing demand, improved grass-legume pastures that require fewer inputs, have high forage production and nutritive value, improve ruminant utilization of nitrogen, and have high dry matter intake are critical to the economic viability of pasture-based organic dairies. While grazing has many benefits, it may accelerate nutrient cycling and potentially increase nitrate leaching along with being a significant contributor of ammonia (NH3) and greenhouse gases (GHG). Dietary changes can impact emissions.  This study examines the effect of condensed tannins (CT) on nutrient cycling in the grass-legume versus grass monoculture grazing systems.  The nitrogen content in urine and feces of cattle grazing forages with, and without CT, was also examined and compared to a traditional TMR diet.  

What did we do?

Four grasses, with and without the addition of a tannin-containing legume, birdsfoot trefoil (Lotus corniculatus), are examined in this study.  The treatments include tall fescue (Lolium arundinaceum); meadow bromegrass (Bromus biebersteinii); orchardgrass (Dactylis glomerata); perennial ryegrass (Lolium perenne) planted as monocultures; and each of the four grasses planted with birdsfoot trefoil for a total of eight treatments.  Treatments were grazed by Jersey heifers using a rotational grazing system(1 week intervals). All treatments were fertilized with Chilean nitrate in April of 2017 and 2018.  Grass monocultures were fertilized with feather meal in June 2017 and March 2018, and Chilean nitrate in July 2017 and 2018.

Grab fecal and urine samples were collected at the beginning of the grazing season and additionally every five weeks at the end of grazing rotations.  Fecal samples were analyzed for total nitrogen by combustion method. Leachate was collected weekly by means of suction cup lysimeters and bi-weekly by means of zero-tension lysimeters and analyzed for nitrate-nitrogen using method 10-107-04-1-R on a Lachat FIA analyzer.

What we have learned?

Urea in urine, and fecal nitrogen were highest in the feedlot system (TMR diet).  Urea and fecal nitrogen in the grazing systems were higher in the grass-legume mixtures than the grass monocultures even though tannins have been shown to shift nitrogen from the urine to the feces.  This is most likely due to the higher protein (nitrogen) content of the grass-legume mixtures compared to the grass monocultures (data not shown). Despite the higher protein content of the grass-legume mixtures, the treatments containing birdsfoot trefoil exhibited less nitrogen loss due to leaching than the grass monocultures. Grass-legume mixtures have the potential to greatly improve the economic viability of a grazing operation while reducing the environmental impacts.  

Figure 1. Average total nitrogen (%) in feces.
Figure 2. Average urea in urine (mg/L)
Figure 3. Average leachate nitrate-N/lysimiter (mg)

Future plans

This study will be repeated for another year using Holstein heifers instead of Jersey heifers to see if there is a difference in nitrogen utilization between breeds. Treatments that are not being grazed will be harvested and fed in a feedlot setting to see if the benefits of birdsfoot trefoil remain when it is fed as silage.

Authors

Jennifer Long, Agricultural Systems Technology and Education Dept.; Utah State University

Jennifer.Long@aggiemail.usu.edu


Rhonda Miller, Ph.D.; Agricultural Systems Technology and Education Dept.; Utah State University

Blair Waldron, Ph.D.; USDA-ARS Forage and Ranger Research Lab

Clay Isom, Ph.D.; Animal, Dairy and Veterinary Sciences Dept.; Utah State University

Kara Thornton, Ph.D.; Animal, Dairy and Veterinary Sciences Dept.; Utah State University

Kerry Rood, Ph.D.; Animal, Dairy and Veterinary Sciences Dept.; Utah State University

Michael Peel, Ph.D.; USDA-ARS Forage and Range Research Lab

Earl Creech, Ph.D; Plants, Soils, and Climate Dept.; Utah State University

Jacob Hadfield; Animal, Dairy and Veterinary Sciences Dept.; Utah State University

Marcus Rose; Plant, Soils, and Climate Dept.; Utah State University


The authors are solely responsible for the content of these proceedings. The technical information does not necessarily reflect the official position of the sponsoring agencies or institutions represented by planning committee members, and inclusion and distribution herein does not constitute an endorsement of views expressed by the same. Printed materials included herein are not refereed publications. Citations should appear as follows. EXAMPLE: Authors. 2019. Title of presentation. Waste to Worth. Minneapolis, MN. April 22-26, 2019. URL of this page. Accessed on: today’s date.

Energy Consumption in Commercial Midwest Dairy Barns

Consumer interest and concern is growing in regards to sustainability of livestock production systems. Demand for reduced carbon emissions within agricultural systems has been growing along with increasing demand for food. Baseline fossil fuel consumption within agricultural systems, including dairy production, is scarce. Therefore, there is a need to discern where and how fossil energy is being used within dairy production systems. Determining baseline energy use is the first step in investigating the demand for a reduced carbon footprint within dairy production systems. The objective of this study was to measure total electricity use and determine specific areas of high energy consumption in commercial dairy barns located in the Upper Midwest of the United States.

What did we do?

Four commercial dairy barns representative of typical Midwest dairy farms and located in west central Minnesota were evaluated in the study. The dairy farms were: 1) a 9,500 cow cross-ventilated barn with a rotary milking parlor (Farm A), 2) a 300 cow naturally-ventilated barn with stirring fans for air movement and 6 automatic milking systems (Farm B), 3) a 200 cow naturally-ventilated barn with stirring fans for air movement and a parabone milking parlor (Farm C), and 4) a 400 cow naturally-ventilated barn with stirring fans for air movement and a parallel milking parlor (Farm D).

Electricity use was monitored from July 2018 to December 2018 with a goal of collecting two years of total energy usage. Two-hundred ninety-two  electric loads across the four farms were monitored on the farm side of the electric utility meter to evaluate areas of highest energy usage (Figure 1). Some of the monitored electric loads included freestall barn fans, water heaters, compressors, chillers, manure pumps, and pressure washers. The electric loads were monitored by data loggers (eGauge, Boulder, CO) and electric current sensors at the circuit panels. Electrical use data (kWh) of each load were collected and analyzed on a monthly basis. In addition, monthly inventory of cows on farm, cows milked per day, and milk production was recorded. Bulk tank production records (milk, fat percentage, protein percentage, and somatic cell count) were also recorded.

Figure 1. Data loggers with electric current sensors installed on farm circuit panel boxes.

What have we learned?

Based on preliminary results, fans were the largest electrical load across all four dairy farms. Fan usage during the summer ranged from 36 to 59% of the total electricity measured (Figure 2). Regular maintenance, proper control settings, design, sizing, location, selecting energy efficient fans and motors, and other factors all could influence the efficiency of these ventilation/cooling systems. Farms B, C, and D had greater electricity usage across all months for milk cooling (compressors and chillers) than Farm A. This is likely due to the fact that Farm A does not utilize bulk tanks to store milk, but instead, milk is directly loaded onto bulk milk trucks. Lighting use ranged from 7 to 21% of the total electricity use measured across the four farms, which suggests there is potential to reduce energy usage by upgrading to more efficient lighting systems such as LEDs. For heating, energy usage includes water heating, heating units in the milking parlor or work rooms, waterer heating elements, and generator engine block heaters. Average monthly heating use ranged from 5% of electricity used in Farm A to 32% of electricity used in Farm C.

Figure 2. The average monthly electrical use measured by data loggers and the percent used by each electrical load category. The average monthly total electricity in kWh is displayed at the top of each bar.

Future plans

Based on the preliminary analysis, clean energy alternatives and energy-optimized farms will be modeled as clean energy alternatives for Minnesota dairy facilities. An economic analysis will also be conducted on the clean energy alternatives and farms. Potential on-site renewable electric generation may supply some or the entire electric load allowing the buildings to approach net-zero (producing as much energy as is used).

The results of this study provide recent energy usage for farm energy benchmarks, agricultural energy policy, economic evaluations, and further research into dairy farm energy studies. The data will also be useful to producers who are searching for areas for reduced energy usage in their own production systems. Improving the efficiency of electrical components in dairy operations could provide opportunities to improve the carbon footprint of dairy production systems.

Authors

Kirsten Sharpe, Animal Science Graduate Research Assistant, West Central Research and Outreach Center (WCROC), Morris, MN, sharp200@umn.edu

Bradley J. Heins, Associate Professor, Dairy Management, WCROC, Morris, MN

Eric Buchanan, Renewable Energy Scientist, WCROC, Morris, MN

Michael Cotter, Renewable Energy Researcher, WCROC, Morris, MN

Michael Reese, Director of Renewable Energy, WCROC, Morris, MN

Additional information

The West Central Research and Outreach Center (WCROC) has developed a Dairy Energy Efficiency Decision Tool to help provide producers a way to estimate possible energy and costs savings from equipment efficiency upgrades. The tool can be used to evaluate areas of a dairy farm that may provide the best return on investment for energy usage. Furthermore, a guidebook has been developed for Optimizing Energy Systems for Midwest Dairy Production. This guidebook provides additional information about energy usage issues as well as a decision tool. More information may be found at https://wcroc.cfans.umn.edu/energy-dairy

Acknowledgements

The funding for this project was provided by the Minnesota Environment and Natural Resources Trust Fund as recommended by the Legislative-Citizen Commission on Minnesota Resources (LCCMR).

The authors are solely responsible for the content of these proceedings. The technical information does not necessarily reflect the official position of the sponsoring agencies or institutions represented by planning committee members, and inclusion and distribution herein does not constitute an endorsement of views expressed by the same. Printed materials included herein are not refereed publications. Citations should appear as follows. EXAMPLE: Authors. 2019. Title of presentation. Waste to Worth. Minneapolis, MN. April 22-26, 2019. URL of this page. Accessed on: today’s date.