Consumer interest and concern is growing in regards to sustainability of livestock production systems. Demand for reduced carbon emissions within agricultural systems has been growing along with increasing demand for food. Baseline fossil fuel consumption within agricultural systems, including dairy production, is scarce. Therefore, there is a need to discern where and how fossil energy is being used within dairy production systems. Determining baseline energy use is the first step in investigating the demand for a reduced carbon footprint within dairy production systems. The objective of this study was to measure total electricity use and determine specific areas of high energy consumption in commercial dairy barns located in the Upper Midwest of the United States.
What did we do?
Four commercial dairy barns representative of typical Midwest dairy farms and located in west central Minnesota were evaluated in the study. The dairy farms were: 1) a 9,500 cow cross-ventilated barn with a rotary milking parlor (Farm A), 2) a 300 cow naturally-ventilated barn with stirring fans for air movement and 6 automatic milking systems (Farm B), 3) a 200 cow naturally-ventilated barn with stirring fans for air movement and a parabone milking parlor (Farm C), and 4) a 400 cow naturally-ventilated barn with stirring fans for air movement and a parallel milking parlor (Farm D).
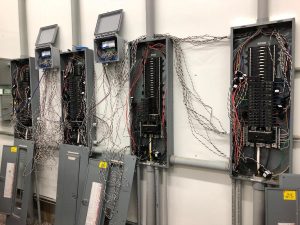
Electricity use was monitored from July 2018 to December 2018 with a goal of collecting two years of total energy usage. Two-hundred ninety-two electric loads across the four farms were monitored on the farm side of the electric utility meter to evaluate areas of highest energy usage (Figure 1). Some of the monitored electric loads included freestall barn fans, water heaters, compressors, chillers, manure pumps, and pressure washers. The electric loads were monitored by data loggers (eGauge, Boulder, CO) and electric current sensors at the circuit panels. Electrical use data (kWh) of each load were collected and analyzed on a monthly basis. In addition, monthly inventory of cows on farm, cows milked per day, and milk production was recorded. Bulk tank production records (milk, fat percentage, protein percentage, and somatic cell count) were also recorded.

What have we learned?
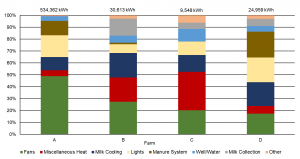
Based on preliminary results, fans were the largest electrical load across all four dairy farms. Fan usage during the summer ranged from 36 to 59% of the total electricity measured (Figure 2). Regular maintenance, proper control settings, design, sizing, location, selecting energy efficient fans and motors, and other factors all could influence the efficiency of these ventilation/cooling systems. Farms B, C, and D had greater electricity usage across all months for milk cooling (compressors and chillers) than Farm A. This is likely due to the fact that Farm A does not utilize bulk tanks to store milk, but instead, milk is directly loaded onto bulk milk trucks. Lighting use ranged from 7 to 21% of the total electricity use measured across the four farms, which suggests there is potential to reduce energy usage by upgrading to more efficient lighting systems such as LEDs. For heating, energy usage includes water heating, heating units in the milking parlor or work rooms, waterer heating elements, and generator engine block heaters. Average monthly heating use ranged from 5% of electricity used in Farm A to 32% of electricity used in Farm C.

Future plans
Based on the preliminary analysis, clean energy alternatives and energy-optimized farms will be modeled as clean energy alternatives for Minnesota dairy facilities. An economic analysis will also be conducted on the clean energy alternatives and farms. Potential on-site renewable electric generation may supply some or the entire electric load allowing the buildings to approach net-zero (producing as much energy as is used).
The results of this study provide recent energy usage for farm energy benchmarks, agricultural energy policy, economic evaluations, and further research into dairy farm energy studies. The data will also be useful to producers who are searching for areas for reduced energy usage in their own production systems. Improving the efficiency of electrical components in dairy operations could provide opportunities to improve the carbon footprint of dairy production systems.
Authors
Kirsten Sharpe, Animal Science Graduate Research Assistant, West Central Research and Outreach Center (WCROC), Morris, MN, sharp200@umn.edu
Bradley J. Heins, Associate Professor, Dairy Management, WCROC, Morris, MN
Eric Buchanan, Renewable Energy Scientist, WCROC, Morris, MN
Michael Cotter, Renewable Energy Researcher, WCROC, Morris, MN
Michael Reese, Director of Renewable Energy, WCROC, Morris, MN
Additional information
The West Central Research and Outreach Center (WCROC) has developed a Dairy Energy Efficiency Decision Tool to help provide producers a way to estimate possible energy and costs savings from equipment efficiency upgrades. The tool can be used to evaluate areas of a dairy farm that may provide the best return on investment for energy usage. Furthermore, a guidebook has been developed for Optimizing Energy Systems for Midwest Dairy Production. This guidebook provides additional information about energy usage issues as well as a decision tool. More information may be found at https://wcroc.cfans.umn.edu/energy-dairy
Acknowledgements
The funding for this project was provided by the Minnesota Environment and Natural Resources Trust Fund as recommended by the Legislative-Citizen Commission on Minnesota Resources (LCCMR).
The authors are solely responsible for the content of these proceedings. The technical information does not necessarily reflect the official position of the sponsoring agencies or institutions represented by planning committee members, and inclusion and distribution herein does not constitute an endorsement of views expressed by the same. Printed materials included herein are not refereed publications. Citations should appear as follows. EXAMPLE: Authors. 2019. Title of presentation. Waste to Worth. Minneapolis, MN. April 22-26, 2019. URL of this page. Accessed on: today’s date.

