Why Compare Liquid and Slurry Systems for Pig Production?
Since 2000 the cost of fertilizer has more than doubled. According to information provided by the USDA Economic Research Service (2013), the national average price per pound of N has increased between 2000 and 2012 by a factor of 2.6. Over the same time period, phosphate price increased by a factor of 2.8, and potassium price increased by a factor of 4.0. As a result, fertilizer costs now contribute 30% to 40% of the annual variable costs to grow many cereal grains. During the same time period environmental regulations have greatly decreased the construction of swine finishing facilities that use liquid manure handling systems that require the use of a lagoon or storage pond. In response to these economic and regulatory realities, some swine production companies are considering the use of deep pit slurry systems instead of an outdoor lagoon or storage. Benefits of the deep pit slurry system include the exclusion of rainfall, reduction in storage visibility, and conservation of valuable major plant nutrients (N, P, K) for the purpose of reducing production costs for feed grains. The objective of this presentation is to compare the fertilizer value of the manure produced from swine finishing barns that use a liquid manure handling with a treatment lagoon, and swine finishing barns that store manure below slotted floors in pits.
What did we do?
Plant nutrient content and volume data were collected from a swine finishing farm that used a lagoon treatment system. The system was designed to provide storage of manure, anaerobic treatment of volatile solids, and storage for sludge for 3520 pigs. Treated lagoon surface water (total solids = 0.5%) was recycled through the four buildings to provide water to remove manure from the building using a pull-plug, pit-recharge design. Lagoon surface water was applied to nearby cropland annually to provide all major plant nutrients using traveling gun irrigation. Data were also collected concerning the plant nutrient content of lagoon sludge, and sludge volumes were estimated using the ASABE Standard (2011).
The realized value of swine manure was calculated for using lagoon water, and sludge to provide all or a portion of the N, P2O5, K2O used by corn based on typical crop needs. Only the portion of plant nutrients that met the recommendations was assigned value. No value was assigned to major plant nutrients applied in excess of plant uptake. The value was assigned based on price data obtained from USDA-ERS (2013). The prices used were $0.71/lb of N, $0.69/lb of P2O5, and $0.50/lb of K2O.
Two application rates were calculated for lagoon water. The first rate was to provide the N needs for corn and the second was to provide the P2O5 needs of the crop. The pounds of N, P2O5, and K2O applied per acre were determined and the value of the nutrients that met the fertilization rates was calculated.
Lagoon sludge (total solids = 10%) contained 4 times as much P2O5 as plant available N (PAN) per 1000 gallons (47.3 lb P2O5/1,000 gal vs 11.7 lb PAN/1,000 gal). Therefore, the only sludge application rate used was the rate needed to meet the fertilizer recommendation for P2O5. The realized value of the sludge was determined in the same way as for lagoon water.
When lagoon water was applied to supply the N needs of one field, and sludge was applied to meet the P2O5 needs of another field the realized value of swine manure was $5.69 per hog-space per year. Application of lagoon water and sludge to meet the P2O5 needs of corn increased the annual value of manure to $6.64 per hog-space.
The analysis was repeated for the same size farm using volume and nutrient data for deep pit barns that provided 1 year of storage for swine slurry (total solids = 7.5%). The realized economic value of deep pit slurry was also calculated based on application of slurry, using direct injection, to meet the N and P2O5 needs of corn with the same price assumptions as for the lagoon system. The results indicated that spreading deep pit slurry based on the agronomic rate for N provided a realized manure value of $24.35/hog-space/yr. Application of slurry based on the agronomic rate for P2O5 yielded a manure value of $28.95/hog-space/year.
What have we learned?
Treatment lagoons were originally designed to provide treated water used to remove manure from flush or pit-recharge swine buildings. However, little consideration was given to the value of the N lost or the value of P and K. Essentially, lagoons provided the treatment needed for recycled flush or pit-recharge systems, but they wasted nitrogen that could be used to off-set fertilizer costs.
Over the last decade, fertilizer prices have increased greatly, and continue to fluctuate. As a result, the nutrients lost by manure treatment are now viewed as a valuable input for production of feed grains.
Using a deep pit barn eliminated the need for manure treatment and allowed plant nutrients to be stored until needed. It was estimated that a deep pit slurry system would allow a producer to increase nutrient value per hog-space by a factor of 4.3 from $6.68 to $28.95/hog-space per year. On a 4-house farm that provided housing for 3520 hogs the annual manure value may be as high as $101,920 per year.
Future Plans
The results from this study are being used to develop extension programs for swine producers. Information is being used to help plan farms and to encourage integration of swine and feed grain production.
Author
John P. Chastain, Ph.D., Professor and Extension Agricultural Engineer, Clemson University jchstn@clemson.edu
Additional information
Reference Cited
ASABE (2011). ANSI/ASAE EP403.4 FEB2011 Design of Anaerobic Lagooons for Animal Waste Management. In ASABE STANDARDS. ASABE, 2950 Niles Rd., St. Joseph, MI 49085-9659.
Support for this work was provided by the Confined Animal Manure Management Program of Clemson Extension, Clemson University, Clemson, SC.
The authors are solely responsible for the content of these proceedings. The technical information does not necessarily reflect the official position of the sponsoring agencies or institutions represented by planning committee members, and inclusion and distribution herein does not constitute an endorsement of views expressed by the same. Printed materials included herein are not refereed publications. Citations should appear as follows. EXAMPLE: Authors. 2015. Title of presentation. Waste to Worth: Spreading Science and Solutions. Seattle, WA. March 31-April 3, 2015. URL of this page. Accessed on: today’s date.
Dr. Charles Maxwell, Dr. Jennie Popp, and Dr. Richard Ulrich – University of Arkansas; Dr. Scott Radcliffe – Purdue University, and Dr. Mark Hanigan – Virginia Tech
Why study crude protein and carbon footprint?
Maximizing feed grade amino acid (FGAA) use and reducing dietary crude protein in swine diets has been shown to dramatically reduce nitrogen excretion in both nursery and growing/finishing swine which could substantially reduce nitrous oxide (N2O) emissions associated with manure management in swine production. The global warming potential of N2O is about 298 times that of CO2 (carbon dioxide). Reducing the crude protein (CP) content of grower and finisher diets has also been repeatedly shown to enhance carcass quality by elevating intramuscular fat. While some crystalline amino acids are already commonly used in pork production the maximum level of CP reduction, in conjunction with the optimum amino acid inclusion rate, has not been sufficiently determined for widespread acceptance by the swine industry.
Project Objectives:
Hypothesis: Reducing dietary CP while maintaining amino acids (AA) at equivalent Standardized Ileal Digestibility (SID) ratios by supplementing feed grade AA will reduce nitrogen (N) excretion and greenhouse gas (GHG) emissions (N2O from manure) without impacting swine performance or carcass yield.
Determine the practical limits of reducing CP in diets of nursery and finishing pigs.
Validate the effectiveness of reduced dietary nitrogen as a mitigation strategy for greenhouse gases.
Provide data for validation of animal physiology model capable of predicting swine performance and relevant manure characteristics (quantity and composition for Manure DNDC).
Compare ME vs. NE formulation strategies on lean tissue deposition and fat accretion.
Determine the impact of dietary amino acid levels on signaling in regulation of tissue growth.
[2014 & 2015 annual reports indicated another objective was added] Estimate manure reductions in N excretion via a N balance trial.
Studies were conducted at multiple sites. One was the University of Arkansas wean-to-finish facilities and the second at the Purdue Swine Environmental Research Building (SERB). See the videos above for more on these facilities). The data generated was utilized in modelling work at Virginia Tech. The model was ultimately incorporated into the Swine Environmental Footprint Calculator.
Nursery Studies
What Did We Do? (Methods or Experimental Design)
Experiment 1
To evaluate maximum replacement of CP with FGAA, 320 weaned pigs were allotted to gender-balanced pens in a wean-to-finish facility (8 pigs/pen). Within blocks, pens were randomly assigned to 1 of 5 dietary treatments. Diets were formulated to maintain constant ME and SID Lys across treatments with SID Lys set at 95% requirement (PIC Nutrient Specification Manual, 2011). Diets were formulated to meet the SID AA ratio recommendations for other indispensable AA (SID) for nursery pigs through the 6th limiting AA (PIC Nutrient Specifications Manual, 2011). For each phase, Ctrl diets were devoid of FGAA, whereas Lys HCl was added in equal increments at the expense of CP (SBM, fish meal [FM], and poultry meal [PM] in phase 1, FM and PM in phase 2, and SBM in phase 3). This formulation procedure resulted in diets that were below the His and Phe/Tyr SID requirement for the highest level of CP reduction. CP and Lys inclusion levels were analyzed. Experiment 2
A second three phase nursery study was conducted with pigs weaned at 21 d to further evaluate limits of CP reduction in nursery diets and compare performance in pigs fed diets based on formulation on an ME vs. NE basis. The study involved 7 pigs/pen and 7 replicates/treatment. Dietary ingredients were similar to those used in experiment 1, except soy protein concentrate was used to replace fish meal. Dietary treatments were: 1), Control diet formulated on an ME basis and with FGAA used to meet the “Trp Set Point” without adding feed grade Trp in phase 1 and 2 and 0.02 % added Trp in phase 3; 2) Diet formulated on an ME basis and to meet the “His Set Point” without added feed grade His; 3) As 2 with diets formulated on a NE basis.
Nursery What Did We Learn (Results)?
Experiment 1
Pigs fed RCP 1, RCP 2, and RCP 3 diets in phase 1, 2 and 3, and for the overall study had similar ADG and BW but growth performance declined for pigs fed RCP 4 diets (Table 5; Quadratic effect, P < 0.01). A similar response was observed in ADFI in all time periods except phase 1 where ADFI was similar among treatments. In phase 1, G:F ratio followed a similar response (Quadratic effect, P < 0.01), but decreased linearly in phase 2 (P < 0.08), 3, and overall (P < 0.01). It should be noted that the RCP 4 diet was below requirement for SID His:Lys and Phe/Tyr:Lys which might explain the decrease in performance. The results of this study establishes that a high inclusion of feed grade Lys at the expense of intact proteins can be fed without decreasing ADG and ADFI except at the highest level of FGAA where the requirement for all IDAA was not met. However, G:F was generally reduced at the higher inclusion rates of FGAA, particularly in phase 3. Experiment 2
No differences were observed in ADG, ADFI, or G:F (Table 6) in any phase or overall in pigs fed diets formulated on an aggressive FGAA inclusion (His Set Point) based on ME (Trt.2) or NE (Trt. 3) compared to pigs fed AA inclusion levels currently used in swine industry (Trt. 1). These results indicate that in nursery pigs, one should be able to use a His Set Point in formulating AA based diets without concern for pig performance.
The previous nursery experiment (Experiment 1; Bass et al., 2013) conducted to evaluate feeding reduced CP diet with the highest levels of FGAA to nursery pigs resulted in poor growth performance, especially G:F ratio in phase 3 and the overall nursery period. In the previous study, experimental diets were formulated to meet the 95% of SID Lys requirement for nursery pigs. Also, RCP 4, which was formulated with the highest level of FGAA, did not meet the His and Phe requirement Lys/NE.
Conclusion
In conclusion, unlike the previous study, growth performance of nursery pigs was not affected by the higher level of FGAA and lower dietary CP. This may be due to different SID His:Lys and SID Phe+Tyr:Lys ratios used in diet formulation or different protein source used in each study. In the second nursery study, all diets were formulated based on 100 % or excess of SID Lys requirement for nursery pigs, and were formulated to meet the His and Phe+Tyr requirement. In addition, soy protein concentrate (SPC) was used in the second study during phase 1 and 2, replacing menhaden fish meal used in nursery study one.
Publications
2013 Midwest American Society of Animal Science (ASAS) meeting (Experiment 1) Abstract P042, page 102
Grow-Finish Studies
What Did We Do? (Methods)
Each experiment was conducted following a five phase grow-finish protocol. Pigs were fed 1 of 4 or 5 diets and 10 ppm of Paylean was fed during the final 3-week finishing phase-Phase 5. During phase 1 through 5, individual pig BW, and pen feed disappearance were measured over each phase to allow calculation of ADG, ADFI and G:F by phase. Tenth rib, ¾ midline back fat measurements and loin muscle area were estimated at study initiation and at the end of each phase via ultrasound to allow estimation of carcass lean gain. When the average of all blocks was 129-134 kg all pigs were individually weighed, tattooed, transported to, and harvested at a commercial pork packing plant according to industry accepted procedures. Longissimus muscle (LM) and fat depths at the 10th rib were measured on-line with a Fat-O-Meater probe and individual hot carcass weight was recorded. Experiment 1
A total of 420 pigs were blocked within gender and randomly allotted to pens with 6 pigs/pen. Within blocks, pens of pigs were randomly assigned to 1 of 5 dietary treatments (7 reps/treatment/gender). Diets were formulated by incrementally increasing levels of Lys with corresponding reductions in CP. Pigs were randomly allotted to the following diets:
Ctrl: Corn-SBM-DDGS diets devoid of FGAA,
RCP 1 (reduced crude protein 1)
RCP 2
RCP3
RCP 4 – was balanced on the requirement of the 7th limiting AA, His (PIC Nutrient Specifications Manual, 2011) which was considered the practical limit of the highest level of RCP because of availability constraints.
RCP 1 to 4 were then formulated to have stepwise and equally spaced increased Lys with corresponding reductions in CP between RCP 1 and 4. Diets 2-4 were supplemented with FGAA as needed to meet AA needs based on AA minimum ratios. Dietary CP and Lys inclusion levels were analyzed.
Diets were formulated to 95% of the average SID Lys requirement for barrows and gilts (PIC Nutrient Specifications Manual, 2011), and exceeded the SID AA/Lys ratio recommendations for other IDAA by 2 percentage points.
Distillers dried grains with solubles (DDGS) were included in all diets at the 20% level, with the exception of phase-5 finishing diets which was devoid of DDGS. Experiment 2
In experiment 1, diets were formulated on an ME basis and as soybean meal was reduced in diets, the calculated Lys/NE decreased which may explain some of the increase in fat deposition in pigs fed ME based diets formulated by decreasing soybean meal and including high levels of FGAA. Therefore, experiment 2 was conducted to establish the efficacy of using a “Set Point SID requirement” of sequentially reducing CP by adding FGAA to meet the SID IDAA/Lys ratio as a means of establishing the practical limits of CP reduction and AA replacement without impacting growth performance, carcass composition or quality in growing and finishing pigs fed NE based RCP diets. Diets were formulated starting with a Ctrl diet that approximates acceptable inclusion levels of FGAA currently used in industry, followed by sequentially formulating three additional dietary treatments, each based on the next limiting AA. Diets in this study were formulated on a constant NE basis within phase. DDGS was included in all diets. The SID His requirement in the highest RCP diet was met in each phase without added feed grade His.
There were a total of 9 replicates/treatment with pigs housed 6 pigs/pen. Sex within pen was balanced. Diets were formulated as in experiment 1 which were:
Treatment 1, Ctrl: Conventional phase 1 through 5 diets that approximates acceptable levels of FGAA currently used in industry. The assumption is that most in the industry are comfortable utilizing feed grade Thr and Met to meet the suggested SID Thr/Lys and Met/Lys ratio in diets formulated to meet the SID Trp/Lys requirement without added feed grade Trp. This is referred to as the Trp Set Point.
Treatment 2, RCP 1: Diets were formulated to meet the next limiting AA. In phase 1 and 5, the next limiting AA was Val while Ile was next limiting in phases 2, 3 and 4. This is referred to as the “Val or Ile Set Point”. Note that neither feed grade Val nor Ile were added in any phase.
Treatment 3, RCP 2: Diets were formulated to meet the next limiting AA. In phase 1 and 5, the next limiting AA was Ile while Val was next limiting in phases 2, 3 and 4. This is referred to as the “Val and Ile Set Point”. Note that feed grade Val but not Ile was added in phases 1 and 5, and Ile but not Val was added in phase 2, 3, and 4.
Treatment 4, RCP 3: Diets were formulated to meet the next (7th) limiting AA, His. This is referred to as the “His Set Point”.
All diets were supplemented with FGAA to meet IDAA recommended levels. Note that feed grade His was not added to any diet.
Grow-Finish Studies – What Did We Learn?
Experiment 1
Body weights of pigs decreased linearly with decreasing dietary CP during phase 1, 2, and 3 (P < 0.01; Table 7). Additionally, BW increased and then decreased quadratically during phase 3 (P = 0.09), 4 (P < 0.04), and 5 (P < 0.01) with BW decreasing significantly in pigs fed RCP 4. When Paylean was included in the Phase 5 diets, barrows fed the Ctrl diet had greater ADG than Ctrl-fed gilts, but RCP 1-, RCP 2-, and RCP 3-fed gilts had greater ADG than their castrated male counterparts (Quadratic gender × reduced CP diet, P = 0.08; Figure 1A) Both ADG and G:F decreased linearly (P ≤ 0.06) during phase 1 and 2. Furthermore, gain efficiency increased 4.6 % in gilts between Ctrl and RCP 2 before decreasing to similar G:F values between Ctrl and RCP 4; however, G:F remained relatively unchanged in barrows across the 5 dietary treatments (Quadratic gender × reduced CP diet, P = 0.04; Figure 1B).
Across the entire feeding trial, ADG increased only 2 % between Ctrl and RCP3, but dropped 6 % between RCP3 and RCP4 (Quadratic, P < 0.01). On the other hand, ADFI tended to decreased linearly (P = 0.09) as CP was reduced in swine diets. Gain efficiency increased 4.6 % in gilts between Ctrl and RCP2 before decreasing to similar values between Ctrl and RCP4; however, G:F remained relatively unchanged in barrows across the 5 dietary treatments (Quadratic gender × reduced CP diet, P = 0.04; Figure 1C).
Reducing dietary CP and optimizing the use of FGAA had limited (P ≥ 0.21) effects on HCW, dressing percentage, or LM depth; however, 10th rib fat depth increased linearly (P < 0.01), and fat free lean percentage at study termination decreased linearly as CP was reduced in swine diets (P < 0.02; Figure 1D). Experiment 2
Effects of dietary treatment (Trt.) indicated that ADG decreased linearly with increasing dietary FGAA in phase 3 (Table 8, P < 0.05), 4 (P < 0.10), 5 (P < 0.01) and overall (P < 0.01). Similarly, ADFI decreased linearly in phase 4 (P < 0.05), 5 (P < 0.01) and overall (P < 0.01) with increasing FGAA. Compared to pigs fed the control diet (Trt. 1), G:F in phase 1 increased in pigs fed increasing levels of FGAA at the lower inclusion rates (Trt. 2 and 3) before decreasing to the control level at the highest level of inclusion (Trt. 4, Quadratic effect, P < 0.05). During phase 3, a small, but significant, decrease in G:F was observed with increasing levels of FGAA (Linear effect, P < 0.05). For the overall study, however, a trend for increased G:F was observed (Linear effect, P < 0.06). BW increased at the end of phase 2 with increasing level of FGAA (Quadratic effect, P < 0.06). However, consistent with ADG, BW decreased with increasing dietary FGAA at the end of phase 3, 4 and 5 (Linear effect, P < 0.05, P < 0.01 and P < 0.01, respectively).
As might be expected based on BW, HCW decreased with increasing inclusion of dietary FGAA (Linear effect, P < 0.01). Tenth rib backfat was lower in pigs fed diets formulated to the Val or Ile Set Point (Trt. 2) or the His Set Point (Trt. 4) when compared to those fed diets formulated to the Val and Ile Set Point (Trt. 3).
Publications – G/F (Trial 1)
2013 Midwest American Society of Animal Science (ASAS) meeting Abstract 0224, page 73 (performance and carcass composition)
2013 Midwest American Society of Animal Science (ASAS) meeting Abstract P027, page 97 (LM – longissimus muscle quality)
Significance. This information is timely since the cost of soybean meal is approaching record levels which make substitution of synthetic amino acids for intact protein more economically feasible.
Nitrogen (N) Balance Study
What Did We Do? (Methods)
Thirty-two barrows were used to evaluate the effect of feeding reduced CP, AA supplemented diets, on nutrient and VFA excretion. Pigs were randomly allotted to the following diets:
Control: Corn-SBM-DDGS diets with no FGAA,
1X reduction in CP,
2X reduction in CP, and
3X reduction in CP. This diet was balanced on the 7th limiting AA in each phase.
Diets 2 and 3 were formulated to have stepwise and equally spaced reductions in CP between diets 1 and 4. Diets 2-4 were supplemented with FGAA as needed to meet AA needs based on NRC 2012 AA minimum ratios. Four nursery phases and 5 grow-finish phases (21d phases) were fed. Pigs were housed in stainless-steel metabolism pens equipped with a nipple waterer and stainless steel feeder. Collections started with nursery phase 3 and during nursery phases pigs were allowed an eight day adjustment period to the diets followed by a 3 d total collection of feces, urine, and orts. During the grow-finish phases, pigs were acclimated to diets for the first 10 d of each phase, and then feces, urine, and orts were collected for 3 days.
Nitrogen Balance – What Did We Learn? (Results)
Overall, from d 14-147 post-weaning ADFI was linearly increased as dietary CP was reduced, but no effect of dietary CP concentration on ADG or G:F (Table 9) was observed. Fecal excretion (DM) tended to respond in a quadratic (P = 0.08) fashion with decreasing fecal excretion (DM) up to 2X reduction in CP, but then increasing in 3X fed pigs. Both DE and ME (kcal/kg) were linearly (P < 0.01) reduced as dietary CP was reduced. The linear (P < 0.01) decrease in N intake for pigs fed reduced CP diets was accompanied by linear (P < 0.01) decreases in both urinary and total N excreted. Nitrogen digestibility (%) linearly decreased (P < 0.01) and N retention linearly (%) increased (P < 0.01) with reductions in dietary CP. Overall, there was a linear (P < 0.03) reduction in fecal ammonium as dietary CP was reduced. Total carbon (C) intake and total fecal C excreted tended (P = 0.06) to respond quadratically with an increase in both C intake and C excretion up to the 1X reduced CP diets, followed by a decrease in C intake and increasing C excretion to the 3X diet creating a linear (P < 0.05) decrease in C digestibility as dietary CP was reduced.
Significance. The ability to add total fecal and urine collections of the nitrogen manipulation diets across all body weights tested at the University of Arkansas before the diets were tested for greenhouse gas emissions at Purdue University improved the estimation of compounds excreted in fresh manure and then the conversion of these excreted nutrients and compounds during storage in typical deep pit manure structures under the swine facilities (as were measured during the Purdue 12 room study). This research project provided data for a critical link between excretion, storage, and land application.
Validating the Nursery, Grow-Finish, and GHG Measurement Studies
Large-scale trials are in progress to validate the nursery and grow-finish trials done at Arkansas. The Purdue facility is scaled more similarly to a commercial production system. Gas measurement and monitoring, and separate manure handling systems for each room allowed direct measurements with which to compare previous estimations.
Treatment structure for the experiment was:
Conventional diet containing ~ 0.15% Lys-HCl
1X reduction in CP with additional synthetic amino acids
2X reduction in CP with additional synthetic amino acids
All diets were supplemented with Ractopamine during the final 3-4 weeks of the trial, and amino acid concentrations were increased based on estimated increases in lean tissue accretion. However, the overall treatment structure will remain the same. The Experiment involved 24 pens of 10 pigs each per treatment, with 8 manure pits/trt, and 4 rooms per trt. Pen was the experimental unit for all growth performance, feed intake, and carcass data. Pit was the experimental unit for manure excretion data and room is the experimental unit for emission data.
Real-time monitoring of air temperatures included relative humidity, carbon dioxide (CO2), methane (CH4), nitrous oxide (N2O), ammonia (NH3), and hydrogen sulfide (H2S). Total suspended particulates were monitored using gravimetric samplers. The emission and animal performance data were significantly more accurate in this replicated, environmentally-controlled building than is possible commercially, yet still simulate commercial conditions.
Manure from each pit was completely removed to outside storage for volume determination, thorough agitation and sampling at the end of each trial. In addition, core manure samples based on a grid system were obtained at the end of each growth phase. Manure volume in each pit was determined at diet phase changes by taking 6 gridded depth measurements between the slatted floor. Manure samples were analyzed for pH, dry matter, ash, total nitrogen (N), ammonium N, phosphorus (P), carbon (C), and sulfur (S). Data defining the relationship between the reduction in dietary CP with a reduction in manure N and other changes in manure characteristics are essential to model development of the impact of this mitigation strategy on GHG emissions. An additional benefit will be defining the limits of this strategy without impacting animal growth performance under conditions where industry stakeholders have input.
Validation study – What did we learn (results)?
Coming Soon! (first half 2016)
Modeling the Data
[See also: Virginia Tech modeling efforts] Current nutritional requirement models for swine are focused on partitioning of dietary energy and amino acids to maintenance, growth, gestation, and lactation. Little focus is placed on predicting nutrient excretion, and thus these models cannot be used to provide inputs to an emissions model. Models that predict excretion of energy, protein, and phosphorus have been developed, but have not been evaluated for the accuracy of predictions; and evaluations that have been undertaken focus on predictions of growth and body composition, not nutrient excretion.
GHG emissions from manure storage facilities can be predicted from manure composition, underscoring the need for a robust animal model capable of predicting both animal performance and nutrient excretion. Prediction of GHG emissions from swine manure requires knowledge of N and volatile solids content, neither of which are provided by current NRC predictions.
Data from the nitrogen mitigation growth and nitrogen excretion studies were utilized in enhancement of an animal model capable of predicting swine performance and excretion of nitrogen, carbon, and volatile solids (inputs required by the DNDC model). The growth model developed by the workers at UC-Davis and the recently released Nutrient Requirements of Swine (NRC) eleventh revised edition will be used as a starting point for model development. Equations describing the response to dietary protein and amino acid additions will be evaluated for accuracy, and the effects of Paylean on animal performance and manure nutrient output will be encoded and tested for accuracy. This work is scheduled to precede and utilize data from the UA trial and literature sources. The model will be further evaluated in the 5th year using the Purdue data set.
To provide the best experiences, we use technologies like cookies to store and/or access device information. Consenting to these technologies will allow us to process data such as browsing behavior or unique IDs on this site. Not consenting or withdrawing consent, may adversely affect certain features and functions.
Functional
Always active
The technical storage or access is strictly necessary for the legitimate purpose of enabling the use of a specific service explicitly requested by the subscriber or user, or for the sole purpose of carrying out the transmission of a communication over an electronic communications network.
Preferences
The technical storage or access is necessary for the legitimate purpose of storing preferences that are not requested by the subscriber or user.
Statistics
The technical storage or access that is used exclusively for statistical purposes.The technical storage or access that is used exclusively for anonymous statistical purposes. Without a subpoena, voluntary compliance on the part of your Internet Service Provider, or additional records from a third party, information stored or retrieved for this purpose alone cannot usually be used to identify you.
Marketing
The technical storage or access is required to create user profiles to send advertising, or to track the user on a website or across several websites for similar marketing purposes.

 During the same time period environmental regulations have greatly decreased the construction of swine finishing facilities that use liquid manure handling systems that require the use of a lagoon or storage pond. In response to these economic and regulatory realities, some swine production companies are considering the use of deep pit slurry systems instead of an outdoor lagoon or storage. Benefits of the deep pit slurry system include the exclusion of rainfall, reduction in storage visibility, and conservation of valuable major plant nutrients (N, P, K) for the purpose of reducing production costs for feed grains. The objective of this presentation is to compare the fertilizer value of the manure produced from swine finishing barns that use a liquid manure handling with a treatment lagoon, and swine finishing barns that store manure below slotted floors in pits.
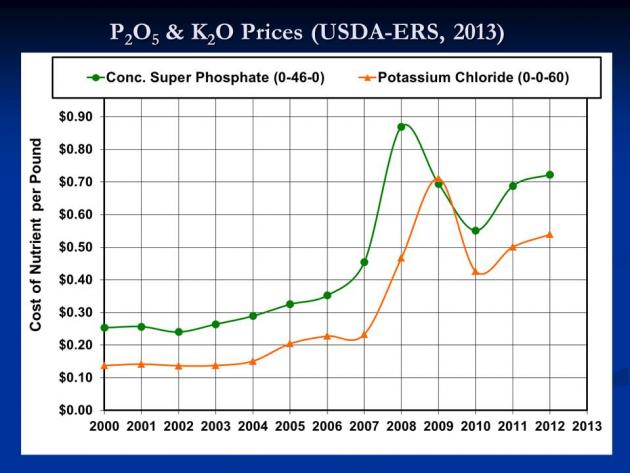 What did we do?
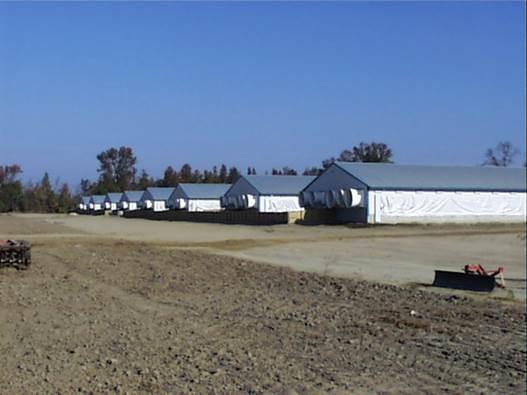 The realized value of swine manure was calculated for using lagoon water, and sludge to provide all or a portion of the N, P2O5, K2O used by corn based on typical crop needs. Only the portion of plant nutrients that met the recommendations was assigned value. No value was assigned to major plant nutrients applied in excess of plant uptake. The value was assigned based on price data obtained from USDA-ERS (2013). The prices used were $0.71/lb of N, $0.69/lb of P2O5, and $0.50/lb of K2O.
 When lagoon water was applied to supply the N needs of one field, and sludge was applied to meet the P2O5 needs of another field the realized value of swine manure was $5.69 per hog-space per year. Application of lagoon water and sludge to meet the P2O5 needs of corn increased the annual value of manure to $6.64 per hog-space.
 Maximizing feed grade amino acid (FGAA) use and reducing dietary crude protein in swine diets has been shown to dramatically reduce nitrogen excretion in both nursery and growing/finishing swine which could substantially reduce nitrous oxide (N