Proceedings Home | W2W Home 
Purpose
The objective of this study was to conduct cost versus design analysis for a gas-permeable membrane system using data from a small pilot scale experiment and projection of cost versus design to farm scale.
What did we do?
This reported work includes two major steps. First, the design of a small pilot scale batch gas-permeable membrane system was scaled to process effluent volumes from a commercial pig farm. The scaling design maintained critical process operating parameters of the experimental membrane system and introduced assumed features to characterize effluent flows from a working pig farm with an anaerobic digester. The scaled up design was characterized in a spreadsheet model. The second step was economic analysis of the scaled-up model of the membrane system. The objective of the economic analysis was to create information to guide subsequent experiments towards commercial development of the technology. The economic analysis was performed by introducing market prices for components, inputs, and products and then calculating effects on costs and on performance of changes in design parameters.
What have we learned?
First, baseline costs and revenues were calculated for the scaled up experimental design. The commercial scale design of a modular gas-permeable membrane system was modeled to treat 6 days accumulation of digester effluent at 16,300 gallons per day resulting in a batch capacity of 97,800 gallons. The modeled large scale system is 19,485 times the capacity of the 5.02 gallon experimental pilot system. The installation cost of the commercial scale system was estimated to be $903,333 for a system treating 97,800 gallon batches over a 6 day period.
At $1/linear ft. and 7.9 ft./gallon of batch capacity, membrane material makes up 86% of the estimated installation cost. Other installation costs include PVC pipes, pumps, aerators, tanks, and other parts and equipment used to assemble the system, as well as water to dilute the concentrated acid prior to initiating circulation. The annual operating cost of the system includes concentrated sulfuric acid consumed in the process. Using limited experimental data on this point, we assume a rate of 0.009 gallons (0.133 pounds) of acid per gallon of digester effluent treated. At a price of $1.11 per gallon ($0.073/lb) of acid, acid cost per gallon of effluent treated is $0.010. Other operating costs include electric power, labor, and repairs and maintenance of the membrane and other parts of the system estimated at 2% of investment cost for non-moving parts and 6% of investment for moving parts. Potential annual revenue from the system includes the value of ammonium sulfate produced. Over the 6 day treatment period, if 85% of the TAN-N in the digester effluent is removed by the process, and if 100% of the TAN-N removed is recovered as ammonium sulfate, and given the TAN-N concentration in digester effluent was 0.012 pounds per gallon (1401 mg/l), then 0.01 pounds of TAN-N are captured per gallon of effluent treated. At an ammonium sulfate fertilizer price of $588/ton or $0.294/pound and ammonium sulfate production of 0.047 pounds (0.01 pounds TAN-N equivalent), potential revenue is $0.014 per gallon of effluent treated. No price is attached here for the elimination of internal and external costs associated with potential release to the environment of 0.01 pounds TAN-N per gallon of digester effluent or 59,073 pounds TAN-N per year from the system modeled here.
Several findings and questions, reported here, are relevant to next steps in experimental evaluation and commercial development of this technology.
1. Membrane price and/or performance can be improved to substantially reduce installation cost. Membrane material makes up 86% of the current estimated installation cost. Each 10% reduction in the product of membrane price and length of membrane tube required per gallon capacity reduces estimated installation cost per gallon capacity by 8.6%.
2. The longevity and maintenance requirements of the membrane in this system were not examined in the experiment. Installation cost recovery per gallon of effluent decreases at a declining rate with longevity. For example, Cost Recovery Factors (percentage of initial investment charged as an annual cost) at 6% annual interest rate vary with economic life of the investment as follows: 1 year life CRF = 106%, 5 year life CRF = 24%, 10 year life CRF = 14% . Repair costs are often estimated as 2% of initial investment in non-moving parts. In the case of the membrane, annual repair and maintenance costs may increase with increased longevity. Longevity and maintenance requirements of membranes are important factors in determining total cost per gallon treated.
3. Based on experimental performance data (TAN removal in Table 1) and projected installation cost for various design treatment periods ( HRT = 2, 3, 4, 5, or 6 days), installation cost per unit mass of TAN removal decreases and then increases with the length of treatment period. The minimum occurs at HRT = 4 days when 68% reduction of TAN-N in the effluent has been achieved.

4. Cost of acid relative to TAN removal from the effluent and relative to fertilizer value of ammonium sulfate produced per gallon of effluent treated are important to operating cost of the membrane system. These coefficients were beyond the scope of the experiment although some pertinent data were generated. Questions are raised about the fate of acid in circulation. What fraction of acid remains in circulation after a batch is completed? What fraction of acid reacts with other constituents of the effluent to create other products in the circulating acid solution? What fraction of acid escapes through the membrane into the effluent? Increased efficiency of TAN removal from the effluent per unit of acid consumed will reduce the cost per unit TAN removed. Increased efficiency of converting acid to ammonium sulfate will reduce the net cost of acid per gallon treated.
5. Several operating parameters that remain to be explored affect costs and revenues per unit of effluent treated. Among those are parameters that potentially affect TAN movement through the membrane such as: a) pH of the effluent and pH of the acid solution in circulation, b) velocity of liquids on both sides of the membrane, and c) surface area of the membrane per volume of liquids; effluent and acid solution, in the reactor. Similarly, the most profitable or cost effective method of raising pH of the digester effluent remains to be determined, as it was beyond the scope of the current study. Aeration was used in this experiment and in the cost modeling. Aeration may or may not be the optimum method of raising pH and the optimum is contingent on relative prices of alternatives as well as their effect on overall system performance. Optimization of design to maximize profit or minimize cost requires knowledge of these performance response functions and associated cost functions.
6. Management of ammonium sulfate is a question to be addressed in future development of this technology. Questions that arise include: a) how does ammonium sulfate concentration in the acid solution affect rates of TAN removal and additional ammonia sulfate production, b) how can ammonium sulfate be removed from, or further concentrated in, the acid solution, c) can the acid solution containing ammonium sulfate be used without further modification and in which processes, d) what are possible uses for the acid solution after removal of ammonium sulfate, e) what are the possible uses for the effluent after removal of some TAN, and f) what are the costs and revenues associated with each of the alternatives. Answers to these questions are important to designing the membrane system and associated logistics and markets for used acid solution and ammonium sulfate. The realized value of ammonium sulfate and the cost (and revenue) of used acid solution are derived from optimization of this p art of the system.
7. LCA work on various configurations and operating parameters of the membrane system remains to be done. Concurrent with measurement of performance response functions for various parts of the membrane system, LCA work will quantify associated use of resources and emissions to the environment. Revenues may arise where external benefits are created and markets for those benefits exist. Where revenues are not available, marginal costs per unit of emission reduction or resource extraction reduction can be calculated to enable optimization of design across both profit and external factors.
Future Plans
A series of subsequent experiments and analyses are suggested in the previous section. Suggested work is aimed at improving knowledge of performance response to marginal changes in operating parameters and improving knowledge of the performance of various membranes. Profit maximization, cost minimization, and design optimization across both financial and external criteria require knowledge of performance response functions over a substantial number of variables. The economic analysis presented here addresses the challenge of projecting commercial scale costs and returns with data from an early stage experimental small pilot; and illustrates use of such preliminary costs and returns projections to inform subsequent experimentation and development of the technology. We will continue to refine this economic approach and describe it in future publications.
Corresponding author, title, and affiliation
Kelly Zering, Professor, Agricultural and Resource Economics, North Carolina State University
Corresponding author email
Other authors
Yijia Zhao, Graduate Student at BAE, NCSU; Shannon Banner, Graduate Student at BAE, NCSU; Mark Rice, Extension Specialist at BAE, NCSU; John Classen, Associate Professor and Director of Graduate Programs at BAE, NCSU
Acknowledgements
This project was supported by NRCS CIG Award 69-3A75-12-183.

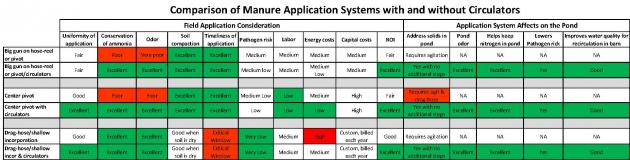
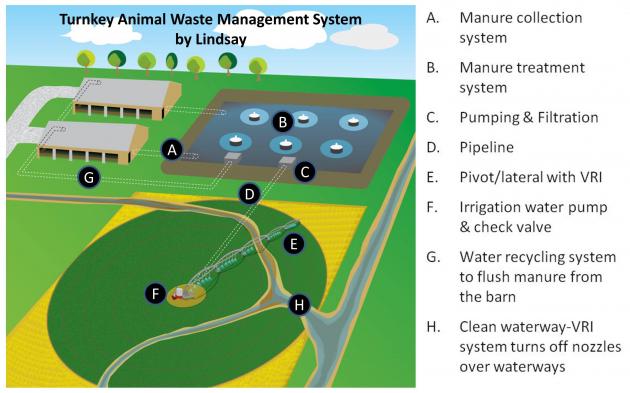 Applying livestock manure from lagoon storage through center pivot irrigation has long been considered a low-labor, uniform method of application that can deliver nutrients in-season to a growing crop. Three challenges with this system have been odor, pivot nozzle clogging and loss of nitrogen. A new innovation in lagoon treatment addresses these challenges. Low-power circulators were installed at a Northeast Nebraska commercial hog finishing facility and used to aerate the lagoon by moving oxygen-rich water and beneficial microbes to the bottom of the lagoon, reducing odor and potent greenhouse gases while lowering disease pathogen risk. This process preserved nitrogen and made it 40-60% more available in the first year of application. Circulation also reduced lagoon solids and bottom sludge, resulting in reduced agitation and dredging expense. Having a continuously well-mixed lagoon facilitated accurate manure nutrient sampling and consistent nutrient concentration delivery to the irrigation system. Combined with the ease of calibration of the center pivots, precision uniform nutrient application was achieved. Center pivot application had several additional advantages over tractor-based systems: less soil compaction, optimal nutrient timing during plant growth, higher uniformity, lower labor and energy costs, and eliminating impact on public roads. The circulators combined with flush barns and center pivot irrigation creates a complete turn-key manure management system.
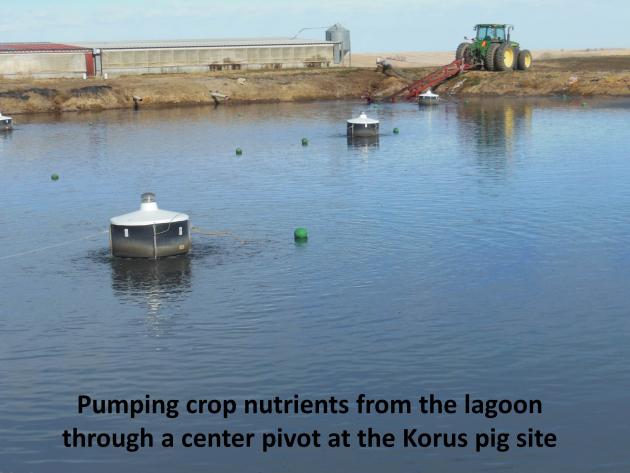 The purpose of the project was to evaluate the effectiveness of low powered circulators to treat livestock waste in lagoons. The objective was to evaluate how the addition of circulators to a livestock pond would change: 1. Odor levels, 2. Pivot nozzle clogging problems, and 3. Nitrogen loss.