Purpose?
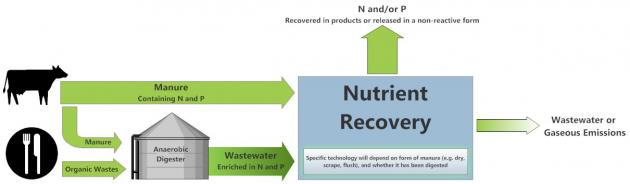
There is major interest from producers and the public in implementing best control technologies that would abate ammonia (NH3) emissions from confined livestock and poultry operations by capturing and recovering the nitrogen (NH3-N).
What did we do?
In this study, we continued investigating development of gas-permeable membrane modules as components of new processes to capture and recover gaseous ammonia inside poultry houses, composting facilities, and other livestock installations. The overall research objective was to improve poultry houses with the introduction of nitrogen emission capture technology. There were two milestones during the initial phase of the study: 1) to test ammonia recovery with gas-permeable membranes in a bench system using Maryland’s poultry manure; and 2) to construct and install a pilot ammonia recovery system at the UMES Poultry Research facility.
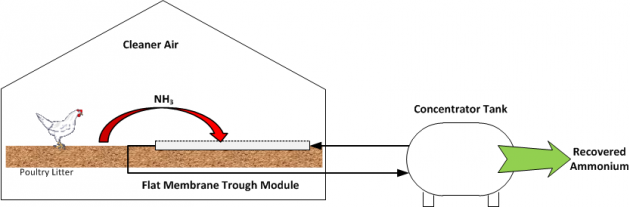
Figure 1. System for the recovery of gaseous ammonia from poultry waste using gas-permeable membrane module.
What have we learned?
The prototype ammonia recovery bench system using gas-permeable modules was moved from ARS-Florence to ARS-BARC in Sept. 2013 and tested during three consecutives runs using turkey and chicken manure mixes. The bench unit had two chambers: one was used with recirculating acid solution (1 N H2SO4) and the other was a control that used recirculating water. The control, which used water as the capture solution, was very effective at recovering the ammonia. This finding may lead to more economical ammonia recovery systems in the future.
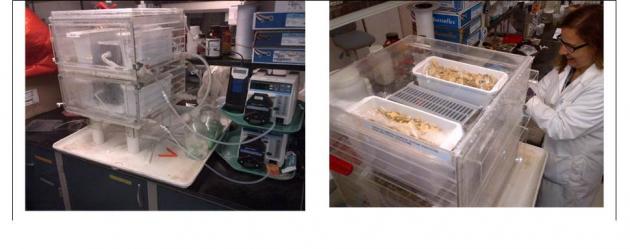
Figure 2. Prototype ammonia recovery system using gas-permeable modules.
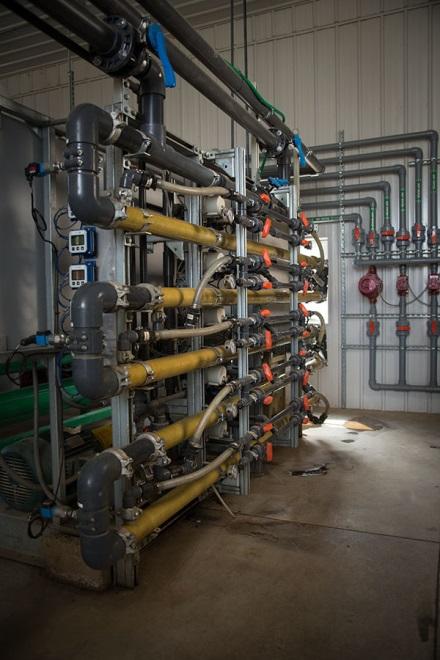
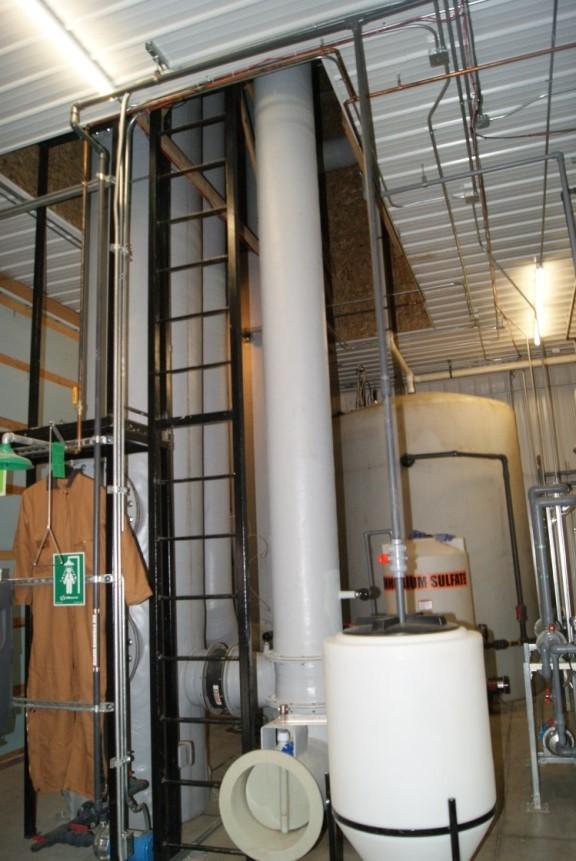
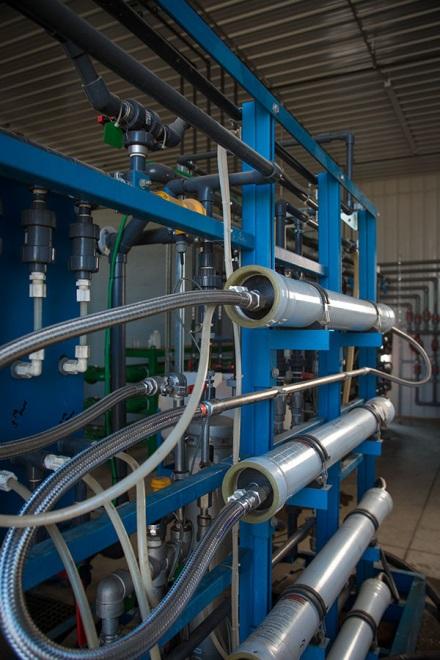
Two pilot ammonia recovery systems using gas-permeable membranes were constructed at ARS-Florence and installed at the UMES poultry research facility in June 2014. One ammonia recovery module was developed using flat membranes mounted on troughs. The other module was developed using tubular gas-permeable membranes. The recovery manifolds were placed inside the experimental barns (400 chickens) hanging from the roof and close to the litter. Both systems were installed with the ammonia concentrator tanks outside the barns. They were tested continuously for four months without chickens in the barns. The first flock of birds was placed in the facility Feb. 2015 and also in a control facility without the ammonia recovery modules. The installed modules will demonstrate the ammonia recovery and the potential poultry production benefits from cleaner air.
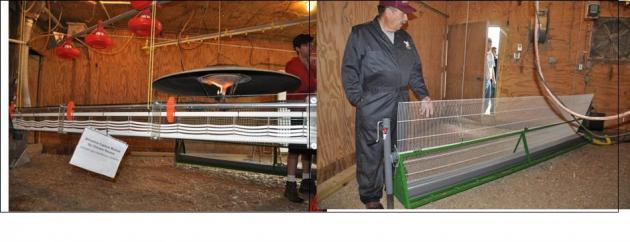
Figure 3. Pilot ammonia recovery systems installed in a chicken barn at UMES Poultry Research Facility. At left is a recovery module that uses tubular gas-permeable membranes. At right is a recovery module that uses flat gas-permeable membranes.
Future plans?
The N recovery modules are being demonstrated at the University of Maryland Eastern Shore’s Poultry Research facility.
USDA seeks a commercial partner to develop and market this invention (Gaseous ammonia removal system. US Patent 8,906,332 B2, issued Dec. 9, 2014). http://www.ars.usda.gov/business/docs.htm?docid=763&page=5
Authors
Matias Vanotti, USDA-ARS, Florence, South Carolina matias.vanotti@ars.usda.gov
Vanotti, M.B.1; Millner, P.D.2 ;Sanchez Bascones, M.3 ;Szogi, A.A.1; Brigman, P.W.1; Buabeng, F.4; Timmons, J.4 ; Hashem, F.M.4
1USDA-ARS Coastal Plains Soil Water and Plant Research Center, Florence, SC, USA
2USDA-ARS Environmental Microbial and Food Safety, Beltsville, MD, USA
3University of Valladolid, School of Agric. Engineering, Palencia, Spain
4University of Maryland Eastern Shore, Dept. of Agriculture, Food and Resource Sciences, Princess Anne, MD, USA
Additional information
Szogi, A.A., Vanotti, M.B., and Rothrock, M.J. 2014. Gaseous ammonia removal system. US Patent 8,906,332 B2, issued Dec. 9, 2014. US Patent and Trademark Office, Washington, DC.
Rothrock Jr, M.J., Szogi, A.A., Vanotti, M.B. 2013. Recovery of ammonia from poultry litter using flat gas permeable membranes. J. of Waste Management. 33:1531-1538
“Recovery of ammonia with gas permeable membranes” research update at USDA-ARS-CPSWPRC website http://www.ars.usda.gov/Research/docs.htm?docid=22883#ammonia
Acknowledgements
We acknowledge NIFA Project “Novel Integration of Solar Heating with Electricity Generation Technology and Biofiltered Poultry Litter Biofertilizer Production System” and ARS Project 6657-13630-001-00D “Innovative Animal Manure Treatment Technologies for Enhanced Environmental Quality”. Funding by University of Valladolid/Banco Santander for participation of Dr. Sanchez Bascones as Visiting Scientist is also acknowledged.
The authors are solely responsible for the content of these proceedings. The technical information does not necessarily reflect the official position of the sponsoring agencies or institutions represented by planning committee members, and inclusion and distribution herein does not constitute an endorsement of views expressed by the same. Printed materials included herein are not refereed publications. Citations should appear as follows. EXAMPLE: Authors. 2015. Title of presentation. Waste to Worth: Spreading Science and Solutions. Seattle, WA. March 31-April 3, 2015. URL of this page. Accessed on: today’s date.


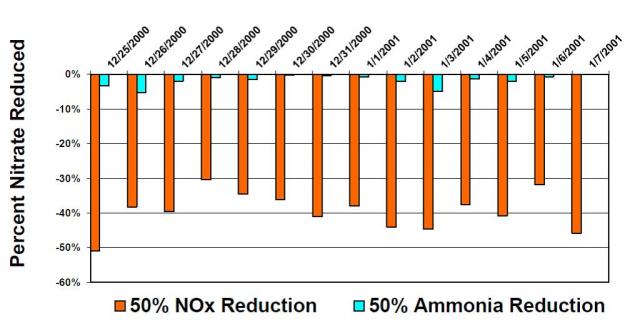 Atmospheric modeling has demonstrated that controlling NOx is the most effective strategy to reduce ammonium nitrate concentrations in the San Joaquin Valley and controlling ammonia has little effect on these concentrations. The California Air Resources Board conducted multiple modeling runs to simulate the formation of PM2.5 in the San Joaquin Valley and compare the effect of reducing various pollutants on PM2.5 concentrations. As seen in Figure 2, U.S. EPA’s Community Multi-scale Air Quality (CMAQ) indicated that reducing NOx by 50% reduced nitrate concentrations by 30% to 50% reductions, while reducing ammonia by 50% resulted in less than 5% reductions in nitrate concentrations. Similarly, the UCD/CIT photochemical transport model indicated that for the conditions on January 4-6, 1996 in the San Joaquin Valley, controlling NOx emissions is far more effective for reducing nitrate concentrations than controlling ammonia.
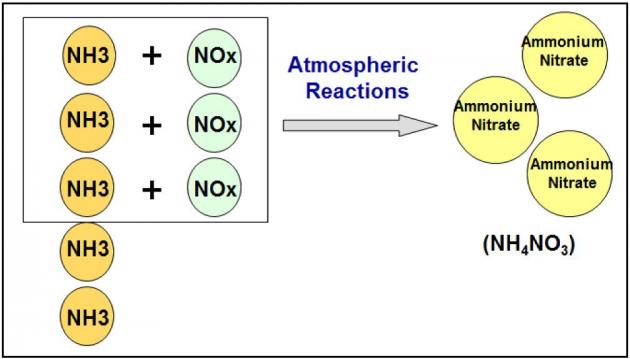 Ammonium nitrate particulate is limited by NOx in the San Joaquin Valley
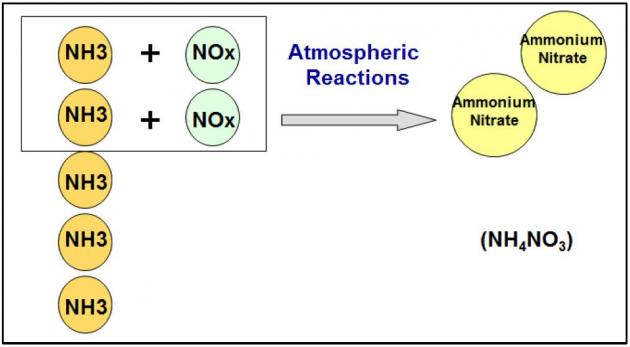 As explained in detail in the San Joaquin Valley Air Pollution Control District 2012 PM2.5 Plan, the best scientific information available indicates that controlling NOx emissions is the most effective strategy to reduce secondary ammonium nitrate in the San Joaquin Valley. While ammonia has been demonstrated to not significantly contribute to PM2.5 concentrations in the San Joaquin Valley, the District has developed control strategies, via stringent regulations (Confined Animal Facilities – Rule 4570, Organic Material Composting – Rule 4566, Biosolids, Animal Manure, and Poultry Litter Operations – Rule 4565), that have resulted in significant reductions in ammonia emissions.