NRCS Solid-Liquid Separation Document – It is Finally Here!!

NRCS has a new technical document entitled “Solid-Liquid Separation Alternatives for Manure Handling and Treatment.”  It was created through efforts from Dr. John Chastain, Clemson University with funding provided by USDA-NRCS.

Screw press solid-liquid separator
Screw press solid-liquid separator (Source: USDA-NRCS)

This document brings together both the theory behind solid-liquid separation and the practical application of many different separation technologies.  Several farm scale demonstration projects are also summarized in the report. Solid-liquid separation can serve to achieve many livestock operational objectives such as nutrient partitioning, improved pumping characteristics, solids removal from storage facilities and reduced organic loadings.  The use of separation technologies is essential for many operations and has become an integral part of the efficient performance of these livestock facilities. Some of the purposes and uses of this document include assisting in solid-liquid separation technology selection, evaluating separation performance, and quantifying the impact of solid-liquid separation on manure management.  This presentation provides an overview of this document including methods of solid-liquid separation, influence of manure characteristics and handling methods, fundamentals of solid-liquid separation, performance of various solid-liquid separation technologies, unique separation technologies and applications and design considerations.

What Did We Do?

Use of coagulant and flocculant to enhance solid-liquid separation
Use of coagulant and flocculant to enhance solid-liquid separation (Source: USDA-NRCS)

Extensive effort through literature searches and testing went into compiling performance and design information on various types of solid-liquid separation technologies.  Separation theory was incorporated into the document to provide an understanding of separation principles and background information to assist in technology selection for improved system performance.  To improve usability of the document, it was divided into the following chapters: Methods of Solid-Liquid Separation, Manure Characteristics and Handling Methods, Fundamentals of Solid-Liquid Separation, Measures of Solid-Liquid Separation Performance, High-Rate Solid-Liquid Separation, Unique Applications of Solid-Liquid Separation Technology, and Design Considerations.  Several examples were provided throughout to assist in the design process of the various technologies. The document also includes information on the uses and benefits of coagulants and flocculants and separation methods associated with sand laden manure. Numerous system diagrams assist in illustrating the vast array of solid-liquid separation technologies that can be implemented in an animal manure treatment system.

What Have We Learned?

Sand settling land
Sand settling land (Source: USDA-NRCS)

This work brings together fundamental information about solid-liquid separation, benefits and limitations of many separation technologies, performance measurement techniques along with design considerations into one document.  Even though there are significant differences in performance and costs between the various separation technologies, the approach selected is largely dependent on critical elements such as landowner objectives, facility size, performance goals, operation and maintenance and other factors.  This document will help designers and operators choose the separation technology or technologies that will best meet the goals established for the operation.

Future Plans

This document will be published as chapter 4 of the USDA-NRCS National Engineering Handbook, Part 637 Environmental Engineering.

Author

Jeffrey P. Porter, P.E.

Animal Manure and Nutrient Management Team Leader

USDA-Natural Resources Conservation Service

jeffrey.porter@gnb.usda.gov

Additional information

Once published, a copy of the document can be found at https://directives.sc.egov.usda.gov/.

Acknowledgements

A special thank you goes out to the Piedmont-South Atlantic Coast Cooperative Ecosystems Studies Unit (CESU).  This Cooperative and Joint Venture Agreement allowed for this work to be completed.

Additional support was provided by the Confined Animal Manure Managers Program, Clemson Extension, Clemson University, Clemson, SC.

The authors are solely responsible for the content of these proceedings. The technical information does not necessarily reflect the official position of the sponsoring agencies or institutions represented by planning committee members, and inclusion and distribution herein does not constitute an endorsement of views expressed by the same. Printed materials included herein are not refereed publications. Citations should appear as follows. EXAMPLE: Authors. 2019. Title of presentation. Waste to Worth. Minneapolis, MN. April 22-26, 2019. URL of this page. Accessed on: today’s date.

Early Stage Economic Modeling of Gas-permeable Membrane Technology Applied to Swine Manure after Anaerobic Digestion


Proceedings Home W2W Home w2w17 logo

Purpose

The objective of this study was to conduct cost versus design analysis for a gas-permeable membrane system using data from a small pilot scale experiment and projection of cost versus design to farm scale.

What did we do?

This reported work includes two major steps. First, the design of a small pilot scale batch gas-permeable membrane system was scaled to process effluent volumes from a commercial pig farm. The scaling design maintained critical process operating parameters of the experimental membrane system and introduced assumed features to characterize effluent flows from a working pig farm with an anaerobic digester. The scaled up design was characterized in a spreadsheet model. The second step was economic analysis of the scaled-up model of the membrane system. The objective of the economic analysis was to create information to guide subsequent experiments towards commercial development of the technology. The economic analysis was performed by introducing market prices for components, inputs, and products and then calculating effects on costs and on performance of changes in design parameters.

What have we learned?

First, baseline costs and revenues were calculated for the scaled up experimental design. The commercial scale design of a modular gas-permeable membrane system was modeled to treat 6 days accumulation of digester effluent at 16,300 gallons per day resulting in a batch capacity of 97,800 gallons. The modeled large scale system is 19,485 times the capacity of the 5.02 gallon experimental pilot system. The installation cost of the commercial scale system was estimated to be $903,333 for a system treating 97,800 gallon batches over a 6 day period.

At $1/linear ft. and 7.9 ft./gallon of batch capacity, membrane material makes up 86% of the estimated installation cost. Other installation costs include PVC pipes, pumps, aerators, tanks, and other parts and equipment used to assemble the system, as well as water to dilute the concentrated acid prior to initiating circulation. The annual operating cost of the system includes concentrated sulfuric acid consumed in the process. Using limited experimental data on this point, we assume a rate of 0.009 gallons (0.133 pounds) of acid per gallon of digester effluent treated. At a price of $1.11 per gallon ($0.073/lb) of acid, acid cost per gallon of effluent treated is $0.010. Other operating costs include electric power, labor, and repairs and maintenance of the membrane and other parts of the system estimated at 2% of investment cost for non-moving parts and 6% of investment for moving parts. Potential annual revenue from the system includes the value of ammonium sulfate produced. Over the 6 day treatment period, if 85% of the TAN-N in the digester effluent is removed by the process, and if 100% of the TAN-N removed is recovered as ammonium sulfate, and given the TAN-N concentration in digester effluent was 0.012 pounds per gallon (1401 mg/l), then 0.01 pounds of TAN-N are captured per gallon of effluent treated. At an ammonium sulfate fertilizer price of $588/ton or $0.294/pound and ammonium sulfate production of 0.047 pounds (0.01 pounds TAN-N equivalent), potential revenue is $0.014 per gallon of effluent treated. No price is attached here for the elimination of internal and external costs associated with potential release to the environment of 0.01 pounds TAN-N per gallon of digester effluent or 59,073 pounds TAN-N per year from the system modeled here.

Several findings and questions, reported here, are relevant to next steps in experimental evaluation and commercial development of this technology.

1. Membrane price and/or performance can be improved to substantially reduce installation cost. Membrane material makes up 86% of the current estimated installation cost. Each 10% reduction in the product of membrane price and length of membrane tube required per gallon capacity reduces estimated installation cost per gallon capacity by 8.6%.

2. The longevity and maintenance requirements of the membrane in this system were not examined in the experiment. Installation cost recovery per gallon of effluent decreases at a declining rate with longevity. For example, Cost Recovery Factors (percentage of initial investment charged as an annual cost) at 6% annual interest rate vary with economic life of the investment as follows: 1 year life CRF = 106%, 5 year life CRF = 24%, 10 year life CRF = 14% . Repair costs are often estimated as 2% of initial investment in non-moving parts. In the case of the membrane, annual repair and maintenance costs may increase with increased longevity. Longevity and maintenance requirements of membranes are important factors in determining total cost per gallon treated.

3. Based on experimental performance data (TAN removal in Table 1) and projected installation cost for various design treatment periods ( HRT = 2, 3, 4, 5, or 6 days), installation cost per unit mass of TAN removal decreases and then increases with the length of treatment period. The minimum occurs at HRT = 4 days when 68% reduction of TAN-N in the effluent has been achieved.

Table 1. Comparison of installation cost and days of treatment capacity

4. Cost of acid relative to TAN removal from the effluent and relative to fertilizer value of ammonium sulfate produced per gallon of effluent treated are important to operating cost of the membrane system. These coefficients were beyond the scope of the experiment although some pertinent data were generated. Questions are raised about the fate of acid in circulation. What fraction of acid remains in circulation after a batch is completed? What fraction of acid reacts with other constituents of the effluent to create other products in the circulating acid solution? What fraction of acid escapes through the membrane into the effluent? Increased efficiency of TAN removal from the effluent per unit of acid consumed will reduce the cost per unit TAN removed. Increased efficiency of converting acid to ammonium sulfate will reduce the net cost of acid per gallon treated.

5. Several operating parameters that remain to be explored affect costs and revenues per unit of effluent treated. Among those are parameters that potentially affect TAN movement through the membrane such as: a) pH of the effluent and pH of the acid solution in circulation, b) velocity of liquids on both sides of the membrane, and c) surface area of the membrane per volume of liquids; effluent and acid solution, in the reactor. Similarly, the most profitable or cost effective method of raising pH of the digester effluent remains to be determined, as it was beyond the scope of the current study. Aeration was used in this experiment and in the cost modeling. Aeration may or may not be the optimum method of raising pH and the optimum is contingent on relative prices of alternatives as well as their effect on overall system performance. Optimization of design to maximize profit or minimize cost requires knowledge of these performance response functions and associated cost functions.

6. Management of ammonium sulfate is a question to be addressed in future development of this technology. Questions that arise include: a) how does ammonium sulfate concentration in the acid solution affect rates of TAN removal and additional ammonia sulfate production, b) how can ammonium sulfate be removed from, or further concentrated in, the acid solution, c) can the acid solution containing ammonium sulfate be used without further modification and in which processes, d) what are possible uses for the acid solution after removal of ammonium sulfate, e) what are the possible uses for the effluent after removal of some TAN, and f) what are the costs and revenues associated with each of the alternatives. Answers to these questions are important to designing the membrane system and associated logistics and markets for used acid solution and ammonium sulfate. The realized value of ammonium sulfate and the cost (and revenue) of used acid solution are derived from optimization of this p art of the system.

7. LCA work on various configurations and operating parameters of the membrane system remains to be done. Concurrent with measurement of performance response functions for various parts of the membrane system, LCA work will quantify associated use of resources and emissions to the environment. Revenues may arise where external benefits are created and markets for those benefits exist. Where revenues are not available, marginal costs per unit of emission reduction or resource extraction reduction can be calculated to enable optimization of design across both profit and external factors.

Future Plans

A series of subsequent experiments and analyses are suggested in the previous section. Suggested work is aimed at improving knowledge of performance response to marginal changes in operating parameters and improving knowledge of the performance of various membranes. Profit maximization, cost minimization, and design optimization across both financial and external criteria require knowledge of performance response functions over a substantial number of variables. The economic analysis presented here addresses the challenge of projecting commercial scale costs and returns with data from an early stage experimental small pilot; and illustrates use of such preliminary costs and returns projections to inform subsequent experimentation and development of the technology. We will continue to refine this economic approach and describe it in future publications.

Corresponding author, title, and affiliation

Kelly Zering, Professor, Agricultural and Resource Economics, North Carolina State University

Corresponding author email

kzering@ncsu.edu

Other authors

Yijia Zhao, Graduate Student at BAE, NCSU; Shannon Banner, Graduate Student at BAE, NCSU; Mark Rice, Extension Specialist at BAE, NCSU; John Classen, Associate Professor and Director of Graduate Programs at BAE, NCSU

Acknowledgements

This project was supported by NRCS CIG Award 69-3A75-12-183.

Aeration to Improve Biogas Production by Recalcitrant Feedstock

Proceedings Home W2W Home w2w17 logo

Purpose

Why aerate biogas digesters?

Most agricultural waste is largely composed of polymers such as lignin and complex carbohydrates that are slowly or nearly completely non-degradable in anaerobic environments. An example of such a waste is chicken litter in which wood chips, rice hulls, straw and sawdust are commonly employed bedding materials.  This makes chicken litter a poor candidate for anaerobic digestion because of inherently poor digestibility and, as a consequence, low gas production rates.

Previous studies, however, have shown that the addition of small amounts of air to anaerobic digestates can improve degradation rates and gas production. These studies were largely performed at laboratory-scale with no provision to keep the added air within the anaerobic sludge.

What Did We Do?

Picture of 4 digesters with sprayer tanks
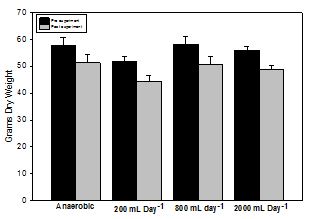
Four digesters were constructed out of 55 gallon sprayer tanks. The digestate was 132 L in volume with a dynamic headspace of 76 L. At the bottom of each tank a manifold was constructed from ½” PVC pipe in an “H” configuration and with a volume of approximately 230 mL. The bottom of the manifold had holes drilled in it to allow exchange with the sludge. Tanks were fed 400 g of used top dressing chicken litter (wood shaving bedding) obtained from a local producer (averaging 40% moisture and 15% ash) in 2 L of water through a port in the tank [labeled “1” in figure]. Two hundred mL of air were fed to the manifold through a flow meter [2] 0, 1, 4, or 10 times daily in 15-minute periods at widely spaced intervals by means of an air pump and rotary timer [4]. A gas port [3] at the top of the tank allowed for sampling and led to a wet tip flow meter (wettipflowmeters.com) to measure gas production. Digestate samples were taken out of a side port [5] for measurement of water quality and dissolved gases and overflow was discharged from the tank by means of a float switch wired in line with a ½” PVC electrically actuated ball valve.

Seven dried and weighed tulip poplar disks were added to each tank at the beginning of the experiment. At the end of the experiment, the disks were cleaned and dried for three days at 105 0C before re-weighing. Dissolved and headspace gases were measured on a gas chromatograph equipped with FID, ECD, and TCD detectors. Water quality was measured by standard APHA methods.

What Have We Learned?

Graph of chemical oxygen demand per liter and graph of liters of biogas per day

Adding 800 mL of air daily increased biogas production by an average of 73.4% compared to strictly anaerobic digestate. While adding 200 mL of air daily slightly increased gas production, adding 2 L per day decreased gas production by 16.7%.

Aerating the sludge improved chemical oxygen demand (COD) with the greatest benefit occurring at 2,000 mL added air per day. As noted, however, this decreased gas production in the control indicating toxicity to the anaerobic sludge.

The experiment was stopped after 148 days. When the tanks were opened, there was widespread fungal growth both on the surface of the digestate and the wood disks in the aerated tanks [left], whereas non-aerated tanks showed little evidence of fungal growth [right]. While wood disks subjected to all treatments lost significant mass (t-test, α=0.05), disks in the anaerobic tank lost the least amount of weight on average (6.3 g) while all other treatments lost over 7 g weight on average.

Picture of widespread fungal growth on the surface of the digestate and the wood discs in aerated tanks

Future Plans

Research on other feedstocks and aeration regimes are being conducted as are 16s and 18s community analyses.

Chart of grams dry weight pre experiment and post experiment

Corresponding author (name, title, affiliation)

John Loughrin, Research Chemist, Food Animal Environmental Research Systems, USDA-ARS, 2413 Nashville Rd. B5, Bowling Green, KY 42104

Corresponding author email address

John.loughrin@ars.usda.gov.

Other Authors

Karamat Sistani, Supervisory Soil Scientist, Food Animal Environmental Research Systems. Nanh Lovanh, Environmental Engineer, Food Animal Environmental Research Systems.

Additional Information

https://www.ars.usda.gov/midwest-area/bowling-green-ky/food-animal-envir…

Acknowledgements

We thank Stacy Antle and Mike Bryant (FAESRU) and Zachary Berry (WKU Dept. of Chemistry) for technical assistance.

University and Anaerobic Digestion Industry Partnerships – Laboratory Testing

The anaerobic digestion (AD) industry often is in need of laboratory testing to assist them with issues related to project development, digester performance and operation, and co-digestion incorporation. This presentation will highlight laboratory procedures that can be carried out through a University partnership, including biochemical methane productivity (BMP), specific methane activity assays (SMA), anaerobic toxicity assays (ATA), solids, nutrient and elemental proximate analysis for inputs, outputs and co-products, as well as a host of other activities. The presentation will illustrate the lessons that can be learned from the results of these tests, using real-life examples of testing already completed for industry partners.

Why Provide Guidance on Laboratory Testing for Anaerobic Digestion?

Laboratory testing allows characterization of anaerobic digestion (AD) inputs, outputs, and process stability. Testing can be carried out within AD industry laboratories, and they can also be carried out through partnerships with active AD research laboratories at academic institutions. The purpose of this project was to provide a document that summarizes common laboratory procedures that are used to evaluate AD influents, effluents, and process stability and to illustrate real-life examples of laboratory test results.

What did we do? 

The overview of common laboratory procedures was written based on the need to introduce third-party AD developers and government agencies to evaluating AD outputs and process stability. The authors are practiced at performing AD laboratory tests and have expertise and valuable information concerning these types of evaluations. Following a description of each test, we included the purpose of the test and an example of how the test results can be interpreted.

What have we learned? 

Laboratory testing of AD samples is performed to determine the concentration of certain constituents such as organic carbon, volatile fatty acids, ammonia-N, organic-N, phosphorus, and methane. Contaminants can be tested for such as fecal coliform indicator pathogens, pesticides, and pharmaceuticals. Understanding the concentration of specific constituents enables informed decisions to be made about appropriate effluent management.

Biochemical methane potential (BMP) and specific methanogenic activity (SMA) tests are used to estimate the biogas and methane that can be produced from an organic waste or wastewater during AD. These tests are often used by industry during the design phase to predict total biogas output, allowing for correct sizing of engines and estimation of potential revenue.

Anaerobic toxicity assays (ATAs) test the effect of different materials on biogas production. Unknown inhibitors may reside within new feedstock materials which can lead to an unanticipated reduction in digester performance, so it is important to use ATAs to test the effect of new feedstock material on the AD system before it is used. A common example is when energy-rich organic materials are added to a digester that practices co-digestion.

Future Plans 

Future plans are to prepare an extension fact sheet about the basics of anaerobic digestion effluents and processes, including the overview of common laboratory testing used to evaluate AD influents, effluents, and process stability.

Authors

Shannon Mitchell, Post-doctoral Research Associate at Washington State University shannon.mitchell@email.wsu.edu

Jingwei Ma, Post-doctoral Research Associate at Washington State University

Liang Yu, Post-doctoral Research Associate at Washington State University

Quanbao Zhao, Post-doctoral Research Associate at Washington State University

Craig Frear, Assistant Professor at Washington State University

Additional information 

Craig Frear, PhD

Assistant Professor

Center for Sustaining Agriculture and Natural Resources

Department of Biological Systems Engineering

Washington State University

PO Box 646120

Pullman WA 99164-6120

208-413-1180 (cell)

509-335-0194 (office)

cfrear@wsu.edu

www.csanr.wsu.edu

Acknowledgements

This research was supported by funding from USDA National Institute of Food and Agriculture, Contract #2012-6800219814; and by Biomass Research Funds from the WSU Agricultural Research Center.

The authors are solely responsible for the content of these proceedings. The technical information does not necessarily reflect the official position of the sponsoring agencies or institutions represented by planning committee members, and inclusion and distribution herein does not constitute an endorsement of views expressed by the same. Printed materials included herein are not refereed publications. Citations should appear as follows. EXAMPLE: Authors. 2015. Title of presentation. Waste to Worth: Spreading Science and Solutions. Seattle, WA. March 31-April 3, 2015. URL of this page. Accessed on: today’s date.

The Natural Farming Concept: A New Economical Waste Management for Small Family Swine Farms


Why Look at Inoculated Deep Litter Systems?

The most critical issue facing livestock and other small family operations nationwide is the development and implementation of cost effective pollution prevention technology. Our livestock producers, especially swine, continue to seek a best management practice (BMP) that is effective, economical, and practical, and in compliance with new US EPA laws. The Department of Health, Natural Resource Conservation Service, Hawaii Soil and Water Conservation Districts and the Cooperative Extension Service have been working diligently to address both federal and state waste management compliance needs of the local pork producer. As a result, the industry currently implements effluent irrigation, composting, deep litter technology, lagoon storage and solid separation as possible solutions for on-farm nutrient management. Unfortunately, due to new and revised EPA regulations, which now include nuisance odor and vector components, many of these strategies no longer meet federal criteria for BMPs.

In 2006, a system of waste management, with the potential to be implemented as a BMP under federal regulations, was discovered in Korea during a visit to the Janong Natural Farming Institution. The concepts of naturally collected micro-organisms, green waste deep litter, and a piggery design with strategic solar and wind positioning was being practiced in several countries in Asia and the Pacific Basin. Over the past six years, these concepts have been tested in Hawaiʻi to provide small swine farms with another BMP that is in compliance with current EPA regulations.

What did we do? 

For the past six years, the Extension Service has been touring many hog farms and conducting numerous educational seminars on the Inoculated Deep Litter System (IDLS). The number of IDLS piggery operators has increased dramatically due to farmers coming out of retirement, producers retrofitting and replacing their wash-down swine operations as well as new farmers trying their hand at raising hogs. A major factor of the great interest toward the IDLS piggery is the minimal labor and time to operate the system compared to the traditional style of raising hogs with daily wash downs of the pig pens. Other important factors include the concept of collected micro-organisms, a layering of the deep litter green waste system, and designing piggery housing with strategic solar and wind positioning to keep the facility cool and dry. The success of the IDLS system is exemplified by the following: 1) Low maintenance since litter pens never have to be cleaned, 2)has no odor or ve ctor problems if managed correctly and 3) development of cost effective housing.

What have we learned? 

IDLS incorporates four components: 1) self-collected, site-specific (or indigenous) micro-organisms (IMOs), 2) green waste, 3) natural ventilation, and 4) facility positioning relative to sunlight. The livestock facility is kept dry with natural ventilation and sunlight, which promotes proper fermentation of the pen litter (combination of green waste and livestock waste) thus preventing nuisance fly breeding and odors generated by proliferation of undesirable organisms.

Solar positioning. The building’s foundation is positioned from north to south, with the south end serving as the entrance to the facility. This takes advantage of maximizing sunlight traveling east to west, which provides adequate ultraviolet light, heating, and drying. Sunlight and ventilation help to promote drying, thus preventing liquid accumulation (from livestock waste, watering nipples or troughs, rain) in the litter, which deters the fermentation process from turning anaerobic, and eliminates conditions ideal for odor and fly breeding. (Note: orientation applies to the Northern Hemisphere and positioning should be reversed for application in the Southern Hemisphere.)

Natural ventilation. The building is designed with a high (14 ft H), vented roof, and walls (10 ft H) which have openings to the outside. Cool trade winds are allowed to blow through the building, forcing warm air to rise and be eliminated through the vented roof. This helps to dissipate heat generated from microbial fermentation in the litter, keeps the litter dry through constant air movement, and cools the facility during the hot season. During the rainy season, simple roll-down siding can be installed to keep rain out.

Deep Litter. In order to fulfill EPA regulations that require an impervious bottom to all waste handling facilities, there must be either a concrete slab or a thick (30 mil) plastic liner as the base of the building. Green waste, with a minimum depth of 4 feet, is then strategically layered to start the IDLS. The first layer consists of roughly a half foot of cinders mixed with bio-char (not charcoal briquettes). The second layer consists of 2 feet of cut logs. Logs should be at least 3 to 4 feet long and can range in diameter from 2” or more (larger, longer logs deter pigs from rooting them to the surface). The third layer is comprised of either leaves or fronds covered with assorted green waste. The next step is too lightly spread about one pound of IMO-4 and soil to every 50 square feet of surface area in the IDLS pen. For example, a 100 sq ft pen will require 2 pounds of IMO-4 applied in the third layer. The final step is to add about a half foot of sawd ust. Two weeks before introducing animals into the pens, activate the microbes once with a mist spray of lactic acid bacteria (LAB) and fermented plant Juice (FPJ). You can add animals to the pen once you smell a yeasty odor in the litter, a sign that the microbes have been activated and are at work in the pen.

Micro-organisms: The only micro-organisms used are self-collected by the producer from the specific site of the facility. The profile of indigenous micro-organisms may vary greatly from place to place, from windward to leeward coasts, and even between neighboring properties. The initial, one-time misting with lactic acid bacteria (LAB) and fermented plant juice (FPJ) activates the microbes to increase in numbers. To learn how to make these activators, please attend a Natural Farming Input-Making class, or contact the Hawaiʻi Cooperative Extension Service (mduponte@hawaii.edu).

LAB and FPJ: These are self-made inputs. Go to CTAHR website for free publication

Future Plans 

Adaptation of concept overcome a major hurdle when the IDLS piggery became cost sharable with the federal government on November 15, 2012 and deemed a best management practice. Hog farmers who practice the IDLS are eligible in entering into a cost-share agreement with the U.S. Department of Agriculture (USDA) for Environmental Quality Incentive Program (EQIP) assistance and may file an application at any time and will further enhance the participation in the IDLSTo date nearly 50 retrofitted or new operations have been established in Hawaii. The IDLS has been introduced and being practiced in 11 states, Micronesia and various countries of the world. Future plans include implementing the technology to large scale operations, making of feed utilizing other natural farming techniques and evaluating the compost for organic plant propagation. The system is currently being tested with Poultry Production

Author   

Michael DuPonte, Extension Agent University of Hawaii at Manoa, College of Tropical Agriculture and Human Resources (CTAHR). mduponte@hawaii.edu

Additional information 

Publications

H. Park and M.W. DuPonte., 2010., How to Cultivate Indigenous Microorganisms, Biotechnology, CTAHR., June, BIO-9.

M. DuPonte and D. Fischer., Most Frequently Asked Questions on the IDLS Piggery, The Natural Farming Concept A New Economical Waste Management Stem for the Small Family Swine Farms in Hawaii., 2012., Livestock Management., Sept. , LM-23

D. M. Ikeda, Weinert Jr., E., Chang K.C.S., Mc Ginn, J.M., Miller S., Keliihoomalu, and DuPonte, M.W., 2013., Natural Farming: Fermented Plant Juice, Sustainable Agriculture, CTAHR., July, SA-7.

S. Miller, Ikeda, D.M., Weinert Jr., E., Chang K.C.S., Mc Ginn, J.M., Keliihoomalu, and DuPonte, M.W., Natural Farming: Lactic Acid Bacteria, Sustainable Agriculture, CTAHR., August, SA-8.

Acknowledgements      

Kang Farms of Kurtistown, Hawaii, David Fischer (NRCS), Justin Perry III (NRCS) and Lehua Wall (CTAHR)

The authors are solely responsible for the content of these proceedings. The technical information does not necessarily reflect the official position of the sponsoring agencies or institutions represented by planning committee members, and inclusion and distribution herein does not constitute an endorsement of views expressed by the same. Printed materials included herein are not refereed publications. Citations should appear as follows. EXAMPLE: Authors. 2015. Title of presentation. Waste to Worth: Spreading Science and Solutions. Seattle, WA. March 31-April 3, 2015. URL of this page. Accessed on: today’s date.