
Aerial photos of farms and farming practices are becoming easier to find and collect. But drones and satellites can provide more than pretty pictures. In this webinar, the three speakers will share applications of drones and remote sensing for air and water quality measures around livestock farms. Dirk Charlson will share his simple approach to collecting drone imagery, and the range of opportunities for analyzing images and mapping practices. Nesli Akdeniz has collected air quality measures in pasture systems with drones. Finally, Becca Muenich has used remote sensing to examine land application practices. While it may seem like these applications are flying by faster than we can see, the speakers will help ground us with their experience. This presentation was originally broadcast on December 12, 2025. Continue reading “A view from above – application of drones and remote sensing for air and water quality measures around livestock farms”
Manure processing for discharge water quality – technical performance and county perspectives for advancing water quality
This webinar will examine the potential of advanced manure processing systems to treat manure to water quality standards suitable for discharge. It will feature insights from Dane County Land Conservation, including their objectives in supporting system installation, the ownership and operational structure, financial support mechanisms, observed outcomes, and future planning. This presentation was originally broadcast on June 20, 2025. Continue reading “Manure processing for discharge water quality – technical performance and county perspectives for advancing water quality”
High Clearance Robotic Irrigation Impacts on Soybeans and Corn Yield and Nutrient Application
Purpose
This collaborative project between The Ohio State University, Iowa State University, and 360YieldCenter intends to demonstrate the in-season application of commercial and animal nutrient sources and water application as a unified strategy to reduce nutrient losses while improving profitability with increased grain yields. A new and innovative high-clearance robotic irrigator (HCRI) is being used to apply liquid-phase nutrients in-season beyond all stages of row crops. Replicated strip trials of Fall, Spring, and in-season application will occur using the HCRI (e.g., 360 RAIN Robotic Irrigator, Figure 1). The in-season application consists of traditional N and P application rates as well as reduced rates to take advantage of better matching nutrient availability to crop needs during the growing season. Data were collected to verify nitrate-nitrogen leaching loss using liquid swine manure as a nutrient source in Iowa, while total and dissolved reactive phosphorus losses with both runoff and leaching using commercially available nutrients were collected in in Ohio. Secondly, as climate shifts result in water scarcity during critical crop growth stages, robotic irrigation water applications will be used to meet the crop needs. Higher crop yields are anticipated via precision water management.

What Did We Do?
OSU is conducting two field demonstrations, one with a focus on water quality, and a second for comparison of nutrient management practices. The HCRI is being utilized to apply commercial fertilizer in-season via dilution in irrigation water with up to 12 applications per growing season (effective 4.5 in. of precipitation season dependent). Nutrient injection rates (N and P) are scaled to plant nutrient uptake and irrigator pass intervals. Both sites are farmed in accordance with existing crop rotation and standard practices.
Beck’s Hybrid Site (West 1A) – The Beck’s Hybrid site (78 ac) is subdivided in accordance with the sub-watershed boundaries and managed with two treatments: 1) conventional commercial fertilizer application in accordance with the Tri-State Fertilizer recommendations, and 2) in-season nutrient management (N and P) using the HCRI and Tri-State Fertilizer Recommendations with the exception nutrient application matching with plant nutrient uptake rates as judged by growing degree days (GDD). This site is instrumented as a paired watershed for surface water and subsurface tile drainage. Further, these watersheds are monitored for precipitation, flow, and water quality (nitrate, nitrite, total phosphorus and DRP).
Molly Caren Agricultural Center (MCAC) Site 1 (Field 7) – Field demonstrations at this site (140 ac) are laid-out in a randomized complete block design (RCBD) strip trial design with treatments that include: 1) commercial fertilizer application (N and P) in accordance with the Tri-State Fertilizer recommendations, 2) in-season nutrient management (N and P) using the HCRI and Tri-State Recommendations with the exception nutrient application matched with crop nutrient uptake rates based on growth stages as determined by GDD, and 3) in-season nutrient management (N and P) using the HCRI and 67.7% Tri-State recommend application rates matched with crop nutrient uptake rates based on growth stages (GDD). Strip trials are 160 ft. in width and approximately 1,170 ft. in length (4.3 ac treatments) with eight replicates.
MCAC Site 2 (Field 8A) – Field demonstration site used to test HCRI and “sandbox” for other RCBD trials outside of NRCS CIG grant to discovery and planning for future projects. This site varies depending on studies each year, but trials are completed via RCBD strips.
Data Collection and Analysis – Demonstration sites are grid sampled each season on a 1-ac grid (Beck’s) and within treatments (MCAC site) to monitor soil fertility levels. Soil moisture and temperature in situ sensors (CropX) are placed in both study locations (three per treatment, 15 total sensors). Tissue samples are collected by treatment type to assess nutrient uptake at three stages of crop growth. Harvested crops are scaled by treatment to ensure yield monitor accuracy. Remote sensing imagery (RGB, ADVI and thermal) is collected 10 or more times during the growing season to evaluate crop growth and development. Data is analyzed using RCBD procedures in SAS.
Water Quality Assessment – Surface and subsurface (tile) monitoring capacity was established in 2016 at the Beck’s Hybrid Site. Two isolated subareas within a single production field were identified and the surface and subsurface pathways were instrumented with control volumes and automated sampling equipment. Surface runoff sites were equipped with H-flumes while compound weirs were installed at each of the subsurface (tile) outlets. Each sampling point (two surface and two subsurface) is equipped with an automated water quality sampler and programmed to collect periodic samples during discharge events. Once collected, samples will be analyzed for N and P. An on-site weather station provides weather parameters. Water samples are collected weekly from the field plots during periods of drainage and follow the same ISU protocol for NO3–N. Dissolved reactive phosphorus (DRP) and digested (total phosphorous) samples are analyzed using ascorbic acid reduction method.
What Have We Learned?
2023 Results
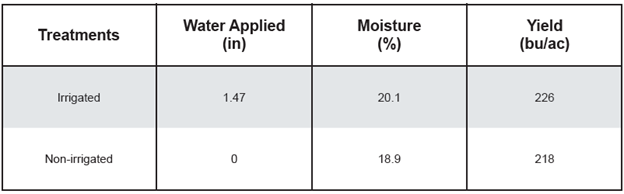
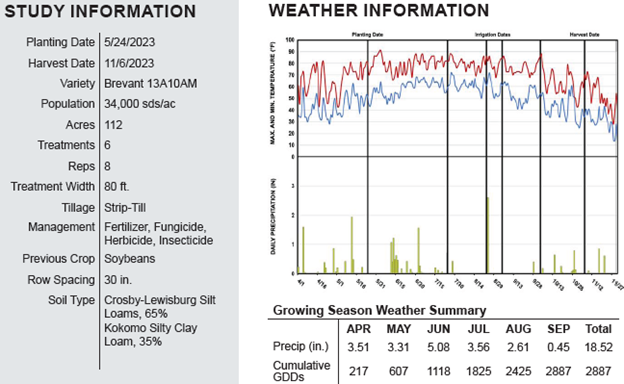
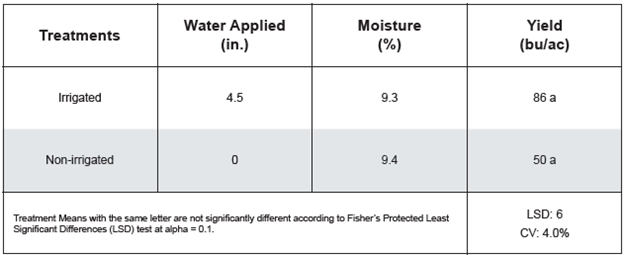
At the Beck’s Hybrid location field West 1A was planted to corn for the 2023 cropping season. There was an 8.0 bu/ac difference between irrigated and non-irrigated treatments. Nitrogen was injected using the rain unit and put on crop for the first application and use of the rain machine. Not having the rain unit in June made a significant difference in this study. The results of this location from 2023 should be taken lightly as complete implementation was not done until August. Location study information can be seen in Figure 2 and results in Figure 3.

In 2023, field 7 at MCAC was in soybeans and had no irrigation completed for this growing season.
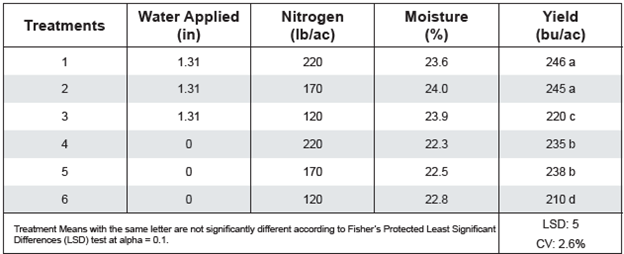
Field 8A at MCAC was in corn for the 2023 cropping season. Irrigation had a statistically significant effect on yield over all treatments. Nitrogen had statistical significance from 120 versus 170 and 220 units on nitrogen treatments. The 170 units of nitrogen was the optimal amount of nitrogen for all treatments. Not having the irrigator installed in early June caused there to be less yield in irrigated treatments. The results of this location from 2023 should be taken lightly as complete implementation was not done until August. Location study information can be seen in Figure 4 and results in Figure 5.
2024 Results
Field 7 at MCAC was in corn for the 2024 cropping season. Irrigation had a statistically significant effect on yield over all treatments. There was a 48 bu/ac between irrigated two-thirds nutrients and non-irrigated and 44 bu/ac between irrigated and non-irrigated for the 2024 growing season. A total of 773 gallons of diesel was used to run the irrigator for this trial for 2024 cropping season across 71 acres. A total of 25,739 kWh was used to run the electric pumps, base station, and well for 2024 growing season across 71 acres. These are the initial results that were published in efields and further results will continue to be analyzed to meet all project objectives. This data will be used to help in evaluating HCRI versus traditional crop production and management practices to meet project objectives. Location study information can be seen in Figure 6 and results in Figure 8. In Figure 7, aerial imagery can be seen from the 2024 cropping season.

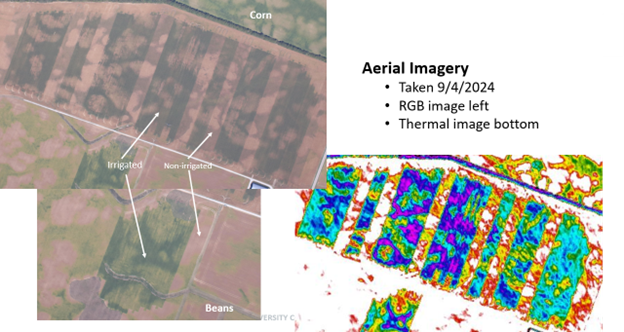

Field 8A at MCAC was in soybeans for the 2024 cropping season. Irrigation had a statistically significant effect on yield over non-irrigated. A total of 211 gallons of diesel was used to run the irrigator for this trial for 2024 cropping season across 11 acres. A total of 3,475 kWh was used to run the electric pumps, base station, and well for 2024 growing season across 11 acres. Location study information can be seen in Figure 9 and results in Figure 10. In Figure 7, aerial imagery can be seen from the 2024 cropping season.

Future Plans
During the next 12 months, we are planning for the HCRI operation at the two sites for cropping practices and irrigation for 2025 growing season. We will be aggregating weather data, agronomic data, plant samples, surface and ground water quality samples, and machine performance data for all years of the project with the current end date as spring of 2026. We are hoping to continue to perform testing with this technology and implementing the dry product skid for field operations for the 2025 growing and full-scale implementation across all studies in 2026. The results from the Iowa State portion of this funded project will also be reported in the future as well. There is a significant need to further develop programs for injecting macro and micronutrients in liquid and granular form for growers. The potential to significantly cut application rates exists with this technology. Also, implementing this technology with liquid livestock manure producers will change the paradigm of how manure is managed in the future.
Authors
Presenting & corresponding author
Andrew Klopfenstein, Senior Research Engineer, The Ohio State University, Klopfenstein.34@osu.edu
Additional authors
Justin Koch, Innovation Engineer, 360YieldCenter; Kapil Arora, Field Agricultural Engineer, Iowa State University; Daniel Anderson, Associate Professor, Iowa State University; Matthew Helmers, Professor, Iowa State University; Kelvin Leibold, Farm Management Specialist, Iowa State University; Alex Parsio, Research Engineer, The Ohio State University; Chris Tkach, Lecturer, The Ohio State University; Christopher Dean, Graduate Research Associate, The Ohio State University; Ramareo Venkatesh, Research Associate, The Ohio State University; Elizabeth Hawkins, Agronomics Systems Field Specialist, The Ohio State University; John Fulton, Professor, The Ohio State University; Scott Shearer, Professor and Chair, The Ohio State University
Additional Information
eFields On-Farm Research Publication 2023 and 2024 Editions – https://digitalag.osu.edu/efields
Acknowledgements
Natural Resources Conservation Service – Conservation Innovation Grant (NR223A750013G037)
Ohio Department of Agriculture – H2Ohio Grant
USDA, NRCS, 360YieldCenter, Beck’s Hybrids, Molly Caren Agricultural Center, Rooted Agri Services, Iowa State University, The Ohio State University
The authors are solely responsible for the content of these proceedings. The technical information does not necessarily reflect the official position of the sponsoring agencies or institutions represented by planning committee members, and inclusion and distribution herein does not constitute an endorsement of views expressed by the same. Printed materials included herein are not refereed publications. Citations should appear as follows. EXAMPLE: Authors. 2025. Title of presentation. Waste to Worth. Boise, ID. April 7-11, 2025. URL of this page. Accessed on: today’s date.
Can Environmental Data Spark a Circular Economy? Exploring the Potential of a California Dairy Manureshed
Purpose
California’s San Joaquin Valley (SJV) has uniquely “wicked” problems with nitrogen (N) management as it is a highly productive agricultural region where many communities rely on nitrate-contaminated groundwater for drinking. Some of this N loading is attributed to manure from dairies whose N output often exceeds the requirement of forage N, resulting in surplus manure N. The counties in the SJV have the worst groundwater quality and represent the 8 highest dairy populations. But, they also make up 7 of the 10 counties with the highest fertilizer inputs which also contributes to groundwater degradation. There is no doubt that California dairies contribute to N loading, but they also hold unique potential to utilize their surplus manure N to replace a portion of the 550,000 tons of N fertilizer applied to California’s diverse agricultural production. If appropriate measures are taken, the California dairy industry is well positioned to improve water quality in California by limiting its own excess N application while simultaneously replacing its neighbors’ synthetic inputs. The purpose of this preliminary manureshed analysis is to: 1) identify where surplus manure may become a primary N resource in California and 2) quantify its potential to reduce synthetic fertilizer inputs.
Past manureshed analyses have demonstrated manure’s potential to address crop nutrient requirements while acknowledging difficulties with pathogens, lack of spatially available data for CAFOs, and unpredictable manure nutrient variability within and across facilities. A California manureshed is uniquely challenging because of its large proportion of human-consumed crops and surplus dairy manure, which has a low value-to-mass ratio. However, there has been a concerted effort from government entities and the dairy industry to properly account for dairy manure properties to understand the potential expansion of a dairy manure market. Part of this effort has led to reporting requirements, leading to an abundance of facility-level data including location and N generated. These data can be analyzed to understand the economic and environmental potential of using dairy manure beyond its current practices.
What Did We Do?
We applied past manureshed approaches with California-specific data to understand available dairy manure and crop N need in 2021, which was the most recent crop data available to the authors at the time of publishing these proceedings.
To account for N generated on each dairy, we used the herd data from the California Dairy & Livestock Database (CADD), compiled by the California Air Resources Board. We assumed a milk cow produced 70 lbs of milk a day and, per the ASABE standard, that resulted in 0.92 lbs N per milk cow per day. A calf, dry cow, and heifer were assumed to produce 0.14, 0.5, and 0.26 lbs N per animal per day, respectively.
To calculate recoverable plant available N (PAN) (Figure 1) from manure generated on-farm, we assumed that 30% was lost to ammonia before any land application (Chang et al. 2006) and that manure was 21% organic matter (with 30% of that becoming plant available) and 79% inorganic (NH4+). Of the inorganic fraction available for land application, we assumed that 40% was lost to leaching, volatilization, or denitrification (Chang et al. 2006). We acknowledge that these assumptions about manure handling and, therefore, N forms and transformations are highly variable depending on local conditions, but we feel confident that this represents an accepted target “average” as described by Chang et al. 2006. This paper is a result of an expert panel review and informed California’s current regulatory framework for dairies. We also highlight that our “recoverable” manure only includes that year’s plant available portion and does not account for organic N from previous manure applications that may be contributing to actual available N.

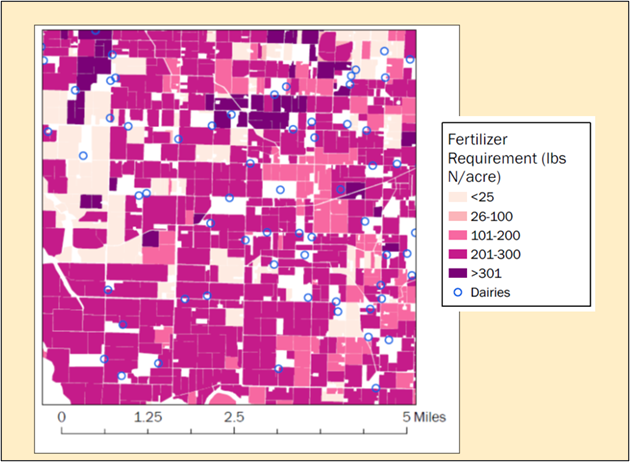
For crop N needs, we first identified farm boundaries and crops grown (up to 4 per year) based on LandIQ data and fertilizer N requirements from the California Crop Fertilization Guidelines and average county yields from USDA NASS. We assigned each LandIQ polygon a value for fertilizer N required (Figure 2). We summed N fertilizer requirements for all land polygons that were within 2, 5, and 10 miles of each dairy. A polygon was considered within a specified distance of a dairy based on the distance from any edge of the field to the latitude/longitude provided in the CADD database. Finally, all fertilizer requirements were multiplied by 1.16 to account for a 60% efficiency for manure and a 70% efficiency for fertilizer.
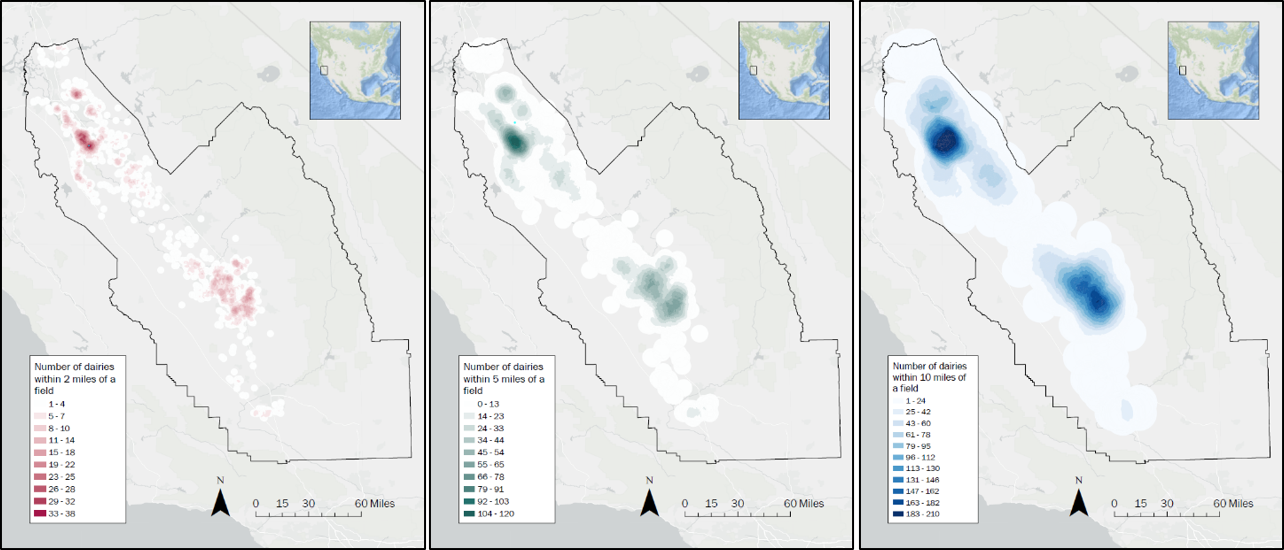
To determine (hypothetically) allocated manure to nearby fields, we used the Ford Fulkerson algorithm to maximize flow. This algorithm was necessary because there are areas with significant concentration of dairies (Figure 3). Therefore, if a dairy is within 2 (or 5 or 10) miles of a field, it would be competing with other dairies to supply the demand. There would be several combinations possible for each dairy (could access multiple fields) and each field (accessible by multiple dairies) (Figure 4). The algorithm maximized the amount of manure used, and prioritized forage fields (wheat/corn/grass). We assumed that a field could supply manure from multiple dairies and that a dairy could supply manure to multiple fields.

What Have We Learned?
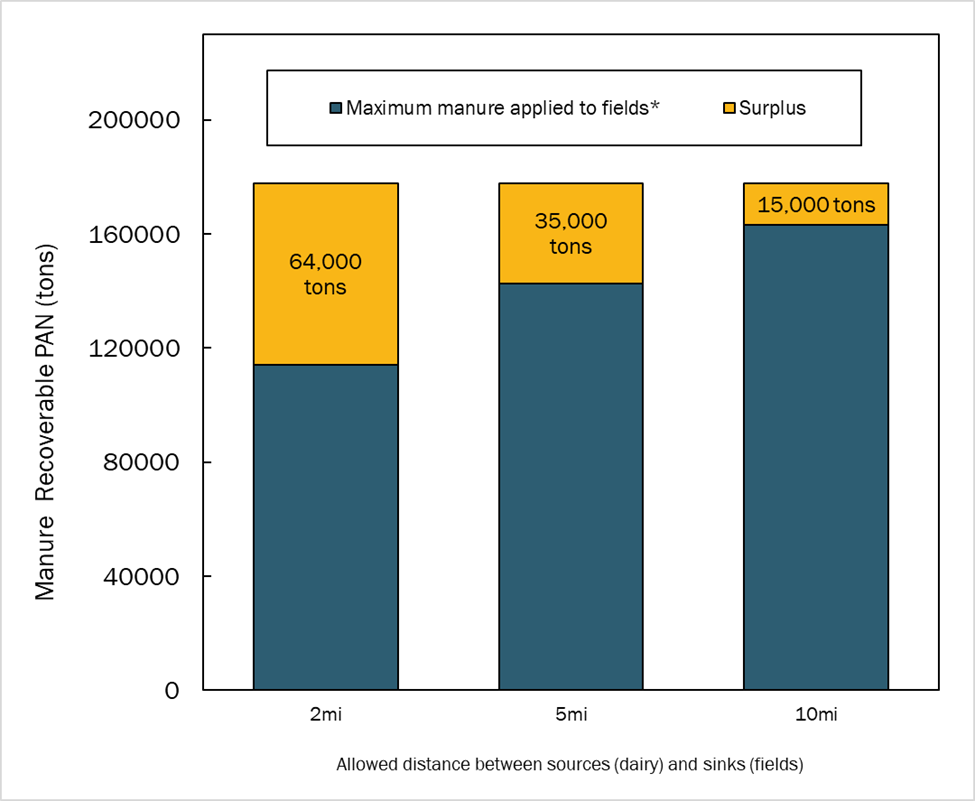
Total manure N generated was 298,000 tons, and we estimate that 178,000 tons of that was plant available N (Figure 4). It should be noted that our assumptions about N loss are aligned with ambitious environmental goals and resulted in much higher recovery rates compared to NuGIS. We also make a blanket assumption about relative organic / inorganic forms. In our hypothetical exercise where this manure could be applied to all fields (prioritizing forage first) within 2 miles of dairies, 114,000 tons were allocated, leaving 64,000 tons of surplus manure N. If the boundary were expanded to 5 miles, 143,000 tons could be allocated leaving 35,000 tons of surplus manure N. Surplus manure N was only 15,000 tons if manure could be applied up to 10 miles away from dairies where 163,000 tons were applied. Note that these simulations assume that manure can be applied to any crop (including human-consumed ones), which is not currently realistic.
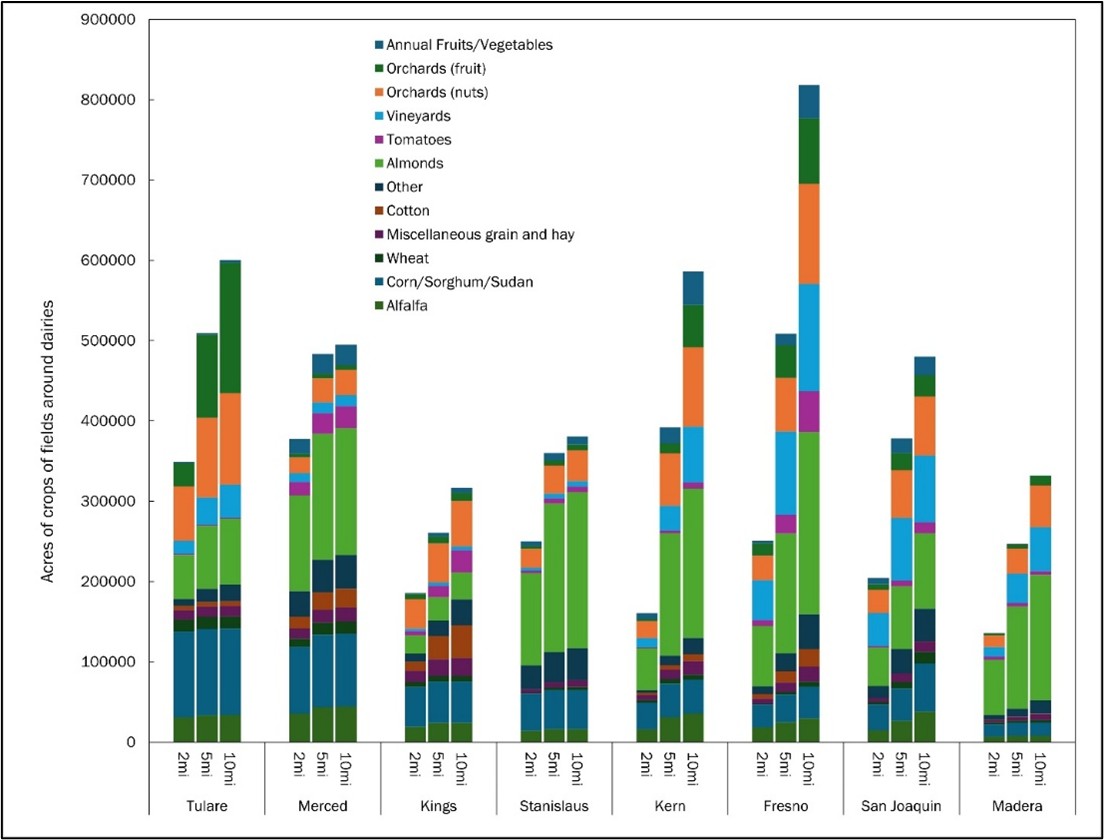
The amount of manure available for application varied by county. In Tulare, there was still a surplus N of 10,500 tons when assuming manure could be applied to all acreage within 10 miles of a dairy (Figure 6). However, in 3 counties (Fresno, San Joaquin, Madera), all hypothetical fertilizer N requirement could be met by applying manure within just 5 miles. Merced, Stanislaus, and Kern had fertilizer requirements met by expanding the allowed distance traveled to 10 miles. The crop types that were fulfilled by manure also differed by county (Figure 7, aggregated by county of field receiving manure).


The California agricultural landscape, with many fruits and vegetables that go directly to human consumption, makes our hypothetical application rate currently unviable. For example, the only dairy forage crops with substantial acreage that are currently eligible for raw manure application are wheat, alfalfa (which does not receive N), and corn. These make up between 18-44% of area within 2 miles of a dairy, and increasing the distance from a dairy up to 10 miles decreases the percentage of crops that are forage (Figure 8). In other words, the farther away from a dairy, the more likely land use is classified as a crop that would be flagged for pathogen concerns. This highlights that to effectively use manure in the SJV, there will need to be a concerted effort to address logistical issues associated with human-consumed crops. However, these crops are generally high value, and some commodities are concentrated within a county (Figure 7).
Future Plans
This phase of the manureshed analysis was intended to demonstrate the potential for manure to reduce fertilizer inputs; however, its practical applications are limited. In the next phase, we hope to improve our analysis by accounting for more details of manure, such as solid vs. liquid (for improved predictions of N content/transformation/transportability) and phosphorus and potassium concentration/stoichiometry. We will work with commodity groups, with a focus on those within 10 miles of dairies, to understand the current level of interest and obstacles for integrating different manure products into their cropping systems. These improvements to our methodology will result in a quantification of environmental and economic opportunity to increase the likelihood of a circular economy by expanding the use of dairy manure.
Authors
Presenting & corresponding author
Emily R Waring, Agricultural Practice Impact Analyst, Sustainable Conservation, ewaring@suscon.org
Additional authors
-
- Ryan Flaherty, Senior Director of Circular Economies, Sustainable Conservation
- Sarah Castle, Senior Scientist, Sustainable Conservation
- John Cardoza, Project Director, Sustainable Conservation
The authors are solely responsible for the content of these proceedings. The technical information does not necessarily reflect the official position of the sponsoring agencies or institutions represented by planning committee members, and inclusion and distribution herein does not constitute an endorsement of views expressed by the same. Printed materials included herein are not refereed publications. Citations should appear as follows. EXAMPLE: Authors. 2025. Title of presentation. Waste to Worth. Boise, ID. April 7-11, 2025. URL of this page. Accessed on: today’s date.
From Lecture to Hands-On Learning: Engaging Iowa’s Manure Applicators Through Active Certification Programs
Purpose
The Iowa Manure Applicator Certification program has transitioned from a traditional lecture-based format to a multimodal learning approach that integrates lectures, discussion, and hands-on activities. This shift was implemented to create more engaging and memorable training experiences, fostering discussion and peer-to-peer knowledge sharing while improving knowledge retention and practical skill application.
Hands-on learning has been widely recognized as an effective educational strategy. Research indicates that individuals retain more information through active engagement rather than passive listening. However, developing these engaged learning opportunities requires additional time and commitment from educators and a willingness from participants to fully engage in the learning process. Our goal was to transform the training environment from passive listening to an interactive space where participants could explore activities, facilitate discussions, and share personal experiences within groups.
What Did We Do?
To achieve this transformation, we restructured the program to incorporate interactive activities designed to bring real-world challenges into the classroom. Instead of serving solely as lecturers, facilitators became discussion leaders, encouraging participants to actively engage with the material. Starting in approximately 2014, we started adding one module to training based on fostering discussion and participant interaction. As the training occurs annually, with livestock farmers or commercial manure applicators required to attend annually, different modules were created each year with at least a three-year break before an existing module is used again.
Some of the hands-on activities integrated into the program include:
-
- Carousel Exercise – Applicators rotate through stations, responding to questions on environmental impacts and operational challenges, sparking peer-to-peer discussions.
- Spill Response Scenario – Groups rank and discuss response steps to manure spills, often incorporating real-world examples shared by applicators and insights from Iowa DNR regulators.
- Load Loss Competition – Model trucks are used to visually demonstrate best practices for material containment.
- Stockpiling Locations – Hands-on exercises with topographic, soil, and aerial imagery to develop regulatory knowledge and practical application skills.
- Application Rate Calibration – Three simulated manures (bed pack [wetted straw], open lot [wetted sand], and turkey litter [wetted wood shavings]) were supplied to each group and a plastic tarp. Each group was asked to apply a prescribed manure application and then to estimate the application rate of other groups. The actual application rate was calculated based on the weight added to the tarp and compared to group estimates.
- DOT Compliance Activity – Participants perform checklist inspections on model trucks to identify vehicle issues and understand road rules.
- Video-Based Farm Walkthrough – Applicators observe an Iowa DNR site inspection via video before using Google Maps and a farm description to evaluate livestock production sites for compliance readiness.
- Biosecurity Bench – Glow germ was placed on at a simulated barn entry and producers went through a Danish style entry. At the end we evaluated how much glow germ made it to the clean side of the entry.
- Manure Transport Route Selection – Participants were divided into groups and given a map and worksheet. The map identified the location of the farm with manure and the field to which manure was to be applied. Groups were required to select a route from farm to field with the worksheet providing talking points such as travel time, neighbors, and bridge considerations.

Each of these activities was designed to promote critical thinking in manure management and spill prevention while allowing facilitators to assess current knowledge levels among participants.
What Have We Learned?
While some participants and facilitators initially approached this transition with skepticism, feedback has been positive. Evaluations suggest that these engaged learning techniques have resulted in increased participant investment, improved knowledge retention, and greater willingness to discuss challenges and ask questions.
Facilitators also report stronger engagement with applicators, who now feel more comfortable sharing experiences, discussing obstacles, and applying learned concepts in real-world situations. Additionally, peer-to-peer learning has emerged as a significant benefit, with applicators contributing valuable insights that complement the formal curriculum.
Data obtained from the Iowa Department of Natural Resources Hazardous Material Release Database (https://programs.iowadnr.gov/hazardousspills/Reports/EPCManureRelease.aspx) was used to track total incidents of manure releases and surface water impacts from these releases. Within this report, incidents are broken down by species (Hog, cattle, or poultry, by facility type (open lot, confinement), and if they occurred from the facility, because of land application, or during manure transport. A summary of total events is provided in Figure 2. A before and after analysis using 2012 as the break point indicated a statistically lower number of spills (29.9 ± 9.6 compared to 49.9 ± 6.4 spills) after 2014 (p<0.001). However, the number of water quality impacts from spills remained unchanged (10.9 ± 4.6 compared to 10.0 ± 4.8). A breakpoint regression analysis was used to evaluate if the occurrence of spills has changed with time (Figure 2). The breakpoint year was set at 2013 (the year before our first active learning activity was implemented) and results indicated that before 2013 the occurrence of spills was constant with time, while after 2013 we have been decreasing by 3.1 spills per year. Similarly, for water quality impacts the breakpoint year was set at 2013 with results indicating that before 2013 impacts on water (spills reaching a surface water) were constant with time, while after 2013 impacts have been decreasing by 0.3 incidences per year. While other changes certainty played a role in the reduction of manure spills and water impacts (increased adoption of flow meters and automated flow shutoff systems, a change from tanks to umbilical application to reduce road traffic, and regulatory interventions) our program reviews and spill impact assessment suggest the Iowa Manure Applicator training played a role in helping improve industry performance.

Future Plans
We plan to continue refining the program by incorporating additional interactive elements and expanding hands-on learning opportunities. Future initiatives may include:
-
- Enhancing real-world application exercises by integrating on-farm training opportunities.
- Collecting and analyzing long-term data to assess the impact of training on manure management practices and environmental outcomes.
- Exploring digital and remote learning tools to reach a broader audience while maintaining interactive engagement.
Authors
Presenting & corresponding author
Daniel Andersen, Associate Professor, Iowa State University, Dsa@iastate.edu
Additional authors
Rachel Kennedy, Iowa State University
Melissa McEnany, Iowa State University
Tony Mensing, Iowa State University
Kapil Aurora, Iowa State University
Kris Kohl, Iowa State University
Additional Information
@drmanure
https://www.facebook.com/IowaManure/
https://www.extension.iastate.edu/immag/commercial-manure-applicators
Acknowledgements
Iowa DNR
The authors are solely responsible for the content of these proceedings. The technical information does not necessarily reflect the official position of the sponsoring agencies or institutions represented by planning committee members, and inclusion and distribution herein does not constitute an endorsement of views expressed by the same. Printed materials included herein are not refereed publications. Citations should appear as follows. EXAMPLE: Authors. 2025. Title of presentation. Waste to Worth. Boise, ID. April 7-11, 2025. URL of this page. Accessed on: today’s date.
Taking the Pulse: Insights into the Needs and Challenges of Iowa’s Commercial Manure Application Industry
Purpose
The Iowa commercial manure application industry plays a crucial role in advancing nutrient utilization, circularity, and water quality within agricultural systems. Effective programming requires an understanding of the industry’s needs, challenges, and perspectives to tailor information and drive behavior change.
To assess the current state of the industry, we surveyed Iowa’s commercial manure applicators to gather insights into business sizes, application capacity, client demand for manure as a cost-effective fertilizer alternative, and pricing structures. The survey served as a needs assessment, helping to align business goals with state water quality objectives. Specifically, we aimed to understand how the industry navigates market demands, regulatory pressures related to environmental stewardship (particularly water and air quality), labor, and time constraints.
What Did We Do?
A comprehensive electronic survey was sent to all 540 of the 562 commercial manure application businesses in Iowa (22 did not have an email on file). We received a response rate of 20%, providing valuable insights into the industry’s scale and operations. Key findings include:
-
- Commercial applicators handle 62% of Iowa’s 13 billion gallons of liquid manure annually and nearly 60% of its 6 million tons of solid manure.
- Manure transport costs and application expenses shape decision-making, influencing equipment selection and service pricing.
- Current industry capacity and weather-dependent application constraints affect the feasibility of meeting best management practices, such as applying manure only when the soil is 50°F and cooling to minimize nutrient loss.
By examining these trends, we aimed to identify programming opportunities that could support both industry advancements and water quality improvement goals.
What Have We Learned?
The survey results provided critical context for understanding commercial applicator decisions, including:
-
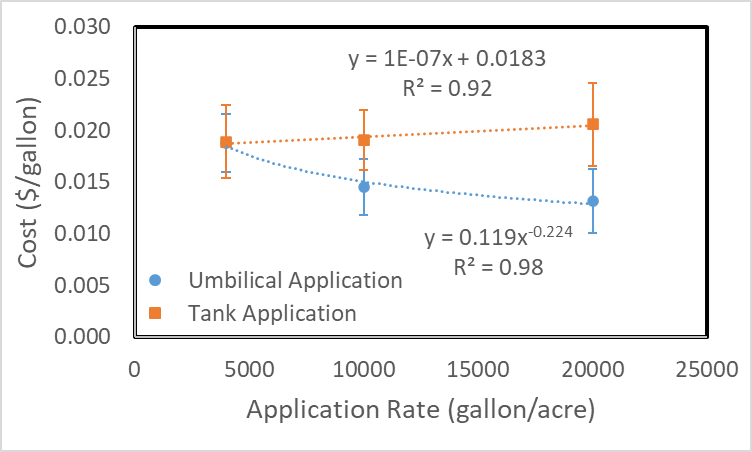
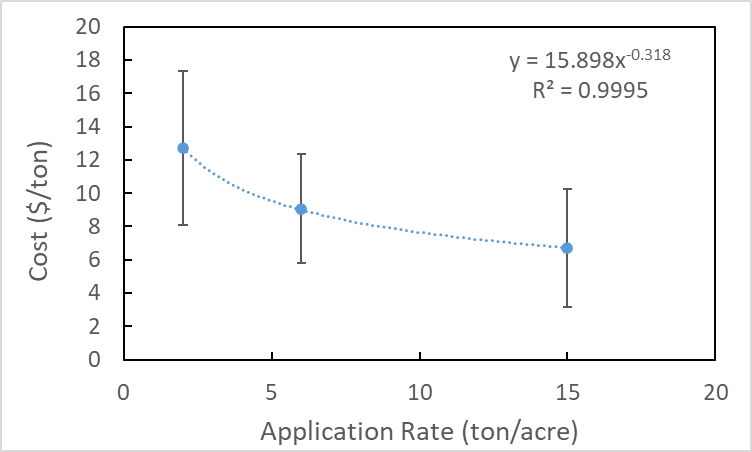
- Economic Realities – The manure application industry must remain financially viable while balancing regulatory requirements and customer needs. One of the most common questions asked by manure applicators is what people are charging for manure application. To help address this question we asked applicators what they would charge for application for three liquid manure application rates (4000 gallons/acre, 12,000 gallons/acre and 20,000 gallons/acre) meant to represent finishing swine manure, gestation-farrowing manure, and dairy manure respectively (Figure 1). For solid manure applicators we asked what they charge per ton for application rates of 2, 6, and 15 tons/acre, meant to represent layer manure, turkey litter, and bed pack cattle manure rates (Figure 2). Additionally, we asked what hauling charge was used for transporting either liquid or solid manure. The average charge for liquid manure was $0.0411 per gallon-mile, while for solid manure, the average charge was $0.40 per ton-mile. Agitation of liquid manures was generally included in the manure application price; however, if special agitation services were required (an additional agitation tractor beyond standard practice or the use of an agitation boat) an additional charge of $0.002 per gallon or around $150-300 per hour was reported.
-
- Manure Transport & Industry Size – Understanding how manure moves within the state and the cost of application informs strategic equipment investments. Solid manure transport distances were reported to average 14.5 miles while liquid manure transport was reported at 2.0 ± 1 mile.
Survey responses suggested 2050 people employed in the commercial manure application business, with 920 of these as non-seasonal employees and 1130 as seasonal employees. Overall totals align well with the number of certified commercial manure applicators in Iowa.
- Regulatory & Timing Constraints – The number of available application days under various weather conditions and the desired soil temperatures at the time of application limits application days available. It also sets a constraint on the application capacity needed to complete manure application. We surveyed how much manure could be applied daily by each company to evaluate application days needed and to evaluate how much increase in application capacity is required. Expansion could occur through either equipment sizing and employee numbers, needed to meet state water quality goals while maintaining viable businesses. On average, businesses can apply 0.6 million gallons of liquid manure per day, with a standard deviation ranging from 0.25 to 1.6 million gallons. Assuming an application rate of around 4000-gallons and acre this means manure could cover 150-acres per day per company. It would take 50 working days to apply all liquid manure in Iowa. On average, businesses apply 526 tons of solid manure per day, requiring 57 working days to apply all the solid manure in Iowa.
- Industry’s Role in Water Quality – Commercial applicators must be strategic partners in achieving water quality objectives by optimizing manure use through best application rates and timing, and incorporation of technology.
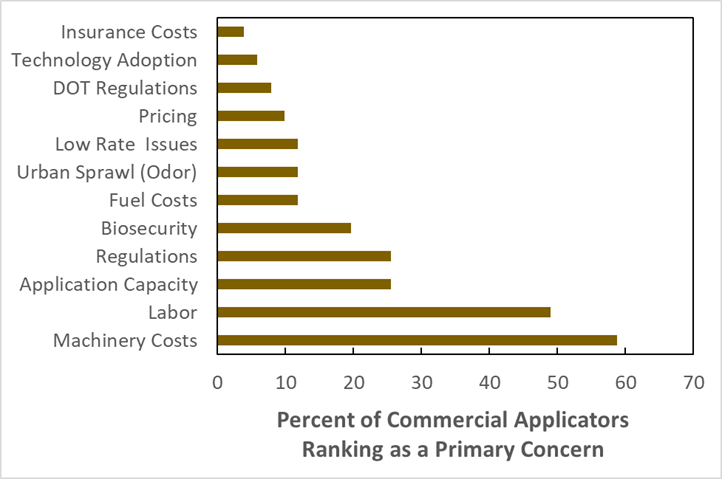
An open-ended question was asked around what challenges were for your application business over the next ten years (Figure 3). As answers were not limited, most businesses chose to list numerous concerns. These were grouped as best possible to provide categories and to help understand where future programming could address these concerns.
The primary concerns listed by most businesses were equipment costs and labor availability. Many noted how as equipment costs have increased it takes more hours of application to justify ownership and find a way to make their business cash flow, and how this has translated into repair costs that add to concerns about maintaining a business. There was an expression of how this could make it difficult for a younger generation to get into the business and make sure the industry stays sustainable. Developing materials to help facilitate those interested in developing a business plan and gallons it takes under different conditions would be a useful tool for facilitating making a business case to a lender.
- Manure Transport & Industry Size – Understanding how manure moves within the state and the cost of application informs strategic equipment investments. Solid manure transport distances were reported to average 14.5 miles while liquid manure transport was reported at 2.0 ± 1 mile.
This study underscores the importance of tailoring educational programs to meet industry needs while collaborating with policymakers to develop strategies that advance manure management practices.
Future Plans
To further support the industry and align with water quality objectives, future efforts will focus on:
-
- Developing strategic policies that support efficient manure application while maintaining business viability.
- Expanding educational programming to help applicators navigate regulatory changes and improve application timing strategies.
- Assessing infrastructure needs to determine equipment investment and business growth opportunities.
- Enhancing industry collaboration with policymakers to balance business sustainability with environmental stewardship.
Authors
Presenting & corresponding author
Daniel Andersen, Associate Professor, Iowa State University, dsa@iastate.edu
Additional authors
Melissa McEnany, Iowa State University
Rachel Kennedy, Iowa State University
Additional Information
https://www.extension.iastate.edu/immag/commercial-manure-applicators
The authors are solely responsible for the content of these proceedings. The technical information does not necessarily reflect the official position of the sponsoring agencies or institutions represented by planning committee members, and inclusion and distribution herein does not constitute an endorsement of views expressed by the same. Printed materials included herein are not refereed publications. Citations should appear as follows. EXAMPLE: Authors. 2025. Title of presentation. Waste to Worth. Boise, ID. April 7–11, 2025. URL of this page. Accessed on: today’s date.
Nutrient Runoff in a Livestock-Dense Watershed: A Case Study of the Grand Lake St. Marys Watershed
Purpose

Grand Lake St. Marys (GLSM), located in Ohio, has experienced harmful algal blooms for decades. In 2010, a massive algal bloom shut down the Lake for the entire summer season. In 2011, the GLSM watershed was declared “distressed,” requiring a new set of rules imposed upon livestock producers in the watershed. These rules required each farm that produced over 350 tons of solid manure or 100,000 gallons of liquid manure per year to create and maintain a nutrient management plan. There was also a winter manure application ban enacted, which prohibits manure application from December 15 to March 1 of each year. These rules still apply to the watershed today.
What Did We Do?

An influx of federal and state funds was poured into the watershed to assist the approximately 135 farms with constructing additional manure storage and other best management practices to improve manure management. Over 130 manure storage structures, 80 feedlot covers, 15 waste treatment systems, 20 leachate collection systems and 5 mortality compost structures were built from 2011 through 2019.

Other local efforts to improve water quality in GLSM include the restoration and creation of new wetlands to treat stream flow prior to entering GLSM. Since 2010, we have more than doubled the acreage of wetlands along the south side of the lake and have seen an incredible diversification of wildlife in the area. Additional best management practices have also been installed, such as stream restoration projects, saturated buffers, tile phosphorus filters, double cropping, cover crops and much more. Mercer County has also expended a considerable amount of effort to research manure nutrient recovery technologies throughout the last six years. Manure nutrient recovery is challenging due to cost; however, many technologies can achieve a 90+% recovery of phosphorus from manure.
What Have We Learned?
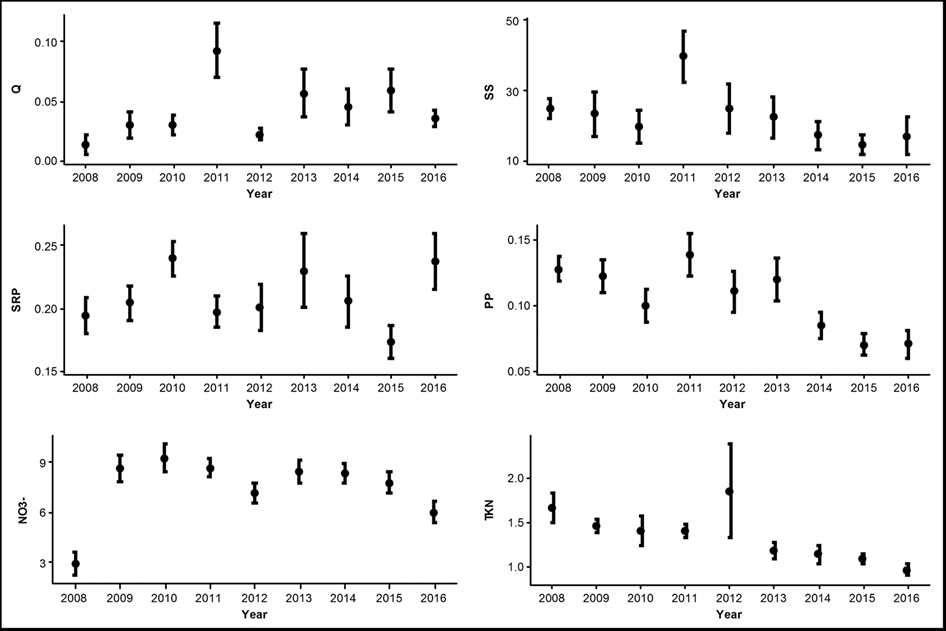
Long-term monitoring data is collected on two streams feeding GLSM, Chickasaw Creek (installed in 2008) and Coldwater Creek (installed in 2010). The data from Chickasaw Creek was used to determine the effects of the best management practices installed along with the effects of the winter manure application ban. The data showed a reduction of 10-40% of nitrogen and phosphorus because of these improved practices (Figure 1).
Future Plans
Nutrient management planning is an ongoing effort in the Grand Lake St. Marys watershed and will continue as long as the watershed remains distressed. Research and collaboration continue on manure nutrient recovery and development and adoption of technologies. Monitoring of stream and effectiveness of treatment wetland will also continue to ensure that maintenance and management is conducted appropriately. Additional conservation projects, including wetlands, stream restoration and more are planned in the coming years.
Author
Theresa A. Dirksen, PE, Mercer County, Ohio Agriculture & Natural Resources Director
Additional Information
Jacquemin, Stephen J., Johnson, Laura T., Dirksen, Theresa A., McGlinch, Greg. “Changes in Water Quality of Grand Lake St. Marys Watershed Following Implementation of a Distressed Watershed Rules Package.” Journal of Environmental Quality, January 12, 2018.
Jacquemin, Stephen J., McGlinch, Greg, Dirksen, Theresa, Clayton, Angela. “On the Potential for Saturated Buffers in Northwest Ohio to Remediate Nutrients from Agricultural Runoff.” PeerJ, April 12, 2020.
Link to wetland monitoring data summaries: https://lakeimprovement.com/knowledge-base/
Acknowledgements
Dr. Stephen Jacquemin, Wright State University Lake Campus
Mercer Soil and Water Conservation District
Grand Lake St. Marys Restoration Commission
The authors are solely responsible for the content of these proceedings. The technical information does not necessarily reflect the official position of the sponsoring agencies or institutions represented by planning committee members, and inclusion and distribution herein does not constitute an endorsement of views expressed by the same. Printed materials included herein are not refereed publications. Citations should appear as follows. EXAMPLE: Authors. 2022. Title of presentation. Waste to Worth. Oregon, OH. April 18-22, 2022. URL of this page. Accessed on: today’s date.
Evaluation of Agricultural Nutrient Management Technologies at Vermont Natural Ag Products, Middlebury, Vermont
Purpose
The objective of this study was to evaluate nutrient dynamics and operational costs within an existing manure Compost Aeration and Heat Recovery system (CAHR) by Agrilab Technologies, Inc. at the Vermont Natural Ag Products (VNAP) compost facility in Middlebury, Vermont in comparison to conventional windrow manure composting where aeration only occurs via turning. Constructed in 2016 and 2017, the CAHR has been fully operational since 2018 and has proven effective at reducing VNAP’s expenditures on #2 heating oil, propane, diesel fuel, and labor (Foster et al., 2018).
The basic design of the CAHR system includes compost windrows placed on a paved pad containing a shallow trench oriented longitudinally with the windrow. The trench contains perforated High Density Poly Ethelene (HDPE) piping bedded in wood chips. These pipes are connected to solid, insulated HDPE piping which runs to a shipping container outfitted with circulation fans and a heat exchanger. While the circulation fans are negatively aerating (i.e., pulling vapor from) the compost, warm vapor entering the system transfers heat energy to water piped through the heat exchanger. Heat recovered from compost windrows has been used to heat the site’s bagging building via radiant floor heating and to dry finished compost prior to the screening and bagging process. Furthermore, due to elevated oxygen levels provided by positive and negative aeration, CAHR-treated compost has been reported to mature more quickly and require less turning, reducing diesel, labor, and equipment maintenance costs (Foster et al., 2018).
What Did We Do?
Two compost windrows of equivalent feedstock contents and ratios were monitored. Our control, denoted as “TRAD”, was a conventionally treated windrow that did not receive aeration aside from periodic windrow turning with a Komptech Topturn x53 compost turner. Our experimental windrow, denoted as “CAHR”, received periodic positive and negative aeration via the CAHR system, as well as aeration through periodic turning. The initial volumes of the TRAD and CAHR windrows were 480.2 CY and 548.8 CY, respectively.
Compost samples were collected between August 24th, 2021 and December 15th, 2021. For the first thirteen weeks of the sampling period, samples were taken thrice weekly from both treatments. At the end of the thirteenth week, on November 19th, VNAP staff deemed the CAHR treatment compost suitable for market and it was pulled for processing. Sampling continued once weekly for the TRAD treatment for another four weeks, terminating on December 15th, when the TRAD windrow was pulled for processing. This resulted in a total of 43 samples of TRAD and 39 samples of CAHR composts.
What Have We Learned?
This study evaluated nutrient status, financial cost, and energy cost for a pair of commercial compost windrows in a normal production setting. From a time and space management standpoint, compost treated with a forced-aeration system was deemed suitable for market in approximately 75% of the time as a conventionally turned windrow; 13 and 17 weeks, respectively. Analysis of nitrogen species status throughout the study suggests that greater nitrogen losses occurred during conventional treatment than during CAHR treatment, presumably due to higher rates of denitrification and ammonia volatilization. Data also suggest a lower risk for phosphorus loss through leaching from CAHR-treated compost, as water extractable phosphorus (WEP) concentrations were consistently higher in the conventional treatment. During the active composting process, it was found that operational costs for CAHR compost were 2.1 times more expensive financially and 5.5 times more energy-intensive than a conventional compost on a per CY basis. However, the energy and infrastructure cost offsets provided by the CAHR system (as operated at VNAP) could provide a net savings of $4.06/CY finished compost. In this study, with paired windrows of approximately 12 feet in width, it was shown that a CAHR system produced a comparable compost product, with higher operational input, in less time.
Furthermore, the data suggest that land application of either compost treatment evaluated in this study may reduce phosphorus loss due to leaching versus direct manure application. For example, WEP concentrations in the finished composts in this study ranged between 0.256 and 0.304 g/kg on a dry weight basis, while WEP concentrations in dairy manures have been found to range between 1.98 and 4.0 g/kg (P. Kleinman et al., 2007; P. J. A. Kleinman et al., 2005). It is probable that either compost treatment, when applied to agricultural land, would release less phosphorus as WEP during rainfall events than direct manure application, providing water quality benefits.
Future Plans
The Newtrient CIG will continue to evaluate 13 more technologies over the next 2 years to determine their effect on water quality.
Authors
Mark Stoermann, Chief Operating Officer, Newtrient LLC
Corresponding author email address
Mstoerm@newtrient.com
Additional authors
Finn Bondeson, Graduate Student, University of Vermont; Joshua Faulkner, Research Assistant Professor and Farming and Climate Change Program Coordinator, University of Vermont; and Eric Roy, Assistant Professor, Interim Director of Environmental Sciences Program, University of Vermont
Additional Information
Newtrient.com
The authors are solely responsible for the content of these proceedings. The technical information does not necessarily reflect the official position of the sponsoring agencies or institutions represented by planning committee members, and inclusion and distribution herein does not constitute an endorsement of views expressed by the same. Printed materials included herein are not refereed publications. Citations should appear as follows. EXAMPLE: Authors. 2022. Title of presentation. Waste to Worth. Oregon, OH. April 18-22, 2022. URL of this page. Accessed on: today’s date.
Evaluating Dry Manure Storage Options for Water Quality Protection in Western Washington
Purpose
The purpose of this project was to collect local on-the-ground data to evaluate the effectiveness of different manure storage options installed on working farms in King County, Washington. Agricultural areas in King County receive over 40 inches of rain annually with most of it falling between the months of October through March. During this time, farms often store and compost their manure for spring and summer field application. Composting livestock manure and waste can produce a valuable resource for land managers. However, if managed improperly, manure leachate and runoff can contaminate ground and surface water resources posing a risk to humans and other wildlife.
The project aimed to collect data on water quality and manure quality under different solid manure storage options during the fall and winter months. During the project, we worked with two farms to monitor water quality and manure quality as well as held education and outreach events to engage with stakeholders about benefits and/or costs of adopting new manure management BMPs.
What Did We Do
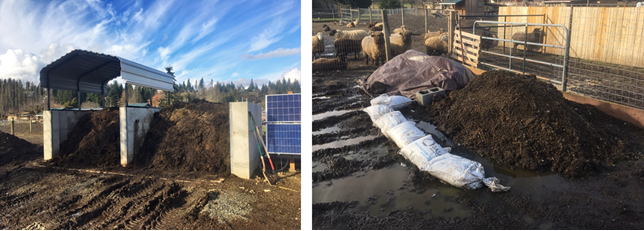
For the project, we worked with two farms and established four manure storage areas on each including: a concrete slab with walls and a roof, concrete slab with walls and no roof, a compacted soil areas with a tarp cover, and a compacted soil area with no cover. The manure piles were managed by the farmer following common winter practices and were turned and added to 2-3 times per month. We monitored the temperature of the piles over time to assess their composting activity, although it was not a primary focus of our study.
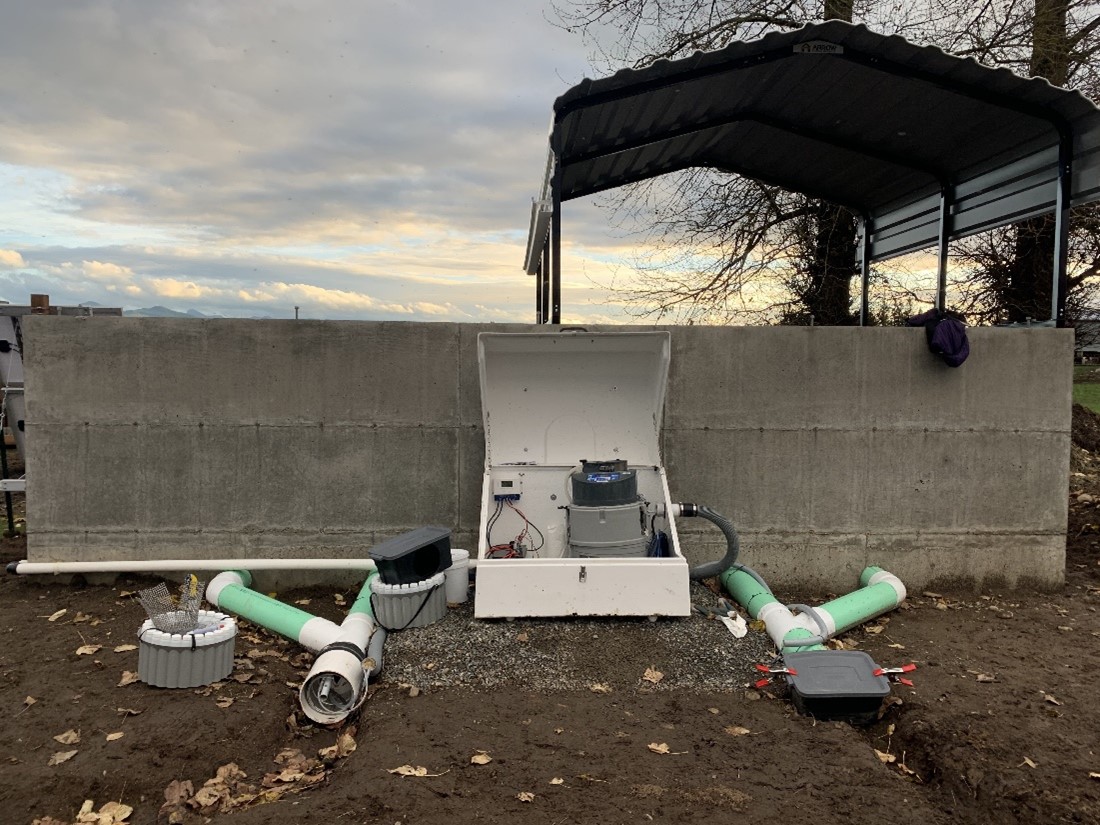
We collected samples of the manure from each storage area during the project to monitor changes over time. To assess nutrient loss and pollution via a stormwater runoff pathway, we collected runoff from the concrete slabs. To assess nutrient loss and pollution via a leaching pathway, we collected soil samples, from under the compacted soil areas. This monitoring allowed us to compare the storage options. The study was conducted over the course of eight months from October 2020 through May 2021. Below are photos of our study setup. Stormwater runoff water quality samples were collected using an ISCO automated sampler that was programmed to grab samples during rain events that generated runoff from the manure piles. Soil and manure samples were collected on a monthly basis.
What Have We Learned
The project results support the conclusion that the covering of solid manure piles had positive environmental benefits. Covered manure piles stored on a concrete slab have less stormwater runoff with lower loads of nutrients in the leachate than uncovered manure piles on a concrete slab. The covering of dry manure piles stored on compacted soil surfaces reduced the leaching of nutrient, particularly nitrate and nitrite, from manure piles into the soil. It also created a better manure end-product by allowing higher heat values to be reached and creating a drier end product. Additionally, the
placement of manure on a non-permeable, concrete surface eliminated the leaching of manure nutrients below the piles. Covered manure piles, whether stored on a concrete slab or dirt, tended to be drier and have higher temperatures, which results in a better composted manure product.
The results of this study demonstrated that the type of animal species and pile management (how often the pile was turned or added to) also greatly affected the nutrient composition of the leachate. For instance, at Site A, there was higher TP in the manure, and thus higher TP in the runoff water quality and in soil samples.
Future Plans
Due to the short duration of the project, we pursued and were awarded additional funding to extend the project and expand the data set to allow for more robust statistical analysis and conclusions. Partner agencies and organizations as well as the farmers have expressed support and interest in continuing this research, and the project Steering Committee members have also expressed interest in further participation.
In future studies, we intend to try to better quantify the flow volumes from manure piles stored on slabs. In addition, we intend to better assess leaching potential underneath the manure piles stored on soil by using lysimeters to measure leachate volumes.
Authors
Presenting Author
Scarlett Graham, Conservation Research Specialist, Whatcom Conservation District
Corresponding Author
Laura Redmond, Landowner Incentive Program Coordinator, King Conservation District
laura.redmond@kingcd.org
Additional Authors
Addie Candib, Pacific Northwest Regional Director, American Farmland Trust
Additional Information
American Farmland Trust website: https://farmland.org/project/south-puget-sound-discovery-farms/
Acknowledgements
Dr. Nichole Embertson, PhD, Dairy Sustainability at Starbucks (formerly worked at the Whatcom Conservation District)
Videos, Slideshow and Other Media
South Sound Discovery Farms® Project
The authors are solely responsible for the content of these proceedings. The technical information does not necessarily reflect the official position of the sponsoring agencies or institutions represented by planning committee members, and inclusion and distribution herein does not constitute an endorsement of views expressed by the same. Printed materials included herein are not refereed publications. Citations should appear as follows. EXAMPLE: Authors. 2022. Title of presentation. Waste to Worth. Oregon, OH. April 18-22, 2022. URL of this page. Accessed on: today’s date.
Swimmers beware, land application of manure can increase antibiotic resistance downstream
A summary of Catchment-scale export of antibiotic resistance genes and bacteria from an agricultural watershed in central Iowa by Neher et al. 2020
Key points
- With some year-to-year variation, manure application increased antibiotic resistance surface water downstream of application site.
- The CAMRADES team, led out of Iowa State University, will be expanding efforts to monitor and model AMR in agricultural watersheds in the region.