Estimation of phosphorus loss from agricultural land in the Southern region of the USA using the APEX, TBET, and APLE models

Purpose

The purpose of our work was to determine, within the southern region (AL, AR, FL, GA, KY, LA, MS, NC, OK, SC, TN, and TX), the feasibility of using different models to determine potential phosphorus loss from agricultural fields in lieu of phosphorus indices.

What did we do? 

We have collected water quality and land use data from plot- and field-scale experiments throughout the South (AR, GA, MS, NC, OK, and TX). The water quality data provide information on runoff rates, phosphorus concentrations, and phosphorus loads. The land use data provide information on both management practices, including the amount of phosphorus applied as fertilizer and/or manure and tillage, as well as inherent properties such as rainfall, soil series, etc. Once we obtained this information, we used the data to run the Agricultural Policy / Environmental eXtender (APEX), Texas BMP Evaluation Tool (TBET), and Annual Phosphorus Loss (APLE) models, in both uncalibrated and calibrated modes.

What have we learned?            

Models predicted runoff accurately, but were unable to predict sediment or phosphorus losses accurately in many cases. Not surprisingly, models performed better when calibrated but even so predictions were problematic for particular locations and constituents (e.g. runoff in NC under no-tillage conditions and sediment at many sites).

Future Plans

We continue to determine factors affecting the poor predictions of certain constituents (e.g. sediment or phosphorus) in different data sets and models. Calibration will continue for APEX and TBET. In addition, state phosphorus indices are being run for each data set. The results from each state’s phosphorus index will be compared against the modeled data as well as other state indices in order to learn if models such as APEX, TBET, and/or APLE can better determine field phosphorus losses than the indices. Final recommendations will be provided to USDA-NRCS.

Authors

Deanna Osmond, Professor, NC State University, Soil Science Department deanna_osmond@ncsu.edu

David Radcliffe and Adam Forsberg (University of GA), John Ramirez-Avila (MSU), Carl Bolster (ARS); Dan Storm and Aaron Mittelstet (OSU)

Additional information              

This is part of a symposium.

Acknowledgements      

Thanks to our sponsor, USDA-NRCS grant 69-3A75-12-182.

The authors are solely responsible for the content of these proceedings. The technical information does not necessarily reflect the official position of the sponsoring agencies or institutions represented by planning committee members, and inclusion and distribution herein does not constitute an endorsement of views expressed by the same. Printed materials included herein are not refereed publications. Citations should appear as follows. EXAMPLE: Authors. 2015. Title of presentation. Waste to Worth: Spreading Science and Solutions. Seattle, WA. March 31-April 3, 2015. URL of this page. Accessed on: today’s date.

Phosphorus Indices: What is the water quality goal?

Phosphorus indices provide relative loss ratings that then have a corresponding management response.  Because most state Phosphorus Indices are qualitative it is not clear how the relative loss rating corresponds to actual phosphorus inputs into the receiving water and how the receiving water would react to these additions.  Even with qualitative Phosphorus Indices, unless the water resource has a specific Total Maximum Daily Load, it is not clear how losses correspond to water quality outcomes.  These issues will be discussed in the context of the 590 Natural Resources Conservation Standard for nutrient management.

Why Examine the Phosphorus Index?

The purpose of our work was to determine, within the southern region (AL, AR, FL, GA, KY, LA, MS, NC, OK, SC, TN, and TX), the relationship between state P-Index ratings to measured water quality P losses, and each other.

What did we do? 

We have collected water quality and land use data from plot- and field-scale studies throughout the South (AR, GA, MS, NC, OK, and TX). The water quality data provide information on runoff and P concentrations and loads. Land use data provide information on management practices, including the amount and timing of P applied as fertilizer and/or manure and tillage, as well as site characteristics such as rainfall, soil series, and crop or forage management. This information was used to run each southern P Index. Four of the indices are considered component, in that the rating is in lbs P/ac/year. The remaining eight P Indices are either additive or multiplicative and final ratings are qualitative. We then compared the state ratings against each other and against the total and soluble P loads that were measured from each study site. In order to compare load losses with qualitative P indices, measured total P loads were transformed based on USDA-NRCS tentative guidelines of Low (0-2 lb P/ac), Medium (2-5 lb P/ac), and High (>5 lb P/ac) P loss.

What have we learned?            

When we compared the data, there were expected differences between state-P Indices for the same set of data, but there was often considerable uniformity. However, what was less clear is what the P-Index ratings mean for water quality protection. The analysis left us with many difficult questions on how to relate edge-of-field P loss to more complex in-stream or lake P criteria and thresholds.

Future Plans 

To answer these questions, we are going to run state P Indices in different modes: against annual water quality and land treatment data; against averaged water quality and land treatment data; using erosion rates from sediment generated from the experiment, and; using erosion rates using RUSLE2. We will compare these P Index ratings against each other, the water quality data, USDA-NRCS ratings, and EPA ecosystem nutrient criteria, to help us better understand the relative value of P Indices in protecting water resources.

Authors

Deanna Osmond, Department Extension Leader, NC State University Soil Science Department deanna_osmond@ncsu.edu

C. Bolster, M. Cabrera, S. Feagley, B. Haggard, C. Mitchell, R. Mylavarapu, L. Oldham, A. Sharpley, F. Walker, and H. Zhang

Acknowledgements      

Thanks to our sponsor, USDA-NRCS grant 69-3A75-12-182.

The authors are solely responsible for the content of these proceedings. The technical information does not necessarily reflect the official position of the sponsoring agencies or institutions represented by planning committee members, and inclusion and distribution herein does not constitute an endorsement of views expressed by the same. Printed materials included herein are not refereed publications. Citations should appear as follows. EXAMPLE: Authors. 2015. Title of presentation. Waste to Worth: Spreading Science and Solutions. Seattle, WA. March 31-April 3, 2015. URL of this page. Accessed on: today’s date.

Evaluation of Feed Storage Runoff Water Quality and Recommendations on Collection System Design

Why Study Silage Leachate?

Silage storage is required for many livestock and poultry facilities to maintain their animals throughout the year.  While feed storage is an asset which allows for year round animal production systems, they can pose negative environmental impacts due to silage leachate and runoff.  Silage leachate and runoff have high levels of oxygen demand and nutrients (up to twice the strength of animal manure), as well as a low pH posing issues to surface waters when discharged.  Although some research exists which shows the potency of silage leachate and runoff, little information is available to guide the design of collection, handling, and treatment facilities to minimize the impact to water quality.  Detailed information to characterize the strength of the runoff through a storm is needed to develop collection systems which segregate runoff to the appropriate handling and treatment system based on the strength of the waste. 

What did we do?

In order to evaluate collection designs, we evaluated six bunker silage storage systems in Wisconsin.  Runoff from these systems was collected using automated samplers throughout one year to assess water quality for nutrients (nitrogen and phosphorus species), oxygen demand, total solids, and pH.  Flow rate for each system was also recorded along with weather data including precipitation information.  Feed quantity and quality was also recorded at each site to have a better understanding of the impact of silage management on water quality.  Data was analyzed to determine flow weighted average runoff concentrations for pollutants measured, seasonality and feed impacts to water quality, storage design impacts, the presence or absence of first flush conditions, total loading, and evaluated to make collection design recommendations.

What have we learned?

Flow rate, timing of ensiling of forage, site bunker design, and amount of litter present were determined to influence silage runoff concentrations.  Leachate collection played a significant role in water quality as the runoff from the site without leachate collection had a lower average pH (4.64) and higher COD values (5,789 mg L-1) than the sites with leachate collection (6.09 and 5.54 pH, and 1,296 and 3,318 mg L-1 COD).  Nutrients were also higher for the site without leachate collection TP (83 mg L-1), NH3 (68 mg L-1), and TKN (222 mg L-1) compared to TP (29 and 63 mg L-1), NH3 (25 and 48 mg L-1), and TKN (184 and 215 mg L-1) for the sites with leachate removal. Time of ensilage also played an important role in water quality with increased losses occurring within two weeks of ensilage.  The most important finding for the design of treatment systems was that the water quality parameters (including nutrients) were found to be negatively correlated with flow.   The resulting effect is that the storms hydrograph has a significant impact on the pollutant loading to the surrounding waterways.  It was also found that loading was relatively linear throughout each storm event indicating that there is no first flush phenomenon which is found to occur with urban runoff systems.  Therefore designing systems to collect the initial runoff from a system is not an efficient way to capture the greatest pollutant load.  It was found that low flows throughout a storm have high pollutant concentrations and collecting low flows throughout a storm would result in the greatest load collected per unit volume.

Future plans

The next phase of this research will be to develop loading recommendations to filter strips for sizing and minimizing impact to the environment.

Corresponding author

Rebecca Larson, Assistant Professor and Extension Specialist, Biological Systems Engineering, University of Wisconsin-Madison ralarson2@wisc.edu

Mike Holly, Eric Cooley, Aaron Wunderlin

Additional information

Published paper is currently in review and will be available within the next year.

Acknowledgements

Wisconsin Discovery Farms

Using Whole Farm Walkovers to Prioritize Soil and Water Management with Farmers and Evaluate Watershed Resource Condition


Purpose

Each farm uniquely contributes toward collective water quality passing through and leaving their neighborhood.  University of Wisconsin – Discovery Farms research shows that critical sites, critical times, and critical conditions play a major role in loss of sediment and nutrients from farmland.  Critical site losses can contribute the majority of whole farm annual sediment and nutrient loss, and very often, single-large event storms can be the source of almost all loss from a farm in any given year.  Identifying critical areas, and how they are being managed, is step one toward maintaining soil productivity and minimizing sediment and nutrient loss within agricultural watersheds.

To understand and reduce agriculture’s environmental footprint, there needs to be accurate documentation of what’s currently happening on the land and how the current farming system is impacting water quality.  UW – Discovery Farms has been working with farmers to conduct whole farm walkovers to document and better understand the effectiveness of their farming system toward minimizing sediment and nutrient loss from cropland.
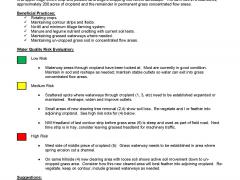
example text from a farm walkoverWhat we did

The UW – Discovery Farms Program and Yahara Pride Farms, a non-profit organi­zation dedicated to improving water quality of the Yahara River wa­tershed in south central, Wisconsin, have worked with more than 60 farmers in three Wisconsin watersheds to conduct whole farm walkovers (2012-2014).   This process helped prioritize soil and water management on individual farms by raising awareness of critical site locations and what their current condition is.  On a watershed scale, whole farm walkovers also help to evaluate watershed resource conditions at a particular point in time.

Whole farm walkovers evaluated cropland and other farmland areas, identifying critical sites where significant loss of sediment and/or nutrients either could occur, or was actively occurring.  This concept is producer derived and producer desired, and was not meant to take the place of agency plans.

figure 2. example map from a walkoverA simple “stop-light” scoring process was used to attach qualitative scores to critical sites that posed risk for sediment or nutrient loss as follows: 1) Green  – areas with excellent or very good management (no changes required); 2) Yellow – areas that need some improvement over a period of 1 – 5 years; and 3) Red – areas that need improvement within the next 12 -18 months.

Walkovers were summarized into two-page color-coded text and map documents (Fig. 1 and 2).  This information identified the risk of sediment or nutrient loss with a rank based on the green-yellow-red criteria.  It also documented practices that farmers were currently using that protect water quality.  This information was shared with each farmer to ensure that the evaluation identified all of the critical areas on their farm.  Areas that need improvement were discussed and strategies developed to secure additional assistance where necessary.

What we learned

This concept is producer derived and producer desired.  Farmer feedback has helped improve the deliverables and keep the process practical.  Farmers have welcomed staff to walk their land and consult back with an honest discussion, helping them understand critical sites they manage.  Many “yellow and red” areas identified within cropland were corrected even before staff could return to the farm with summarized information.  This validates the importance of 1:1 on-farm interactions and the value farmers attached to the walkover process.  Whole farm walkovers have helped farmers begin planning repairs to actively contributing critical sites, and consider land management changes to minimize sediment and nutrient loss from their property.

Results from two different watersheds show approximately 75% of farmland is being managed very well, with minimal risk of losing sediment or nutrients; 20% needs some attention and conservation repair; and approximately 2% was showing significant risk, with most of that existing outside of cropland areas.  The general breakdown is similar between the two watersheds, with differences in the details and kind of yellow and red critical areas, reflecting local landscapes and farming systems.  A summary follows:

Watershed DR had 9,923 acres of farmland evaluated for 27 farmers on 85 tracts of land.  A total of 250 critical areas were identified in this glaciated, long sloped landscape influenced by corn-soybean crop rotations and a small number of active dairy farms, with breakout as follows:

  • (78%) green;
  • (20%) yellow – most categorized as concentrated water flow areas.  Other “yellows” included stream corridor, livestock areas, un-cropped upland areas, and manure piles;
  •  (< 2%) red – all categorized within stream corridors.

Watershed JV had 4,816 acres of farmland evaluated for 33 farmers on 54 tracts of land.  A total of 599 critical areas were identified in this unglaciated, steeper sloped landscape influenced by dairy / forage based farming systems, with breakout as follows:

  • (76%) green;
  • (21%) yellow – most categorized as concentrated water flow areas.  Other “yellows” included entry from cropland concentrated flow into non-cropland, un-cropped upland areas, livestock areas, and stream corridor;
  • (2.5 %) red – most categorized as un-cropped upland.  Other “reds” included concentrated flow areas, and livestock areas.

Future plans

We will teach this process to crop consultants, farmer groups, soil and water conservation professionals, and farmers to empower them with a proactive way to identify local critical sites and respond by choosing practical soil, water and nutrient management practices that work within their regional neighborhood and within their chosen farming systems.

Authors

Kevan Klingberg, and Todd Prill

Outreach Specialist, kevan.klingberg@ces.uwex.edu, and Watershed Coordinator, discovery.farms.prill@gmail.com, respectively, University of Wisconsin –Extension, Discovery Farms Program, PO Box 429, Pigeon Falls, WI, 54760, www.uwdiscoveryfarms.org.

Additional Information

Example walkover and map

http://www.uwdiscoveryfarms.org

The authors are solely responsible for the content of these proceedings. The technical information does not necessarily reflect the official position of the sponsoring agencies or institutions represented by planning committee members, and inclusion and distribution herein does not constitute an endorsement of views expressed by the same. Printed materials included herein are not refereed publications. Citations should appear as follows. EXAMPLE: Authors. 2015. Title of presentation. Waste to Worth: Spreading Science and Solutions. Seattle, WA. March 31-April 3, 2015. URL of this page. Accessed on: today’s date.

Using Solar Power to Provide Animals with Water while Protecting Water Quality


Why Consider Solar Power for Watering Livestock?

The purpose of this paper and presentation is to show how we have been using solar powered watering stations to provide a clean water supply to livestock while also protecting water resources. The project was started as a way to assist farmers who had received funding from some federal or state agencies to improve water quality on and through their land. One way to improve water quality is to fence livestock out of local waterbodies. As a result of this practice, the farmer may lose the ability to water his/her livestock.  A secondary reason for the project was, since livestock did not have direct access to water, the farmer had to either carry water to the watering stations or use some form of energy (diesel, gasoline, electric) to provided needed water.

What did we do?

To help solve the problem, funding was received from USDA-NRCS through the Conservation Innovation Grant Program (CIG) to install solar powered livestock watering stations. Farmers were selected based on information from NRCs field personnel, County Extension Agents and other groups working with farmers to fence livestock out of the waterbodies. The first steps were to visit with the farmers to determine need for a solar powered watering station.

Through a first set of questions, it was determined: 1) if the farmer needed the watering station; 2) where the watering station would be located; 3) was there an existing well and pump and what was the source of energy?;  4) what would be the preferred energy source based on available electricity; and 5) would there be a solar system that could be designed to meet the need of the farmer (an initial design).

To further discuss these steps, we looked to see if the farmer needed the watering station. Was there was a means to put in a limited access watering spot so water was still available on a limited basis and still help with protecting water quality? The location of the watering station was determined based on plans to rotationally graze the pasture where the livestock would be located. If the livestock were to be rotated through a number of different paddocks, the suggestion would be to locate the watering station in the center of a rotation. Alternatively, could a solar powered pumping system be located in one place and pump water to various watering stations on the property? The third aspect of the initial planning process was to determine if there was an existing well or pump. If there was an existing well and pump, what was the source of power for the pump? If diesel or gasoline was being used, what was the cost of such a system on an annual basis? The next aspect asked if there was available electric power for a pump? If the answer was “Yes, there is power less than one-quarter mile” then it was suggested the farmer consult with the local power utility to determine the cost of running power to the proposed pumping location. Another aspect of this step in the process was where would the water source be and would solar even be viable due to shade or tree cover? The last aspect of the determination of using solar power was the ability of us to design a system based on the number of livestock that had or needed to be watered and the depth of the well (if currently in place), expected depth to groundwater, height from a surface water source to highest and most distant watering station, and distance of having to run pipe from water source to most distant watering station. If after going through all of these aspects with the farmer, it was determined that a solar powered watering system was a good option for the farmer, we worked with him or her to fully design a solar powered watering system, ordered the solar components and helped the farmer install the system.

What have we learned?

From this project we have learned that there are some locations that are not good for a solar powered watering systems due to location, distance to available power and economics. Most of the times when the system was determined to be non-economical, it was due to there being electric power within a short distance of the proposed solar installation site. Short distance here is defined as any distance that makes running electricity to the proposed water source location economically preferable to that of installing solar power. Sometimes location was not a good fit in that there was very little open space to install a solar powered system for pumping the water. Another thing we have learned is that the solar powered system needs to be protected or at least in a location where livestock cannot get to the panels and control boxes. In cases where small livestock are being watered, having the solar panels on poles above their height can be beneficial in providing maintenance for grass control. However, for larger livestock, the support structure and solar panels themselves can become scratching posts which can result in broken solar panels. One other thing we have learned is that based on the needs or direction of the local NRCS working groups, solar powered watering systems may or may not be included in the cost share options for farmers.

Future Plans  

Future plans are to work with County Extension Agents, NRCS, farmers and other groups promoting the use of solar powered systems for watering livestock in areas where this technology can protect water quality.

Author     

Gary L. Hawkins, Water Resource Management and policy Specialist and Assistant Professor, University of Georgia, Crop and Soil Science ghawkins@uga.edu

Additional information                

For more information please contact ghawkins@uga.edu

Sun-powered water source. Angus Journal. July 2013. Anderson, B.B.

Acknowledgements     

Thanks to Mr. Gary Murphy for his assistance in installing and demonstrating the solar system in many different venues. Thanks also is extended to USDA-NRCS for funding the projects through the CIG program.

The authors are solely responsible for the content of these proceedings. The technical information does not necessarily reflect the official position of the sponsoring agencies or institutions represented by planning committee members, and inclusion and distribution herein does not constitute an endorsement of views expressed by the same. Printed materials included herein are not refereed publications. Citations should appear as follows. EXAMPLE: Authors. 2015. Title of presentation. Waste to Worth: Spreading Science and Solutions. Seattle, WA. March 31-April 3, 2015. URL of this page. Accessed on: today’s date.

Environmental Protection Agency (EPA) Perspective on Nutrient Pollution

Waste to Worth: Spreading science and solutions logoWaste to Worth home | More proceedings….

Why Discuss Regulations and Nutrient Pollution?

Provide EPA’s perspective on nutrient pollution and encourage an open dialogue to help address this problem which is rapidly becoming one of the most challenging environmental problems that we face.

What Did We Do?

Although nutrients, nitrogen and phosphorus in particular, are essential for aquatic life, too many nutrients can create significant problems for our nation’s lakes, streams, and coastal waters.  Nutrient pollution can degrade habitat for fish and wildlife, render water bodies unsafe for swimming and other forms of contact recreation, create a public health concern for drinking water supplies, decrease property values, and negatively impact local economies.  According to national statistics, more than 45% of streams have medium to high levels of nutrients, approximately four million lake acres have been identified as threatened or impaired, and approximately 78% of assessed coastal areas exhibit signs of eutrophication.

Nutrients can be transported great distances and impact areas far downstream.  One of the more prominent examples in the United States is the Gulf of Mexico “dead zone,” which can be larger than the state of Connecticut in some years.  The term “dead zone” refers to waters that have been so heavily impacted by nutrient pollution that oxygen levels are depleted to the point where most aquatic life cannot survive.  Nutrients are transported to the Gulf of Mexico via tributaries of the Mississippi River from as far away as Montana in the west and Pennsylvania in the eastern portion of this large watershed.

Nutrient pollution is not restricted to the Mississippi River Basin or any one region of the country.  Nutrient pollution is widespread, impacting waters across the nation.  As we learn more about the impacts of nutrient pollution, especially the potential for some species of algae to produce toxins that can be harmful to both people and animals, states are becoming more aggressive in reducing sources and even posting health advisories when necessary.

So, what has EPA been doing to address nutrient pollution?

  1. Providing states with technical assistance and other resources to help develop water quality criteria for nitrogen and phosphorus;
  2. Working with states to identify waters impaired by nutrients and developing restoration plans;
  3. Awarding grants to states to address pollution from nonpoint sources, such as agriculture and storm water runoff;
  4. Administering a permit program designed to reduce the amount of nitrogen and phosphorus discharged to the environment from point sources;
  5. Providing funding for the construction and upgrade of municipal wastewater treatment plants;
  6. Working with states to reduce nitrogen oxide emissions from air sources;
  7. Conducting and supporting extensive research on the causes, impacts, and best approaches to  reduce nutrient pollution; and
  8. Increasing collaboration with other federal partners (e.g., USDA) to leverage financial and technical resources.

And although progress has been made over the past decade, much more is needed.  Realizing a need for greater action, In March 2011, EPA issued a memorandum titled “Working in Partnership with States to Address Phosphorus and Nitrogen Pollution through Use of a Framework for State Nutrient Reductions.”  This memo emphasized that nutrient pollution continues to have the potential to become one of the costliest and most challenging environmental problems that we face and reaffirmed the agencies commitment to partner with states and stakeholders to make greater progress in reducing nutrient loading to our nation’s waters.  If you have not already done so, please join us in protecting and restoring our nation’s waters.  For more information visit EPA’s nutrient pollution website at http://www.epa.gov/nutrientpollution/.

Author

Alfred Basile, Biologist, US Environmental Protection Agency Region 8, basile.alfred@epa.gov

Additional Information

www.epa.gov/nutrientpollution

The authors are solely responsible for the content of these proceedings. The technical information does not necessarily reflect the official position of the sponsoring agencies or institutions represented by planning committee members, and inclusion and distribution herein does not constitute an endorsement of views expressed by the same. Printed materials included herein are not refereed publications. Citations should appear as follows. EXAMPLE: Authors. 2013. Title of presentation. Waste to Worth: Spreading Science and Solutions. Denver, CO. April 1-5, 2013. URL of this page. Accessed on: today’s date.


The Role of Computer Models in Environmental Phosphorus Management

Waste to Worth: Spreading science and solutions logoWaste to Worth home | More proceedings….

Why Model Agricultural Phosphorus?

Computer models are excellent ways to integrate years of scientific research into decision tools that producers and policy makers can use to reduce the environmental impact of agricultural phosphorus. Models are playing more important roles in efforts to manage phosphorus at the farm and watershed scales, so it is increasingly important to make sure models are well developed to meet the needs of users, give reliable predictions, and are consistently updated to keep pace with scientific knowledge.

What Did We Do?

Our research over the past 10 years has concentrated on developing scientifically sound, reliable models that can be used to better manage agricultural phosphorus. This includes developing state-of-the-art models for soil phosphorus cycling and loss to the environment in surface runoff and leaching from soils, manures, and fertilizers. We have also concentrated on making sure models of different complexity, from daily processed-based models to annual empirical models, are based on the same principles and give similar predictions so there are a variety of model choices available to meet user needs.

What Have We Learned?

It is certainly possible to develop reliable, scientifically sound, phosphorus management models, as our research success demonstrates. The best model development requires interdisciplinary collaborations and excellent communication between experimentalists, model developers, and model users. Such a framework of interconnected experimentation and model development should symbiotically advance the science of agricultural P and environmental protection beyond the point that the two proceeding independently can achieve.

Future Plans

Model development research continues to make sure that available models are kept up to date with scientific knowledge and meet the needs of users concerning ease of use and data requirements.

Authors

Peter Vadas, Dairy Systems Scientist, USDA-ARS Dairy Forage Research Center,  peter.vadas@ars.usda.gov

Additional Information

More information can be found at: http://ars.usda.gov/Services/docs.htm?docid=21763


The authors are solely responsible for the content of these proceedings. The technical information does not necessarily reflect the official position of the sponsoring agencies or institutions represented by planning committee members, and inclusion and distribution herein does not constitute an endorsement of views expressed by the same. Printed materials included herein are not refereed publications. Citations should appear as follows. EXAMPLE: Authors. 2013. Title of presentation. Waste to Worth: Spreading Science and Solutions. Denver, CO. April 1-5, 2013. URL of this page. Accessed on: today’s date.

Water Quality Initiatives for Small Iowa Beef and Dairy Feedlot Operations (Small Feedlot Project)

Waste to Worth: Spreading science and solutions logoWaste to Worth home | More proceedings….

Abstract

Traditionally, small feedlots and dairies have not been engaged in environmental regulations and awareness in Iowa due to the environmental focus being directed at large feedlots and confinement feeding operations.  Many small feedlot and dairy managers do not even recognize or admit that regulations do apply to their livestock operation. This effort primarily uses traditional extension outreach methods, field days and publications, to raise awareness.  Unique to this outreach effort are the goal to provide a producer network to share information and ideas to learn more about manure runoff control structures and best management practices to reduce impacts on water quality, and the focus on controls beyond minimum rule requirements, but tailored to small operations.

This talk will discuss some of the challenges faced by small feedlot producers, identification of parameters to help producers overcome some of these challenges, and methods and educational materials aimed at helping raise environmental awareness and foster action among these producers.

Purpose

The Small Feedlot Project is a cooperative effort between state and federal regulatory agencies, public research and extension, technical agencies and the private sector in Iowa.  The primary objectives are to 1) educate producers to better understand the pollution potential of open feedlot runoff, 2) train producers to accurately assess the water pollution potential of their own feedlots, 3) assist producers to identify and evaluate appropriate runoff control alternatives, and 4) provide technical assistance to producers to implement solutions that improve the environmental performance of their feedlots.  

What Did We Do?

The first focus in regards to raising awareness about potential impacts of runoff from open feedlots was the development of two producers guides that specifically talk about open lot runoff and impacts on water quality,  applicable regulations,  the importance and how to assess risk, structural solutions, management solutions and a list of appropriate resources.  The guides, PM 3018, Small Open Beef Feedlots in Iowa- a producer guide and PM 3019, Small Open Lot Dairies in Iowa- a producer guide, were both written and printed in 2012.  These publications were peered reviewed by internal and external partners to the Small Feedlot Plan.  Two-thousand copies of each publication were printed and have been widely distributed via field days, workshops and meetings.  The publications have been in such demand that as of February 2013, only 26 copies of the beef publication and 630 copies of the dairy pub remain in stock. 

The second focus to raising awareness was to offer multiple field days that showcased structural or management practices put in place by feedlot owners to address runoff from their farms.  It is well-known that livestock producers respond well to field days where they can observe physical site conditions that impact runoff, see structural (i.e. settling basins, pumping demonstration, clean-water diversions) or management practices (i.e.  pen scraping, manure removal) put in place by other producers; can ask management and cost of implementation questions to other producers; and can discuss regulations and other management decisions with Extension and agency staff. 

Three field days were held in 2012 to provide options to look at different sizes of feedlots, dirt versus concrete lots and structural and management practices on farms.  The first field day was a three-stop tour held on August 7 near Larchwood, IA with 26 people in attendance; the second field day was held on October 29 near Wall Lake, IA, with 22 people in attendance; and the third field day was held on October 31 near Andover, IA with 26 people in attendance.


What Have We Learned?

A post-field day evaluation was offered to attendees at the Wall Lake and Andover Field Days.  A summary of the evaluations completed follows:

  • 29% reported their understanding of impact of feedlot runoff on stream water quality “increased a lot”; while 56% reported their understanding “increased a little”.
  • 38% reported their understanding of lost-cost methods to better control and manage feedlot runoff “increased a lot”; while 52% reported their understanding “increased a little”.
  • 29% reported their understanding of the value of feedlot manure for crop production “increased a lot”; while 60% reported their understanding “increased a little”.
  • 31% reported their understanding of available technical and financial assistance for feedlot runoff control improvement “increased a lot”; while 58% reported their understanding “increased a little”. 
  • 35% reported they are more likely to plan and install additional improvements to feedlot runoff controls on their farms as a result of attending a field day. 

Future Plans

Future plans include the development of fact sheets that address specific practices small open lot dairy and beef operations can use to protect water quality and additional field days throughout 2013.  New materials will be posted to a Web page specifically created to host resources for small open lots. 

Authors

Angela Rieck-Hinz, Extension Program Specialist, Iowa State University, amrieck@iastate.edu

Shawn Shouse, Extension Field Ag Engineer, Iowa State University

Additional Information

Small Feedlots and Dairy Operations Web Page

Acknowledgements

Partners in the Water Quality Initiatives for Small Iowa Beef and Dairy Feedlot Operations

The authors are solely responsible for the content of these proceedings. The technical information does not necessarily reflect the official position of the sponsoring agencies or institutions represented by planning committee members, and inclusion and distribution herein does not constitute an endorsement of views expressed by the same. Printed materials included herein are not refereed publications. Citations should appear as follows. EXAMPLE: Authors. 2013. Title of presentation. Waste to Worth: Spreading Science and Solutions. Denver, CO. April 1-5, 2013. URL of this page. Accessed on: today’s date.

Tile Drainage Field Day to Promote Manure Management

Waste to Worth: Spreading science and solutions logoWaste to Worth home | More proceedings….

Abstract

Seeing is believing and in August, 2012 a regional field day was held in southern Michigan in conjunction with the Michigan Land Improvement Contractors and Michigan State University Extension to bridge the management practices and new technologies between tile drainage and manure management.  Tile drainage contractors, farmers and agri-business had the opportunity to see sub surface drainage installation and also learn about new management technologies to assist in reducing the risks of both manure and fertilizers from reaching tile outlets and surface waters.   These technologies included installation of water control devices, bark bed bio-reactors, sub-irrigation to manage dairy waste water, cover crops and tillage to disrupt soil macropoures.   The field demonstrations were teamed up with educational sessions under tents.   Planning and developing a field event with onsite drainage installations is a time commitment but proves very important for awareness and education on an important topic.

Why Have Field Days on Tile Drainage and Manure?

As manure systems have become more dilute with the capture of rain and runoff waters, the risks of nutrients and manure reaching sub-surface tile drainage from land applications has become a concern that can be managed.

Check Out These Programs & Research About Tile Drainage

Swine Manure Timing & Subsurface Drainage

Use of Filters in Drainage Control Structures

New Technologies for Drainage Water Management

Role of Drainage Depth and Intensity on Nutrient Loss

What Did We Do?

With very dilute manure and wastewater manure steams on farms, there is a risk of land applications reaching sub-surface drainage systems.  These risks can be reduced and or eliminated first by awareness, then by checking outlets during land applications and by conscience management of rates and timing of applications. For farms that feel they need additional precautions to reduce these risks there are other management systems that can be put in place.  By hosting a field demonstration of sub-surface tile installation a two day field event showed these management practices to farmers, drainage installers and others who attended the event in August of 2012 in SE Michigan.  Tour demonstrations included cover crops, tillage, water control structures, bio-filters and general rate and timing recommendations.

Authors

Natalie Rector, Michigan State University Extension (retired) rector@msu.edu

Natalie Rector has worked in manure nutrient management and water quality protection for the last 12 years of her Michigan extension career.  She worked on a voluntary protection program in state and has worked with a team to train CNMP providers across the mid-west. 


The authors are solely responsible for the content of these proceedings. The technical information does not necessarily reflect the official position of the sponsoring agencies or institutions represented by planning committee members, and inclusion and distribution herein does not constitute an endorsement of views expressed by the same. Printed materials included herein are not refereed publications. Citations should appear as follows. EXAMPLE: Authors. 2013. Title of presentation. Waste to Worth: Spreading Science and Solutions. Denver, CO. April 1-5, 2013. URL of this page. Accessed on: today’s date.

The Discovery Farms Model: The Impact of Helping Farmers Take Control of Water Quality Management

Waste to Worth: Spreading science and solutions logoWaste to Worth home | More proceedings….

Abstract

Many states conduct water quality monitoring projects and within the past decade, sub-watershed and whole farm water quality monitoring has gained more traction as a preferred method to understand runoff and nutrient loading behavior.  The one aspect of these projects that has evolved is the level of partnering.  Partnering not just with technical and academic groups but fully partnering and involving the landowner or resource manager.  The Discovery Farms model is a great example of a fully partnered, adaptive management water quality monitoring project that began in Wisconsin and has grown to formally include North Dakota, Minnesota and Arkansas.  The main objective of the Discovery Farms projects is to fully engage producers in the identification and if necessary the reduction of nutrient and sediment losses from a variety of agriculture farming systems by collecting runoff data from real, working farms.  The program is founded on the belief that farmers who are engaged, educated and empowered with actual on-farm information will use the data to address water quality concerns.  The concept has demonstrated successes and is gaining interest around the country from producers and their commodity organizations.

This workshop will share experiences, successes, the principals of operation and key tasks needed to develop and implement Discovery Farms programs.  Among the four states; edge of field, tile drainage and feedlot monitoring is being conducted for a diverse set of agricultural production systems.  The purpose of the workshop is two-fold: 1) to provide guidance and advice to help other States develop plans and partnerships with stakeholder groups to build Discovery Farms programs in their respective States, and 2) allow participating farmers the opportunity to share what they have learned from the monitoring done on their farms and how they have reacted to that new knowledge.

Authors

Ron Wiederholt, North Dakota State University ron.wiederholt@ndsu.edu

Mike Daniels, Univ of Arkansas, Andrew Sharpley, Univ of Arkansas, Dennis Frame, Univ of WI-Madison, Warren Formo, Minnesota Discovery Farms


The authors are solely responsible for the content of these proceedings. The technical information does not necessarily reflect the official position of the sponsoring agencies or institutions represented by planning committee members, and inclusion and distribution herein does not constitute an endorsement of views expressed by the same. Printed materials included herein are not refereed publications. Citations should appear as follows. EXAMPLE: Authors. 2013. Title of presentation. Waste to Worth: Spreading Science and Solutions. Denver, CO. April 1-5, 2013. URL of this page. Accessed on: today’s date.

A recording is not available of Doyla Johannes (a North Dakota farmer) who is an active participant in the North Dakota Discovery Farms program, but his slides are below: