
Taking the Pulse: Insights into the Needs and Challenges of Iowa’s Commercial Manure Application Industry

Purpose

The Iowa commercial manure application industry plays a crucial role in advancing nutrient utilization, circularity, and water quality within agricultural systems. Effective programming requires an understanding of the industry’s needs, challenges, and perspectives to tailor information and drive behavior change.

To assess the current state of the industry, we surveyed Iowa’s commercial manure applicators to gather insights into business sizes, application capacity, client demand for manure as a cost-effective fertilizer alternative, and pricing structures. The survey served as a needs assessment, helping to align business goals with state water quality objectives. Specifically, we aimed to understand how the industry navigates market demands, regulatory pressures related to environmental stewardship (particularly water and air quality), labor, and time constraints.

What Did We Do?

A comprehensive electronic survey was sent to all 540 of the 562 commercial manure application businesses in Iowa (22 did not have an email on file). We received a response rate of 20%, providing valuable insights into the industry’s scale and operations. Key findings include:

    • Commercial applicators handle 62% of Iowa’s 13 billion gallons of liquid manure annually and nearly 60% of its 6 million tons of solid manure.
    • Manure transport costs and application expenses shape decision-making, influencing equipment selection and service pricing.
    • Current industry capacity and weather-dependent application constraints affect the feasibility of meeting best management practices, such as applying manure only when the soil is 50°F and cooling to minimize nutrient loss.

By examining these trends, we aimed to identify programming opportunities that could support both industry advancements and water quality improvement goals.

What Have We Learned?

The survey results provided critical context for understanding commercial applicator decisions, including:

    • Economic Realities – The manure application industry must remain financially viable while balancing regulatory requirements and customer needs. One of the most common questions asked by manure applicators is what people are charging for manure application. To help address this question we asked applicators what they would charge for application for three liquid manure application rates (4000 gallons/acre, 12,000 gallons/acre and 20,000 gallons/acre) meant to represent finishing swine manure, gestation-farrowing manure, and dairy manure respectively (Figure 1). For solid manure applicators we asked what they charge per ton for application rates of 2, 6, and 15 tons/acre, meant to represent layer manure, turkey litter, and bed pack cattle manure rates (Figure 2). Additionally, we asked what hauling charge was used for transporting either liquid or solid manure. The average charge for liquid manure was $0.0411 per gallon-mile, while for solid manure, the average charge was $0.40 per ton-mile. Agitation of liquid manures was generally included in the manure application price; however, if special agitation services were required (an additional agitation tractor beyond standard practice or the use of an agitation boat) an additional charge of $0.002 per gallon or around $150-300 per hour was reported.
Reported liquid manure application price for umbilical application system (blue circles) and manure tank application (orange squares). Error bars represent the reported standard deviation amount respondents at each application rate.
Figure 2. Estimated cost of solid manure application per ton. Error bars represent the reported standard deviation amount respondents at each application rate.
    • Manure Transport & Industry Size – Understanding how manure moves within the state and the cost of application informs strategic equipment investments. Solid manure transport distances were reported to average 14.5 miles while liquid manure transport was reported at 2.0 ± 1 mile.

      Survey responses suggested 2050 people employed in the commercial manure application business, with 920 of these as non-seasonal employees and 1130 as seasonal employees. Overall totals align well with the number of certified commercial manure applicators in Iowa.

    • Regulatory & Timing Constraints – The number of available application days under various weather conditions and the desired soil temperatures at the time of application limits application days available. It also sets a constraint on the application capacity needed to complete manure application. We surveyed how much manure could be applied daily by each company to evaluate application days needed and to evaluate how much increase in application capacity is required. Expansion could occur through either equipment sizing and employee numbers, needed to meet state water quality goals while maintaining viable businesses. On average, businesses can apply 0.6 million gallons of liquid manure per day, with a standard deviation ranging from 0.25 to 1.6 million gallons. Assuming an application rate of around 4000-gallons and acre this means manure could cover 150-acres per day per company. It would take 50 working days to apply all liquid manure in Iowa. On average, businesses apply 526 tons of solid manure per day, requiring 57 working days to apply all the solid manure in Iowa.
    • Industry’s Role in Water Quality – Commercial applicators must be strategic partners in achieving water quality objectives by optimizing manure use through best application rates and timing, and incorporation of technology.

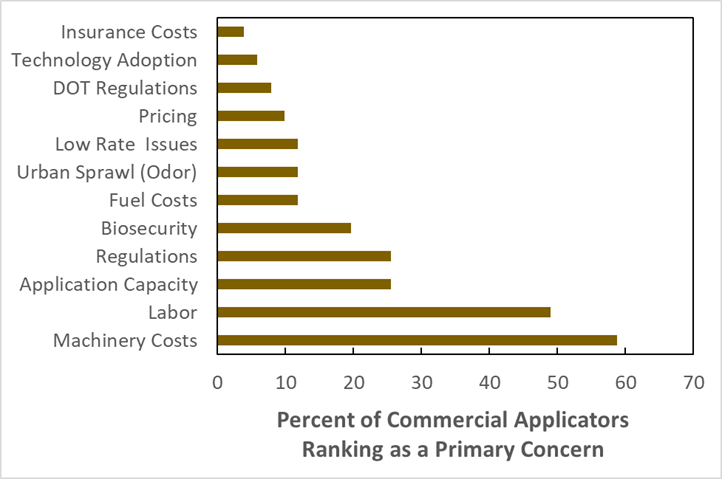
      An open-ended question was asked around what challenges were for your application business over the next ten years (Figure 3). As answers were not limited, most businesses chose to list numerous concerns. These were grouped as best possible to provide categories and to help understand where future programming could address these concerns.

      The primary concerns listed by most businesses were equipment costs and labor availability. Many noted how as equipment costs have increased it takes more hours of application to justify ownership and find a way to make their business cash flow, and how this has translated into repair costs that add to concerns about maintaining a business. There was an expression of how this could make it difficult for a younger generation to get into the business and make sure the industry stays sustainable. Developing materials to help facilitate those interested in developing a business plan and gallons it takes under different conditions would be a useful tool for facilitating making a business case to a lender.

This study underscores the importance of tailoring educational programs to meet industry needs while collaborating with policymakers to develop strategies that advance manure management practices.

Figure 3. Primary concerns of commercial manure application businesses.

Future Plans

To further support the industry and align with water quality objectives, future efforts will focus on:

    • Developing strategic policies that support efficient manure application while maintaining business viability.
    • Expanding educational programming to help applicators navigate regulatory changes and improve application timing strategies.
    • Assessing infrastructure needs to determine equipment investment and business growth opportunities.
    • Enhancing industry collaboration with policymakers to balance business sustainability with environmental stewardship.

Authors

Presenting & corresponding author

Daniel Andersen, Associate Professor, Iowa State University, dsa@iastate.edu

Additional authors

Melissa McEnany, Iowa State University

Rachel Kennedy, Iowa State University

Additional Information

https://www.extension.iastate.edu/immag/commercial-manure-applicators

The authors are solely responsible for the content of these proceedings. The technical information does not necessarily reflect the official position of the sponsoring agencies or institutions represented by planning committee members, and inclusion and distribution herein does not constitute an endorsement of views expressed by the same. Printed materials included herein are not refereed publications. Citations should appear as follows. EXAMPLE: Authors. 2025. Title of presentation. Waste to Worth. Boise, ID. April 711, 2025. URL of this page. Accessed on: today’s date. 

Closing the Loop: Extension’s Role in Driving Circularity in Manure Management

Purpose

Circular agriculture is a farming strategy designed to minimize inputs and environmental impact by improving soil health, reducing waste, and reusing materials. In the context of livestock production and manure management, circularity emphasizes nutrient recycling, minimizing environmental losses, and balancing nutrient inflows and outflows to sustain agricultural systems. These priorities have long been a focus of Extension efforts across livestock-intensive regions.

This work examines the role of Extension in defining, branding, and messaging circularity within manure management. Our objective is to highlight past progress, explore future opportunities, and establish consistent messaging across farmers, industry, and the public. Through multiple analyses, we demonstrate how minor alterations in messaging can tailor information to address different audience concerns.

What Did We Do?

To evaluate the evolution of manure management and its role in circular agriculture, we conducted several analyses:

    • Historical Nutrient Flow & Circularity Metrics 

Using historical data, we traced changes in nutrient use efficiency due to advancements in cropping systems, manure handling, and livestock genetics. 

Findings illustrate continuous improvement in livestock production systems and highlight key drivers of efficiency.

Improvements were attributed to livestock performance, crop performance, and manure management, helping identify areas requiring greater emphasis for future progress.

    • Nutrient Separation vs. Direct Manure Application 

We compared traditional manure application with nutrient separation techniques to assess their impact on nutrient circularity and economic viability. Nutrient separation could include solid liquid separation systems, but ideally will be based on systems that target partitioning of N and P, to better focus on how nutrient flows are impacted.

    • Comparing Manure & Municipal Waste Management 

By comparing manure management practices with municipal waste handling systems, we examined how these comparisons shape public perception.

Extension’s role includes bridging the gap between agricultural decision-making and a public that is increasingly disconnected from farming, requiring clear, relatable messaging.

What Have We Learned?

The analysis highlights several key takeaways:

    • Livestock & Crop Improvements Have Driven Nutrient Use Gains – While significant progress has been made, additional focus on manure management is needed to accelerate circularity.
    • Decision Tools Can Be Re-Branded – Farmers and industry stakeholders can benefit from repurposed decision-support tools that incorporate circularity metrics to inform practical manure management choices.
    • Public Understanding Requires Clear Communication – Agricultural waste and manure management must be explained in ways that connect with non-farm audiences, emphasizing environmental and health benefits.
    • Multimodal Messaging Enhances Engagement – Using a combination of visual graphics, infographics, and multimedia content, Extension can effectively communicate circularity’s value to diverse audiences.

Future Plans

To strengthen Extension’s role in promoting circularity in manure management, future efforts will focus on:

    • Developing targeted messaging for farmers, industry professionals, and the general public to improve adoption of circular manure management practices.
    • Creating practical decision-support tools that incorporate circularity metrics to assist in manure management planning.
    • Enhancing outreach efforts through multimedia resources, including infographics, videos, and interactive educational tools.
    • Strengthening connections between manure management and broader sustainability discussions by aligning messaging with climate resilience, water quality, and regenerative agriculture initiatives.

Authors

Presenting & Corresponding author

Daniel Andersen, Associate Professor, Iowa State University, Dsa@iastate.edu

The authors are solely responsible for the content of these proceedings. The technical information does not necessarily reflect the official position of the sponsoring agencies or institutions represented by planning committee members, and inclusion and distribution herein does not constitute an endorsement of views expressed by the same. Printed materials included herein are not refereed publications. Citations should appear as follows. EXAMPLE: Authors. 2025. Title of presentation. Waste to Worth. Boise, ID. April 711, 2025. URL of this page. Accessed on: today’s date. 

Cyanobacteria Biofertilizer Production from Manure

Purpose

To access and quantify the availability of inorganic soil phosphorous following the application of dried non-living Cyanobacteria biofertilizer (CBF) in oats within a greenhouse environment

What Did We Do?

This study examined the operational and environmental effects of integrating Cyanobacteria biofertilizer (CBF) production into livestock manure management systems. Using a combination of system modeling, laboratory analysis, and field trials, the research assessed the life cycle environmental impacts and practical viability of Cyanobacteria biofertilizer (CBF).

What Have We Learned?

This presentation will provide insights into system configuration and modeled environmental impacts, as well as data from ongoing lab and greenhouse experiments. Key findings indicate that genetically modified strains of cyanobacteria (mutants) are capable of increasing manure phosphorus uptake by 10 times compared to existing strains. The shift to mutant cyanobacteria with greater phosphorus uptake results in reduced greenhouse gas emissions, as identified through a partial life cycle assessment, and can serve as a phosphorus fertilizer, as determined in greenhouse trials. Greenhouse trials on oat production using cyanobacteria with typical phosphorus uptake levels and the mutant strains with a 10-fold increase in phosphorus uptake produced similar biomass yields to dairy manure and increased biomass compared to chemical/synthetic fertilizers. Further research will expand to field trials for existing cyanobacteria strains, additional greenhouse trials for mutant strains, and efforts to increase nitrogen uptake in alternative mutant strains. . This study underscores both the potential and challenges of adopting CBF as a sustainable solution in livestock-based cropping systems.

Future Plans

We will be taking learnings from our initial laboratory/greenhouse experiments and modeling to field trials in Spring/Summer of 2025.

Authors

Presenting author

Brian M. Langolf, Researcher, University of Wisconsin Madison

Corresponding author

Rebecca A Larson, Professor and Extension Specialist, University of Wisconsin Madison, rebecca.larson@wisc.edu

Additional authors

Juma Bukomba, Gradúate Research Assistant, University of Wisconsin Madison; Horacio A. Aguirre-Villegas, Scientist, University of Wisconsin Madison; Brenda Casino Loeza, Research Associate, University of Wisconsin Madison; Victor M. Zavala, Professor, University of Wisconsin Madison; Ted Chavkin, Postdoctoral, University of Wisconsin Madison; Brian Pfleger, Professor, University of Wisconsin Madison; Rebecca A Larson, Professor, University of Wisconsin Madison

The authors are solely responsible for the content of these proceedings. The technical information does not necessarily reflect the official position of the sponsoring agencies or institutions represented by planning committee members, and inclusion and distribution herein does not constitute an endorsement of views expressed by the same. Printed materials included herein are not refereed publications. Citations should appear as follows. EXAMPLE: Authors. 2025. Title of presentation. Waste to Worth. Boise, ID. April 711, 2025. URL of this page. Accessed on: today’s date. 

Implementation of Machine Learning for Detection of VFA Depletion

Purpose

Current bioplastic production using polyhydroxyalkanoates (PHA) is limited by production costs associated with maintaining a pure culture and using synthetic chemical-based feeds. Significant barriers for commercialization of bioplastics associated with high production costs are maintaining sterile conditions for a pure culture and the acquiring/synthesizing chemical-based feeds. This research uses a more practical approach that substitutes synthetic feeds for a more robust manure derived Volatile Fatty Acid (VFA) rich feed. VFAs are acquired from acidic fermentation of organic matter (dairy manure) and are important precursors to PHA synthesis by bacteria. Another change is the use of a mixed microbial culture (MMC) instead of a pure culture. MMCs are a collection of many types of bacteria compared to pure cultures which aim to only contain a single species. Usage of VFAs and MMCs help reduce the main drivers behind high production costs by alleviating the need for sterile conditions and expensive feeds. However, for a commercialized process there is another significant barrier that needs to be overcome. Real-time monitoring of VFAs remains elusive while being essential to commercialization. Without the ability to monitor VFAs in real-time results in the inability to confidently maximize PHA yield on VFA-based feeds. 

This research establishes a more efficient and reliable alternative to measure the concentration of VFAs in MMCs. Ensuring VFA depletion is essential to maximize PHA yield. The current method requires a methodical examination of VFA uptake by the consortium through measuring volatile suspended solids (VSS), VFA concentrations, and duration of examination (time). This is a time intensive process and is not always accurate. Without real time, measurement of VFA concentration the consortium can experience a buildup of VFAs instead of depletion as intended leading to a decrease in PHA yield. This research uses machine learning to predict the concentration of VFAs in real time, alleviates the time requirement needed, and has potential to minimize the chance of buildup instead of depletion. Additionally, using a real-time measurement strategy is more akin to a commercialized process, the end goal for PHA production. 

 What Did We Do?

The first step towards building a reliable machine learning model was to collect data that could be used to train a model. For this we used ten experimental production runs (an experiment that feeds VFA rich substrate to a mixed microbial consortium to build up PHA concentrations internally) measuring run duration, dissolved oxygen (DO), Oxidative Reduction Potential (ORP), Oxygen Uptake Rate (OUR), and Waste Activated Sludge (WAS) Concentration.  DO is the measure of oxygen dissolved in the water and OUR is the measure of the rate at which oxygen is being consumed by the consortium. ORP is the measure of how likely a medium is to give or receive electrons in a redox reaction in wastewater in can be a measure of the reactors condition (aerobic, anoxic, or anaerobic). Lastly, WAS Concentration is the measure of percent WAS used to start an experiment based on a maximum value of one liter. Using this data we also calculated some additional measurements before the data reached the model to give more insight into reactor’s condition throughout time however, these were less impactful than the variables above. This data was split into a training set (Ten out of 16 runs) and a testing set (Six out of 16 runs). With this data we utilized five main machine learning models (linear regression, support vector regression, decision tree, random forest, and neural network) to make accurate and precise predictions of VFA concentration.  

We differentiated the different models by using three primary statistics: mean squared error (MSE), mean absolute error (MAE), and r2. MSE is the average squared error between the models’ predictions and the measured concentration. MSE was chosen as it more heavily penalizes larger errors due to the squared nature of the statistic. MAE is the average error between the predicted and measured concentrations. MAE was chosen as it gives a more interpretable measure of the models’ accuracy. This metric is not influenced by large outliers and treats over and under predicted errors similarly and overall is easier to interpret compared to MSE. The r2 metric is a representation of the model’s predictive accuracy. This metric was used as it gives a numerical representation of a model’s fit to the measured concentrations   The models were evaluated using a single measurement, combination of measurements, and lastly all four measurements (Time, DO, ORP, and OUR). The optimal model was determined by the combination of model and parameters that resulted in the lowest deviation from the measured concentration and highest r2.  

 What Have We Learned?  

This research has allowed us to increase production run optimization by more accurately predicating VFA concentrations in real time. Real time prediction is the beginning step to the realization of a reliable commercialized process. Bioplastic production using PHAs is primarily limited by cost of production. Using a resource such as dairy manure to produce VFA rich substrate can minimize the production cost but without real time monitoring can lead to excess costs. The biggest benefit of using machine learning to predict VFA concentrations is its ability to minimize PHA production costs by accurately predicting VFA depletion. The model being used currently is a random forest model using all parameters (DO, ORP, OUR, WAS Concentration, etc.). Using this model on test data results in an r2 around 0.89 and MAE of 1.6 Cmmol/L with some variation depending on the testing set used. 

Future Plans

Using a machine learning model to monitor real time measurements for predicting VFA concentration is to be utilized in operating an autosampler. The model would be used to automatically take samples from and feed the production reactor with VFA rich liquor. This setup will be assembled to mirror a commercialized process in which PHA is produced autonomously with operators overseeing the process. Conducting automated production runs will allow us to investigate the upper limits of a mixed microbial consortium to produce and store PHA. This will give us insights into the optimized amount of VFA liquor to produce for a predetermined reactor volume. 

Authors

Presenting & corresponding author

Brandon M. Boyd, Research Assistant, University of Idaho, Boyd4708@vandals.uidaho.edu

Additional author

Dr. Erik Coats, Associate Professor, University of Idaho 

Acknowledgements

This research was funded by the USDA Sustainable Agricultural Systems Initiative through the Idaho Sustainable Agriculture Initiative for Dairy (ISAID) grant (Award No. 2020-69012-31871).  

I would like to acknowledge my coworkers who have helped me conduct my research, Dr. Moberly in the chemical engineering department and JR in IT for helping me with my Machine Learning model and future plans, and lastly Dr. McDonald. 

The authors are solely responsible for the content of these proceedings. The technical information does not necessarily reflect the official position of the sponsoring agencies or institutions represented by planning committee members, and inclusion and distribution herein does not constitute an endorsement of views expressed by the same. Printed materials included herein are not refereed publications. Citations should appear as follows. EXAMPLE: Authors. 2025. Title of presentation. Waste to Worth. Boise, ID. April 711, 2025. URL of this page. Accessed on: today’s date. 


Awful Offal: Partnerships to Benefit Livestock Producers, Local Food Chains, Human Health, and the Environment

Purpose

Livestock producers and meat processors are facing ever evolving challenges when it comes to waste management. Increasing levels of regulation continue to challenge producers, including Washington State’s recently established Organics Management law which sets Methane reduction goals for landfills. This has led many landfills in the state to begin turning away organic material like offal and animal carcasses. Meanwhile climate change is increasing the frequency and intensity of catastrophic animal mortality events, driving the urgent need for solutions to build resources and infrastructure to manage large animal losses.

The Awful Offal group serves as the primary inter-agency effort for addressing policy barriers and problem-solving acute and ongoing animal waste disposal scenarios. The group and its members also participate in state-wide catastrophic mortality preparedness planning. This presentation aims to engage participants with real-world examples of successes and challenges this group has faced through its inception.

What Did We Do?

The Awful Offal work group meets regularly to update members on specific cases or trends in their respective programs. Over years of collaboration, we have been able to identify gaps, provide training and create resources to address some of the largest challenges the state faces with animal carcass management. This has taken shape in the form of offal focused composting workshops, market studies, and countless hours providing resources and technical assistance to operators in need.

What Have We Learned?

We have learned much since this group’s inception, one thing that routinely comes up is that Washington’s diverse climate is going to require an equally diverse set of solutions for tackling this challenge. Composting is a viable and environmentally responsible option for many but also comes with its own unique needs and challenges. Many small meat processors have described the switch from sending material to landfill to composting onsite as “running a second business.” If you also consider many commercial composting operations do not accept this material, we must recognize that no single solution will solve this issue state-wide.

Future Plans

Through robust technical assistance and economic incentives, Washington State Department of Agriculture (WSDA) plans to lead a State-wide effort to promote adoption of on and off-farm composting as a waste management strategy.  WSDA also intends to conduct an in-depth economic and market analysis to identify the specific regional needs and barriers so to further determine how the State can best support additional infrastructure, fund pilot projects and develop resources.

Authors

Presenting author

AJ Mulder, Nutrient Management Specialist, Washington State Department of Agriculture, aj.mulder@agr.wa.gov

Acknowledgements

I would like to acknowledge all the members of the Awful Offal work group, including my colleagues at Washington State Department of Agriculture, Department of Ecology, Washington State University, Department of Health, Department of Fish and Wildlife, USDA and all our industry partners whose input and cooperation this work would be impossible without.


The authors are solely responsible for the content of these proceedings. The technical information does not necessarily reflect the official position of the sponsoring agencies or institutions represented by planning committee members, and inclusion and distribution herein does not constitute an endorsement of views expressed by the same. Printed materials included herein are not refereed publications. Citations should appear as follows. EXAMPLE: Authors. 2025. Title of presentation. Waste to Worth. Boise, ID. April 711, 2025. URL of this page. Accessed on: today’s date. 

Using Composted Poultry Litter to Improve the Chemical and Physical Properties of Potting Media for Woody Ornamental Production

Due to a technical glitch, the beginning of the recorded presentation was not recorded. Please accept our apologies.

Purpose

A common media used for woody ornamental production is a mixture of 8 parts pine bark and 1 part sand on a volume basis combined with various amounts of peat moss, sphagnum moss, or vermiculite to improve the aeration porosity (AP) and water holding capacity (WHC). Lime is also added to raise the pH to the level needed for the plant to be grown, and slow-release pellet fertilizer (14-14-14) is mixed in the range of 3 to 8 lb per cubic yard of media to provide a base level of fertility.

While materials such as peat moss and vermiculite hare valuable ingredients to improve the physical characteristics of potting media, there are some significant concerns. Peat moss is obtained from wetlands (peat bogs) and is a non-renewable resource that has increased in price. Vermiculite is a product of heat-treating ore mined from the earth to make the product used in horticulture. The rising energy costs associated with mining and heat processing have caused the costs of vermiculite to increase.

The purpose of this study was to determine if blending 20%, 40%, and 60% (volume basis) of composted poultry litter (CPL) with a bark-sand base mix could replace or reduce the need to mix in non-renewable ingredients to improve the physical properties (AP, WHC, bulk density, pH), and reduce the amount of pellet fertilizer (14-14-14) needed to provide typical levels of fertility for potting media used in ornamental plant production. The anticipated benefits would be reduced production costs for the horticulturalist and development of a consistent market for producers of compost products made from poultry litter mixed with locally sourced plant waste.

What Did We Do?

The first step in the study was to obtain large amounts of composted poultry litter (broiler or breeder litter mixed with wood and other plant waste) and screened pine bark from two separate manufacturers in South Carolina. The other material that was included in the media blends was builder’s sand. Three well-mixed pine bark and compost samples were sent to the Clemson University Agricultural Services Laboratory to determine the concentrations of major and minor plant nutrients, organic matter, carbon, pH, electrical conductivity (EC5), moisture content, and the dry matter bulk density. The only measurements obtained for the sand were the moisture content (3.7%) and density (1.143 g DM/cm3). The pH was assumed to be 7.0 based on published information.  The average chemical and physical characteristics of the pine bark and compost are provided in Table 1. The complete details are given by Chastain et al. (2023).

The next step was to make the four different potting mixes using the three ingredients. The base mix was made by blending 8 parts pine bark with 1 part sand. The other three mixes were blends of the base mix and the compost product (CPL) on a volume basis. The 20% CPL mix was 1 part CPL blended with 4 parts of the base mix. The 40% CPL mix was 2 parts CPL blended with 4 parts of the base mix, and the 60% CPL mix was 3 parts CPL blended with 2 parts of the base mix.

The third step was to measure the dry matter bulk density, aeration porosity (AP), water holding capacity (WHC), and pot water capacity. The density of the four mixes was determined as the dry mass of material in a container with a calibrated volume. The AP and WHC were measured in the laboratory using a test chamber and procedure designed for this purpose (Chastain et al., 2023). The pot water capacity (g water/pot) was measured by filling 6, 6-inch pots with the same volume of each of the 4 mixes (24 pots total). The pots were brought to saturation and the water contained in the pots was measured. The pots were allowed to dry in the laboratory for 4 days and the mass of water in each pot was measured again. The complete details are provided by Chastain et al. (2023).

Table 1. Chemical and physical characteristics of the bark and composted poultry litter used to make the four potting mixes (mean of 3 reps). The moisture content of the sand used was 3.7%, the pH was 7.0, and the bulk density was 1.143 g DM/cm3.

Screened Pine Bark

(% d.b.)

Composted Poultry Litter

(% d.b.)

TAN (NH4-N + NH3-N) 0.00 0.00
Organic-N 0.33 0.96
Nitrate-N 0.00 0.12
Total-N 0.33 1.08
P2O5 0.12 2.45
K2O 0.22 0.82
Calcium 0.33 4.35
Magnesium 0.11 0.36
Sulfur 0.05 0.20
Zinc 0.004 0.02
Copper 0.001 0.02
Manganese 0.014 0.02
Sodium 0.023 0.15
Organic Matter 92.6 13.7
Carbon 52.4 9.94
C:N 161:1 9.2:1
EC5 (mmhos/cm) 2.56 0.71
pH 5.10 7.33
Moisture (%) 59.4 25.6
Density (g DM/cm3) 0.164 0.607

The final step involved calculating the concentrations of plant nutrients and other characteristics from the data shown in Table 1 as a weighted mean based on mass. These nutrient concentrations were converted to a volume basis (lb/yd3) using the mix bulk densities. The volumetric nutrient concentrations of the three CPL and base mix blends were compared with the range of nutrient concentrations that would result from mixing a 14-14-14 pellet fertilizer with the base mix at the rate of 3 to 8 lb per cubic yard.

What Have We Learned?

The results of mixing 20%, 40% and 60% CPL with the base mix on important properties of potting media are given in Table 2 along with target values from the literature. As the amount of composted litter (CPL) was increased the aeration porosity decreased from an unacceptable value of 30% for the base mix to 18% for the 20% CPL mix and 12% for the 60% CPL mix.  The target range for water holding capacity is 45% to 65%. The highest WHC of 50% was for the 40% CPL mix followed by a WHC of 48% for the 20% CPL mix. The most limiting media characteristic appeared to be pH. The desirable range for media pH ranges from 5.5 to 6.4 depending on the plant to be grown.  Based on the upper limit of this range, the highest amount of this compost product that would be recommended based on this study was 40%.  Therefore, these results indicate that the amount of CPL that should be considered for most potting media would be in the range of 20% to 40% of the mix. The actual percentage of CPL that should be used will depend on the pH requirements of the plants to be grown. The pot water capacity results also showed that increasing the percentage of CPL in the mix increased the amount of water that would be held in a container at saturation and after 4 days of evaporation. If a media pH of 6.1 is suitable for the plant to be grown then these results suggest that the 40% CPL mix would be the best since it would provide an AP of 15%, a WHC of 50%, and an increase in pot water capacity of 20% at saturation and 29% following 4 days of evaporation with no irrigation. Using 40% CPL in a potting mix would also provide a 35% increase in dry bulk density which should reduce pot tipping in a production or retail nursery.

Table 2. Impact of adding composted poultry litter (CPL) to a bark-sand base mix on key potting media characteristics. The amount of CPL in the mix was 0%, (100% Base Mix), 20% (20% CPL), 40% (40% CPL), and 60% (60% CPL). AP is the aeration porosity, and WHC is the water holding capacity.

Media Property 100% Base Mix 20% CPL 40% CPL 60% CPL
AP (%) – Target: 10% to 20% 30 18 15 12
WHC (%) – Target: 45% to 65% 46 48 50 46
pH – Target: 5.5 to 6.4 5.3 5.7 6.1 6.5
Density (g DM/cm3) 0.31 0.37 0.42 0.47
Pot Water Capacity – at saturation (g/pot) A 390 420 (+8%) 468 (+20%) 523 (+34%)
Pot Water Capacity – after 4 days (g/pot) B 316 355 (+12%) 407 (+29%) 413 (+31%)

A The average mass of water contained in a 6-inch pot after adding enough water to bring the contents to saturation.

B The average mass of water contained in a 6-inch pot after allowing water to evaporate from the pots for 4 days.

The volumetric nutrient contents of the base mix, the fertilized base mix, and the 20% and 40% CPL mixes are compared in Table 3. The results for the 60% CPL mix were not included since the pH of 6.5 (Table 2) exceeded the upper value of the target range (pH = 6.4). Addition of the pellet fertilizer to the base mix and the 20% and 40% CPL mixes were able to reduce the C:N of the mix and change the plant available-N estimate from – 0.36 lb /yd3 to a positive value. That is, one of the goals of fertilizing a potting mix is to overcome the impact of nitrogen immobilization from the large amount of carbon in the pine bark. The actual target for plant available-N will vary with the plant to be grown. A similar result can be seen for the plant available P2O5. The base mix was not estimated to contain any useful P2O5. The addition of pellet fertilizer or using a CPL blend provided similar amounts of P-fertility. The two CPL mixes provided more K2O than the typical range of pellet fertilized mixes included in this study. The use of CPL instead of pellet fertilizer also added calcium, magnesium, sulfur, and other minor plant nutrients. The only elevated element that was undesirable was sodium. These results point out that potential minor nutrient toxicities (e.g. Mn, Zn) should also be considered when selecting the precise percentage of compost product to use in a potting mix.

Table 3. Comparison of the plant nutrients contained in the bark-sand base mix, fertilized base mix (3 to 8 lb slow-release fertilizer / cubic yard), and the 20% and 40% CPL mixes. The units are pounds of nutrient per cubic yard (lb/yd3)


Plant Nutrients


Base Mix

Fertilized

Base Mix


20% CPL


40% CPL

TAN (NH4-N + NH3-N) 0 0.28 to 0.69 0 0
Organic-N 0.81 0.80 to 0.81 2.61 4.41
Nitrate-N 0 0.20 to 0.49 0.24 0.48
Total-N 0.81 1.28 to 1.98 2.85 4.89
C:N 159:1 65:1 to 101:1 43:1 24:1
Plant Available-N A – 0.36 0.29 to 1.09 0.19 0.70
P2O5 0.29 0.77 to 1.47 5.25 10.20
Plant Available P2O5B 0 0.47 to 1.17 0.42 1.63
Potash (K2O) 0.54 1.01 to 1.71 2.11 3.68
Calcium 0.82 0.82 9.56 18.3
Magnesium 0.27 0.27 0.95 1.62
Sulfur 0.11 0.11 0.50 0.89
Zinc 0.008 0.008 0.054 0.099
Copper 0.003 0.003 0.039 0.074
Manganese 0.034 0.034 0.072 0.111
Sodium 0.057 0.057 0.359 0.661

A Plant Available-N = m f CS [Org-N] + TAN + NO3-N, where m f CS = 0.139 – 0.0036 C:N, R2 = 0.84 (regression by Franklin et al., 2015, method given by Chastain et al., 2023).

P Plant Available P2O5 = PRf [P2O5] Potting MIX + [P2O5] Fertilizer, PRf = 0 for the base mix and blends with fertilizer and 0.40 for CPL. (data from Franklin et al., 2015, method given by Chastain et al., 2023).

The results of this study indicated that composted poultry litter can replace a significant portion or all the expensive, non-renewable ingredients that are currently used to improve the AP, and WHC of a potting mix. The additional water capacity per pot may also reduce irrigation frequency, but additional work is needed. Also, use of CPL in the range of 20% to 40% of the mix can eliminate or reduce the need for lime for pH adjustment and pellet fertilizer to provide common levels of potting mix fertilization. These results only apply directly to the compost product used in this study. A similar study using composted cow manure (Owino et al., 2024) showed similar positive results. However, that product could not be used to adjust AP and WHC and media fertility in the same way as the product used in this study. These studies (Chastain et al., 2023; Owino et al., 2024) are intended to be used as a guide to determine the best compost and base mix proportions based on analysis of the initial ingredients. The final choice concerning the amount of compost to use should be made after growing trial pots of the plant to be produced in a the most beneficial mix.

Future Plans

This information has been used to develop extension programs for poultry and livestock producers that manufacture compost or who are considering composting litter as a treatment option. The other target audience for this information is producers of container ornamentals. Additionally, plant specific trials would be helpful to communicate information concerning the use of compost products in container production. An easy-to-use program or spreadsheet that would allow comparison of potting mix characteristics based on laboratory analysis would allow producers to design one or two mixes that may meet the specific needs of their plants. This would greatly reduce the amount of time needed to test the most beneficial blends.

Authors

Presenting & corresponding author

John P. Chastain, Professor and Extension Agricultural Engineer, Clemson University, jchstn@clemson.edu

Additional authors

Hunter F. Massey, Principle Lecturer, Department of Agricultural Sciences; Tom O. Owino, Associate Professor, Department of Environmental Engineering and Earth Sciences, Clemson University

Additional Information

Chastain, J.P., Massey, H.F., Owino, T.O. 2023. Benefits of Adding Composted Poultry Litter to Soilless Potting Media for the Production of Woody Ornamentals. In: Barbosa, J.C., Silva, L.L., Rico, J.C., Coelho, D., Sousa, A., Silva, J.R.M., Baptista, F., Cruz, V.F., (Eds.) Proceedings of the XL CIOSTA and CIGR Section V International Conference: Sustainable Socio-Technical Transition of Farming Systems. Évora, Universidade de Évora, pp. 10-21, https://rdpc.uevora.pt/rdpc/handle/10174/35910.

Franklin, D., D. Bender-Ӧzenҫ, N. Ӧzenҫ, and M. Cabrera. 2015. Nitrogen mineralization and phosphorus release from composts and soil conditioners found in the southeastern United States. Soil Science Society of America Journal 79:1386-1395. doi:10.2136/sssaj2015.02.0077.

Owino. T.O., Chastain, J.P., Massey, H.F. 2024. Using Composted Cow Manure to Improve Nutrient Content, Aeration Porosity, and Water Retention of Pine Bark-Based Potting Media. In: Cavallo, E., Cheein, F.A., Marinello, F., Saҫilil, K., Muthukumarappan, K., Abhilash, P.C., (Eds.) 15th International Congress on Agricultural Mechanization and Energy in Agriculture ANKAgEng’2023, Lecture Notes in Civil Engineering, Springer Nature Switzerland, 458, pp. 240–261, https://doi.org/10.1007/978-3-031-51579-8_23.

Acknowledgements

This work was supported by the Confined Animal Manure Managers (CAMM) Program of Clemson University Extension. Composted poultry litter was supplied by Mr. Tim McCormick, and the pine bark was supplied by a manufacturer of soil amendments located in, Anderson, SC. Dr. R.F. Polomski, Associate Extension Specialist–Horticulture/Arboriculture at Clemson University, provided valuable assistance in selecting the ingredients for the base mix and provided valuable insight concerning woody ornamental production. Dr. K. Moore, retired director of the Agricultural Service Laboratory, directed the chemical analyses.


The authors are solely responsible for the content of these proceedings. The technical information does not necessarily reflect the official position of the sponsoring agencies or institutions represented by planning committee members, and inclusion and distribution herein does not constitute an endorsement of views expressed by the same. Printed materials included herein are not refereed publications. Citations should appear as follows. EXAMPLE: Authors. 2025. Title of presentation. Waste to Worth. Boise, ID. April 7-11, 2025. URL of this page. Accessed on: today’s date. 
Estimation of Plant Available Nitrogen in Poultry Litter: A Practical Data-Based Method for Extension Educators

Purpose

The forms of nitrogen contained in poultry litter are organic-N, ammonium-N, ammonia-N, and nitrate-N. One of the challenges in using poultry litter as a fertilizer substitute is making a good estimate of the plant available nitrogen (PAN). The value of PAN will depend on estimates of the amount of N that is lost to the air as ammonia following land application and the amount of organic-N that will be mineralized in the soil. The objectives of this workshop are to: (1) summarize organic-N mineralization data, (2) summarize the available data concerning ammonia loss following surface application of poultry litter, (3) review data concerning how fast ammonia is lost from a field to determine how quickly incorporation should be scheduled post-application, (4) provide means values from data to provide a practical guide for PAN calculations, and (5) compare the PAN estimates from the new method with current recommendation used by Clemson University Cooperative Extension.

What Did We Do?

Not all the nitrogen in poultry litter is available for plant use during the first growing season. The amount of N that can be used as a fertilizer substitute is the fraction of the organic-N (Org-N) that will be mineralized to ammonium-N following land application, the fraction of the ammonium-N (NH4-N) that is not lost as ammonia (NH3-N) and any nitrate-N (NO3-N) that is present in the litter. The recommended equation to estimate the plant available-N (PAN) is:

(1) PAN = mf Org-N + Af TAN + NO3-N (Evanylo, 2000; Chastain et al., 2001).

The amount of organic-N that will be mineralized depends on the organic-N content of the litter (lb Org-N/ton) and the mineralization factor, mf. The total ammoniacal-N (TAN) is usually reported on a litter analysis sheet as ammonium-N, but it is the sum of the ammonium-N and ammonia-N contained in the litter (TAN = NH4-N + NH3-N). It is the ammonia part of TAN that can be lost to the air following broadcast application of litter. Loss of PAN as volatilized ammonia is of concern because it represents a loss of N that may be used for plant production, and it contributes to air pollution. The amount of TAN that remains contributes to the estimate of PAN and is described by an availability factor, Af. The value of Af is the percentage of TAN lost as ammonia (AL) following application of litter is calculated as Af = 1 – (AL/100) where the value of AL is obtained from field measurements. Poultry litter generally only contains very small amounts of nitrate-N (1 to 5 lb NO3-N/ton) and all of it counts toward PAN.

Several publications have reported measurements of the mineralization factor, mf, for a variety of manure types. A summary of the literature was provided by Evanylo (2000) and the practical range of values for poultry litter are compared with other types of manure in Table 1. In South Carolina, an mf of 0.60 has shown to work well in practice. However, in cooler climates the best value may be 0.50 since low soil temperatures generally slow the mineralization rate. Other factors such as soil pH, and moisture content can result in variation in the amount of organic-N that will actually be mineralized in a particular field. The values shown in the table are good recommendations for practical use unless a better value is available for a particular state or region. Some organizations (e.g. Clemson University Extension) use a single value of mf for manure from all types of animals. However, the available data indicates that the value of mf to be used in equation 1 should vary with animal type.

Table 1. Mineralization factors (mf) for common types of animal manure (Evanylo, 2000; Chastain et al., 2001).

Recommended mineralization factors
Poultry 0.60 (0.50 to 0.70)
Swine 0.45 (0.40 to 0.50)
Dairy 0.35 (0.25 to 0.35)
Beef 0.40 (0.30 to 0.45)

Several studies and literature reviews provided data concerning the maximum amount of ammonia that was lost after applying poultry litter to hay or ryegrass fields (Lockyer et al., 1989; Marshall et al., 1998; Meisinger and Jokela, 2000; Nathan and Malzer, 1994; Montes, 2002). The theory and data contained in these publications indicated that the amount of ammonia that was lost from surface applied broiler and turkey litter was influenced by the pH of the litter, the pH of the soil or residue that was on the field at time of application, and the temperature. In general, it was shown that if the litter was applied to residue with a high pH (8+) the amount of ammonia lost following broadcast application was increased and if the pH of the residue was low (about 5, Montes, 2002) the amount of ammonia lost decreased. The air temperature on the day of application also influenced the amount of ammonia that was lost with an increase in temperature from 68 degrees to 85 degrees causing an increase in ammonia loss by a factor of about 2. The average maximum ammonia loss (AL) following broadcast of bedded poultry litter to a mowed grass field was determined to be 37% (n = 6, coefficient of variation = ± 19.7%) with a 95% confidence interval that ranged from 29% to 44%. Much less data was available concerning the amount of ammonia lost after application of bedding-free poultry litter. This type of litter is removed from high-rise layer buildings, manure below the roost areas in broiler breeder barns, and un-bedded litter removed from some broiler barns. The data indicated that less ammonia was lost as compared to bedded litter due to the lower pH of the material. The recommended estimate of AL for un-bedded litter is 28%. Therefore, the recommended values for Af to be used in equation 1 for broadcast application of litter during the cooler weather of spring and fall is 0.63 for bedded poultry litter (most broiler and turkey barns) and 0.72 for un-bedded litter. If litter is applied during summer, which is not common, the AL values were doubled based on theory and practical measurements and gave a summertime Af value of 0.26 for bedded litter and a summertime Af value of 0.44 for un-bedded litter.

A common recommendation to reduce ammonia loss after spreading poultry litter, or granular N fertilizer, is to incorporate the litter into the soil with a disk harrow on the same day or provide irrigation of more than 0.25 inches of water. Light disking has been shown to reduce ammonia loss significantly (Chastain et al., 2001; Pote and Meisinger, 2014). The resulting value of Af that has been recommended for use is 0.80 if litter is incorporated on the same day that it was spread. The key question is how much time can lapse between spreading litter and incorporation to get an Af of 0.80? The measurements provided by Montes (Montes, 2002; Montes and Chastain, 2005) indicated that 98% of the total ammonia loss occurred 24 hours after application and 70% of the total had already been lost to the air after 8 hours. The results provided by Montes along with the average maximum ammonia loss values from the literature were combined to provide the recommended Af values given in Table 2. These results indicate that if the goal of incorporation is to yield an Af of 0.80 the litter must be incorporated within 2 to 8 depending on the season of the year and whether the litter contained bedding.

Table 2. Recommended TAN availability factors, Af, for application of poultry litter with and without incorporation.

Bedded Litter Un-Bedded Litter
Spring and Fall Summer Spring and Fall Summer
 Af  Af  Af  Af
Broadcast – no incorporation 0.63 0.26 0.72 0.44
Time lapse before incorporation
1 hour 0.95 0.90 0.96 0.92
2 hours 0.90 0.81 0.93 0.85
3 hours 0.87 0.73 0.90 0.80
4 hours 0.83 0.67 0.87 0.75
6 hours 0.78 0.56 0.83 0.67
8 hours 0.74 0.48 0.80 0.61

 What Have We Learned?

The impact of the method to estimate PAN using the Af values developed from the literature (Table 2) is best demonstrated by a practical example using nitrogen concentrations obtained from a broiler barn with bedded litter. The nitrogen contents and the estimates of PAN based on the current Clemson Extension recommendation and the PAN estimates using the new information are compared in Table 3. For this litter analysis, the PAN estimate using the new recommendation was 6% larger indicating a small increase in useful N. It was assumed that the litter application rate would be based on an agronomic rate of 100 lb N/ac. The calculated application rates were rounded to the nearest ton/ac and gave 3 tons of litter per ac in both cases. The estimate of ammonia emissions per 100 acres was decreased from 1650 lb NO3-N/ac using the old values to 1221 lb NO3-N/ac based on the mean Af from the available data. These results indicate that the current Clemson Extension recommendations are under predicting the amount of PAN that could be used as an N-fertilizer substitute. The more significant impact is that the current recommendations over predict ammonia-N emissions by 26%.

Table 3. Comparison of the PAN estimates and the ammonia-N emissions per 100 acres using the current Clemson Extension recommendations and the new values of Af based on a review of the literature. The calculations are for bedded broiler litter that contains 42 lb Org-N/ton, 11 lb TAN/ton, 1.4 lb NO3-N/ton and spread to provide 100 lb of N/acre. Both litter application rates rounded to 3.0 tons/acre.

Clemson Extension Recommendation New Recommendation Based on Tables 1 & 2
mf 0.60 0.60
Af 0.50 0.63
PAN estimate (equation 1) – lb PAN/ton 32 34
Percent difference +6%
Litter Application Rate – tons/acre 3.0 3.0
Ammonia loss – lb NH3-N/100 ac 1650 1221
Percent difference (-26%)

Future Plans

The immediate plans are to use these results to provide a more realistic estimate of PAN and ammonia emissions for poultry litter in South Carolina. These results can also be used by Extension Educators in other states and regions to revise estimates of PAN for their conditions. The method presented in this paper can also be used in the future as better estimates of mf and Af are empirically determined.

Authors

Presenting & corresponding author

John P. Chastain, Professor and Extension Agricultural Engineer, Clemson University, jchstn@clemson.edu

Additional Information

Chastain, J.P., J.J. Camberato, and P. Skewes. 2001. Poultry Manure Production and Nutrient Content. Chapter 3B in Confined Animal Manure Managers Certification Program Manual: Poultry Version, Clemson University Extension, Clemson SC, pp 3b-1 to 3b-17. https://www.clemson.edu/extension/camm/manuals/poultry/pch3b_00.pdf.

Evanylo, P.G. 2000. Organic Nitrogen Decay Rates. In: Managing Nutrients and Pathogens from Animal Agriculture (NRAES-130). 319-333. Ithaca, NY: NREAS, Cooperative Extension, Cornell University.

Lockyer, D., B. F. Pain, J. V. Klarenbeek. 1989. Ammonia Emissions from Cattle, Pig and Poultry Wastes Applied to Pasture. Environmental Pollution 56:19-30.

Marshall, S.B., C. W. Wood, L. C. Braun, M. L. Cabrera, M. D. Mullen, E. A. Guertal. 1998. Ammonia Volatilization from Tall Fescue Pastures Fertilized with Broiler Litter. Journal of Environmental Quality 27(5): 1125-1129.

Meisinger, J.J., W.E. Jokela. 2000. Ammonia Volatilization from Dairy and Poultry Manure. In: Managing Nutrients and Pathogens from Animal Agriculture (NRAES-130). 334-354. Ithaca, NY: NREAS, Cooperative Extension, Cornell University.

Nathan, M.V., G. L. Malzer. 1994. Dynamics of Ammonia Volatilization from Turkey Manure and Urea Applied to Soil. Journal of Environmental Quality 58(3): 985-990.

Montes, F. 2002. Ammonia Volatilization Resulting from Application of Liquid Swine Manure and Turkey Litter in Commercial Pine Plantations. MS Thesis, Clemson University, Clemson, SC.

Montes, F., J.P. Chastain, 2005. Ammonia Volatilization from Turkey Litter Application in a Pine Plantation in South Carolina. ASAE Paper No. 054077, St. Joesph, Mich.: ASABE.

Pote, D., J.J. Meisinger. 2014. Effect of Poultry Litter Application Method on Ammonia Volatilization from a Conservation Tillage System. Journal of Soil and Water Conservation 69(1):17-25.

Acknowledgements

This work was supported by the Confined Animal Manure Managers (CAMM) Program of Clemson University Extension.


The authors are solely responsible for the content of these proceedings. The technical information does not necessarily reflect the official position of the sponsoring agencies or institutions represented by planning committee members, and inclusion and distribution herein does not constitute an endorsement of views expressed by the same. Printed materials included herein are not refereed publications. Citations should appear as follows. EXAMPLE: Authors. 2025. Title of presentation. Waste to Worth. Boise, ID. April 7-11, 2025. URL of this page. Accessed on: today’s date. 
 

Risk Mapping of Potential Groundwater Contamination from Swine Carcass Leachate Using HYDRUS-1D and GIS

Purpose

The on-farm disposal of swine carcasses poses a potential risk to groundwater quality due to the generation of leachate with nitrate compounds (Koh et al., 2019). This study aims to evaluate the vertical movement of nitrate nitrogen from leachate produced during decomposition of swine carcasses in Nebraska soil types by integrating HYDRUS-1D modeling with GIS-based spatial analysis.

What Did We Do?

Leachate from six on-farm mortality disposal units was gathered during a year-long field study. A soil column study was conducted using the leachate from the field study to evaluate contaminant fate and transport through two common Nebraska soil types – a sandy clay loam and a silty clay.

HYDRUS-1D Model Calibration and Simulation. The model was calibrated using laboratory soil column data; no field-scale observations were used for validation. The objective was to parameterize the model based on controlled experimental conditions and use these simulations to inform spatial risk assessments.

Soil Hydraulic and Solute Transport Parameters. The van Genuchten-Mualem model was chosen to define the soil hydraulic properties for the two soil types used in the columns study, sandy clay loam (SCL) and silty clay (SC). Ten simulations were conducted to develop the HYDRUS-1D model, each run for 365 days, using the mean monthly nitrogen (N lb/ac) generated in leachate during the field study, which was converted into NO₃-N units. The model simulated nitrate leaching in a 10-meter soil column profile using boundary conditions that replicated laboratory leachate transport where the upper boundary represents a constant flux boundary to simulate leachate application based on controlled experimental data and lower boundary represents a free drainage condition representing natural percolation.

Model Calibration. Calibration was performed using inverse modeling within HYDRUS-1D, adjusting key parameters to minimize the sum of squared errors (SSQ) between observed and simulated nitrate concentrations in soil columns at 5 cm, 15 cm, and 25 cm. The results may not fully represent field-scale variability since the model was calibrated only using laboratory data. However, the controlled conditions ensured that parameterization was optimized for subsequent spatial risk assessment using GIS. The sandy clay loam soil strongly correlated with observed and simulated values (R²=0.99). The silty clay soil had a slightly lower R² (0.86). Identical RMSEs of 3.15 for both soil types suggest similar levels of overall deviation from observed concentrations.

The model outputs were exported as time-series CSV data and georeferenced to the study area using ArcGIS Pro. Statewide soil texture data were obtained from the USDA-NRCS soil texture class map (Knoben, 2021) and depth were derived from interpolated data using the Kriging method, based on historical water levels from the UNL Groundwater and Geology Portal (CSD, 2025) respectively. Soil type, groundwater depths, and digital elevation models (DEM) were imported into ArcGIS Pro and processed under the NAD 1983 UTM Zone 14N coordinate system to ensure spatial alignment.

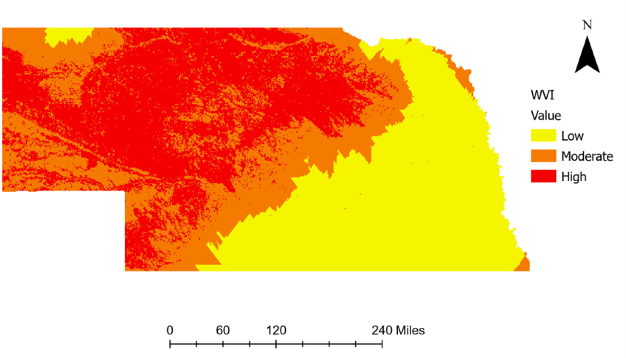
Hydraulic parameters for the ten soil textural classes in Nebraska were defined by the ROSETTA model in HYDRUS-1D and used to model nitrate transport and concentration at 2m soil depth at 1,000 randomly defined locations statewide. Nitrate concentration data at 2 m of soil depth was interpolated using the Kriging tool to create a continuous nitrate concentration data layer. Soil type and groundwater depth data were converted into raster format to enhance the spatial analysis, and a vulnerability assessment was performed using a classification system based on soil permeability, groundwater depth, and nitrate concentrations to produce a spatial representation of groundwater contamination vulnerability (Figure 1).

Figure 1. Distribution of groundwater contamination vulnerability modeled with HYDRUS-1D
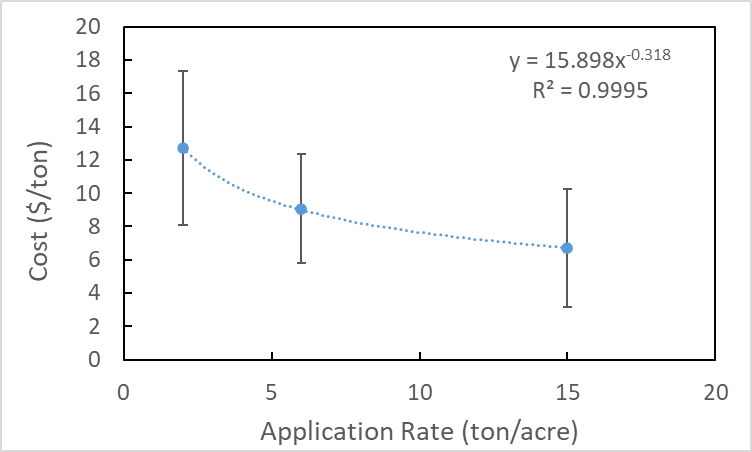
Figure 2. Level swine inventory data for Nebraska (Census of Ag, 2022)

Swine population inventories (Figure 2) were obtained from the 2022 USDA Census of Agriculture (IARN, 2025), allowing for comparison of county-level swine populations to groundwater contamination vulnerability.

What Have We Learned?

The HYDRUS-1D model successfully modeled nitrate movement in the soil profile, producing time-series data that matched expected trends based on soil properties and environmental conditions. Counties with the greatest groundwater contamination risk are predominantly located in the western and northern regions of the state due to well-drained soils and shallow depths of groundwater. Very few swine operations are located in these moderate- to high- risk zones, but those that are located in these zones should be aware of the potential for groundwater contamination and should utilize mortality disposal methods that minimize leachate production. Four counties in northeast Nebraska contain moderate swine populations and have moderate to high risks for groundwater contamination. Castro and Schmidt (2023) found that carcass disposal via shallow burial with carbon (SBC) yielded much less leachate – and, subsequently, much lower loads of contaminants to the soil environment – than composting of whole or ground swine carcasses, suggesting that SBC may be a more environmentally conscious disposal method in these counties. Counties having low vulnerability to groundwater contamination cover much of the state’s central and eastern portions where the majority of swine production is located. This study provides critical insights into the risks of groundwater contamination from on-farm swine carcass disposal in Nebraska. Guidance for on-farm disposal of mortalities by all livestock producers should focus on selecting disposal methods that minimize leachate production and contaminant transport potential.

Future Plans:

Outreach efforts will focus on promoting mortality disposal BMPs with a primary focus on selecting disposal methods that minimize leachate production. Field research will be expanded to include evaluation of multiple carbon sources used for on-farm carcass disposal to reduce leachate generation. Future research will focus on enhancing the predictive accuracy of the HYDRUS-1D model by incorporating field-scale validation using observed nitrate concentrations from groundwater monitoring wells in high-risk areas. This validation will improve the reliability of the model’s output and support more precise risk assessments.

Authors:

Presenting Author

Gustavo Castro Garcia, Graduate Extension & Research Assistant, Department of Biological Systems Engineering, University of Nebraska-Lincoln

Corresponding Author

Amy Millmier Schmidt, Professor, Department of Biological Systems Engineering and Department of Animal Science, University of Nebraska-Lincoln, aschmidt@unl.edu

Additional Authors

Mara Zelt, Research Technologist, University of Nebraska-Lincoln

Aaron Daigh, Associate Professor, Department of Biological Systems Engineering and Department of Agronomy & Horticulture, University of Nebraska-Lincoln

Benny Mote, Associate Professor, Department of Animal Science, University of Nebraska-Lincoln

Carolina Córdova, Assistant Professor, Department of Agronomy & Horticulture, University of Nebraska-Lincoln

Acknowledgments

This project was supported by the National Pork Board Award #22-073. The authors wish to recognize Jillian Bailey, Logan Hafer, Alexis Samson, Nafisa Lubna, Andrew Ortiz, and Maria Oviedo Ventura, for their technical assistance during the field and column studies that provided input data for this modeling effort.

Additional Information

Castro, G., and Schmidt, A. (2023). Evaluation of swine carcass disposal through composting and shallow burial with carbon (poster presentation). ASABE AIM. Omaha, NE. July 9 – 12, 2003.

CSD. (2025). UNL Ground Water and Geology Portal: CSD Ground Water and Geology Data Portal. University of Nebraska-Lincoln. Retrieved from: CSD Ground Water and Geology Data Portal.

IANR. (2025). Hogs and pigs, operations with inventory, total operations by county. Nebraska Map Room. Data source: Census of Agriculture, 2022. Retrieved from: https://cares.page.link/Xu1J.

Knoben, W. J. M. (2021). Global USDA-NRCS soil texture class map, HydroShare, https://doi.org/10.4211/hs.1361509511e44adfba814f6950c6e742.

Koh, EH., Kaown, D., Kim, HJ., Lee, KK., Kim, H., and Park, S. (2019). Nationwide groundwater monitoring around infectious-disease-caused livestock mortality burials in Korea: superimposed influence of animal leachate on pre-existing anthropogenic pollution. Environ Int 129:376–388.


The authors are solely responsible for the content of these proceedings. The technical information does not necessarily reflect the official position of the sponsoring agencies or institutions represented by planning committee members, and inclusion and distribution herein does not constitute an endorsement of views expressed by the same. Printed materials included herein are not refereed publications. Citations should appear as follows. EXAMPLE: Authors. 2025. Title of presentation. Waste to Worth. Boise, ID. April 7-11, 2025. URL of this page. Accessed on: today’s date. 
 

Measured methane emission rates relative to the chemical composition of dairy manure samples

Purpose

Methane emissions from liquid manure storage systems contribute a significant portion of methane emissions from the US agricultural sector (EPA, 2024). There is a need for more farm-level methane emission values to guide decision-making activities within the dairy industry and by government agencies. Cost, time, and labor constraints are challenges related to on-farm methane emission measurements. There is a need for simpler emission measurement methods.

The purpose of this work was to investigate relationships between methane emission rates (MER) in a laboratory assay and commonly measured characteristics including total solids (TS), volatile solids (VS), ash, and total Kjeldahl nitrogen (TKN). The relationships were also examined in conjunction with storage type, season, manure type, and storage duration.

What Did We Do?

We collected dairy manure samples from manure storages at 27 farms in Minnesota and Wisconsin at 2 to 4-month intervals throughout 2024. These samples represented various storage types, storage durations, and manure temperatures. To date, a majority of these samples have been processed for TS, VS, Ash, and TKN using standard methods for manure chemical analyses (American Water Works Association, 2017; Wilson et al., 2022). Additionally, MER were estimated in triplicate with a 3-day in vitro assay (Andersen et al., 2015). Relationships between MER and these manure chemical constituents were examined using Spearman correlation analysis and bivariate plots across all manure samples and with respect to other manure management characteristics. These include storage type, season, manure type, and storage duration. Manure chemical constituents were treated as numerical data whereas storage characteristics were treated as categorical data in the analysis. It is important to note that many samples may only have a partial set of manure analyses completed at this point. This resulted in varying counts of available samples used in the statistical analyses below (Table 1-3). Summary statistics (mean, median, range) are also presented for the different manure chemical constituents.

What Have We Learned?

Table 1 shows summary statistics of dairy manure samples processed for this work (wet basis). There was a wide range of concentrations observed for each manure chemical constituent; however, average values were comparable to American Society of Agricultural and Biological Engineers (ASABE) manure characteristics values (ASABE, 2019).

Table 1: Summary statistics of dairy manure chemical characteristics (% wet basis) (n = 148 for TKN, n = 155 for other manure constituents)

Mean Median Min Max
TS 5.92% 4.98% 0.53% 17.89%
VS 4.39% 3.50% 0.27% 16.60%
Ash 1.53% 1.21% 0.26% 11.12%
TKN 0.31% 0.29% 0.08% 0.83%

Generally, overall correlations (Table 2) and correlations within categories (Table 3) were not strong, however there were some exceptions. These exceptions were observed in TS and VS relationships with MER for flush water and long-term storage duration (Table 3). Here, both positive and negative correlations that were at least moderately strong (rs ≥ |0.5|) were observed. Since methane emissions are a product of organic matter degradation, positive correlations between VS and MER were expected, but not always reflected in the results. Other trends in relationships between other manure constituents and MER are not well understood. However, manure management factors may also influence other microbial activity with respect to TS, Ash, and TKN content, which may have indirect effects on MER that cannot be discerned from a correlative relationship.

Additionally, given the wide range in the concentrations of all manure constituents and MER, it may be difficult to distinguish these relationships when comparing across the aggregate values. Instances where the strongest correlations were observed (Table 3) describe samples from a single farm, which suggests conducting a similar analysis within individual farms to better understand these relationships.

Table 2: Overall Spearman correlation values (rs) between manure constituents and MER

Total solids Volatile solids Ash Total Kjeldahl Nitrogen
MER 0.060 0.052 0.137 -0.046


Table 3: Spearman correlation values (rs) between manure constituents and MER by manure storage type, manure type, storage duration, and season

TS vs MER VS  vs MER Ash vs MER TKN vs MER
Manure storage type Transfer pit (n = 169) 0.150 0.124 0.271 0.075
Underfloor pit (n = 34) -0.103 -0.121 -0.125 -0.153
Manure type Raw manure (including bedding (n=36) 0.270 0.267 0.312 0.369
Raw manure (including bedding + others) (n = 140) 0.042 0.047 0.094 -0.093
Liquid separated manure (n =24) -0.213 -0.297 -0.025 -0.156
Flush water (n = 9) 0.800 0.800 0.883 0.833
Storage duration Short term (< 1 month) (n = 176) 0.082 0.090 0.117 -0.020
Long term (> 1 month) (n =6) -0.771 -0.771 -0.143 -0.200
Point sample (not a storage) (n= 29) 0.029 -0.078 0.350 -0.136
Season Winter (n= 23) 0.013 0.081 -0.011 0.132
Spring (n= 57) 0.406 0.399 0.411 0.238
Summer (n = 46) -0.268 -0.291 -0.165 -0.436
Fall (n =66 -0.188 -0.198 -0.023 -0.011

 Future Plans

We plan to conduct a stepwise regression analysis to better understand the significant independent variables (manure constituents) that influence MER. Correlations between manure constituents and MER using measurements from samples within individual farms will also be conducted.

Authors

Presenting author

Noelle Soriano, PhD candidate, University of Minnesota

Corresponding author

Erin Cortus, Associate Professor and Extension Engineer, University of Minnesota, Ecortus@umn.edu

Additional author

MaryGrace Erickson, Postdoctoral associate, University of Minnesota

Additional Information

Andersen, D. S., Van Weelden, M. B., Trabue, S. L., & Pepple, L. M. (2015). Lab-assay for estimating methane emissions from deep-pit swine manure storages. Journal of Environmental Management, 159, 18-26.

American Water Works Association. (2017). Standard Methods for the Examination of Water and Wastewater. American Water Works Association.

ASABE. (2019). Manure Production and Characteristics (ASAE D384.2). ASABE.

EPA. (2024). Inventory of U.S. Greenhouse Gas Emissions and Sinks 1990-2022 (No. EPA 430-R-24-004). U.S. Environmental Protection Agency. https://www.epa.gov/ghgemissions/inventory-us-greenhouse-gas-emissions-andsinks-1990-2022

Wilson, M., Brimmer, R., Floren, J., Gunderson, L., Hicks, K., Hoerner, T., Lessl, J., Meinen, R. J., Miller, R. O., Mowrer, J., Porter, J., Spargo, J. T., Thayer, B., & Vocasek, F. (2022). Recommended Methods Manure Analysis (M. Wilson & S. Cortus, Eds.; 2nd ed.). University of Minnesota Libraries Publishing.

Acknowledgements

We are grateful to the farms that participated in this research for providing samples and for sharing their observations with us. We are also grateful to Kevin Bourgeault, Seth Heitman, Sabrina Mueller, and Jacob Olson for contributing to sampling and laboratory analysis.

This research is supported by through USDA NIFA Award 2023-68008-39859, and the Minnesota Rapid Agricultural Response Fund.

The authors are solely responsible for the content of these proceedings. The technical information does not necessarily reflect the official position of the sponsoring agencies or institutions represented by planning committee members, and inclusion and distribution herein does not constitute an endorsement of views expressed by the same. Printed materials included herein are not refereed publications. Citations should appear as follows. EXAMPLE: Authors. 2025. Title of presentation. Waste to Worth. Boise, ID. April 7-11, 2025. URL of this page. Accessed on: today’s date. 
 

Laboratory estimation of methane emission rates from Midwest dairy manure samples representing common manure types and storage conditions

Purpose

Methane (CH4) emissions from manure storage are a substantial contributor to the cradle-to-farmgate climate footprint for many dairy farms, especially for farms storing manure as liquid or slurry (Rotz et al., 2021). Dairy systems handle, treat, and store manure in various ways. In combination with environmental conditions, these differences in manure-related structures and processes potentially cause substantial farm-to-farm variability in CH4 production and intensity. However, few methods are available to estimate CH4 emissions specific to a manure storage or farm system.

To enable estimation of CH4 emission rate per unit of manure (methane emission rate, MER), research by Andersen et al. (2015) tested a laboratory assay on swine manure from deep pits. These authors showed that MER was related to manure chemical composition and varied across the year, with the highest values recorded in late fall. Our research aimed to build on Andersen et al. (2015) by testing dairy rather than swine manure to 1) compare MER across a variety of manure types, storage types, and typical storage durations, 2) examine seasonal differences in MER, and 3) quantify farm-to-farm and storage-to-storage variation in MER. Ultimately, we expected to illustrate how the MER laboratory assay could be used in estimating farm-specific CH4 emission rates from dairy manure storages.

What Did We Do?

We partnered with 27 dairies in the U.S. Upper Midwest with liquid and slurry manure storages. At approximately 2–4-month intervals throughout 2024, we collected composite samples (n = 208) representing various manure types, typical storage durations, and storage types. Most samples were whole manure (n = 165, 79%) or liquid separated manure (n = 34, 16%), with remaining samples representing flush water and digestate. Samples represented areas where manure was stored for short durations (≤1 mo.; n = 120, 58%) and long durations (>1 mo.; n = 88, 42%). Most long-term storage was unroofed, and most short-term storage was roofed. Samples represented transfer pits (n = 84, 40%), unroofed basins or pits (n = 67, 32%), and below-building pits (n = 30, 14%), among other storage types. Samples were distributed evenly across seasons for most farms, except that fewer samples were collected during winter due to outdoor storages freezing over.

For the MER assay, we incubated 75.06 ± 0.02 g (mean ± standard error) of manure at 72°F in triplicate 100 mL serum bottles for 2.99 ± 0.01 days. Then, we measured gas displacement with a syringe and headspace CH4 concentration with gas chromatography (Agilent 490 Micro GC, Agilent Technologies, Inc., Santa Clara, CA). We calculated MER as the average CH4 emission (mL) at 72°F per liter of manure per day. To examine differences due to manure type, typical storage duration, storage type, and season, we fit linear mixed models to log-transformed MER, then back-transformed model-implied means and standard errors. Additionally, we examined variance components attributable to individual storages and farms in relation to the residual variance. Storage-to-storage differences explained a small amount of total variance, so the random effect of storage was removed. Significance was declared at p<0.05.

What Have We Learned?

Across samples, the MER was highly variable and right-skewed (mean = 37, median = 21, standard deviation = 45 mL CH4 L-1 d-1; Figure 1), with a small fraction of extremely high values (maximum = 236 mL CH4 L-1 d-1). In contrast with our expectations, we found no effect of manure type, typical storage duration, and storage type on MER. Season influenced MER (F [3, 183.4] = 11.3, p < 0.001), with Fall samples exhibiting a larger MER compared with other seasons (Table 1). Larger MERs in Fall samples were driven by greater gas volume and CH4 concentrations in headspace; model-implied means of both variables nearly doubled in Fall compared with other seasons. Considering that all samples were incubated at the same temperature during the MER assay, greater MER during Fall may indicate that these samples had more abundant and active methanogen populations. Additionally, differences in chemical and physical properties of manure may have enhanced substrate availability for methanogenesis in Fall samples relative to other seasons.

Table 1. Results of a laboratory assay to estimate methane emission rate from dairy manure samples (n = 208) by incubating at 72°F in serum bottles for 3 days.
Model-Implied Mean (Confidence Interval)
Variable Spring Summer Fall Winter
Volume displacement, mL 14 (3, 25) 16 (4, 27) 26 (14, 37) 13 (0, 26)
Headspace methane, % 5 (3, 10) 8 (5, 16) 14 (8, 26) 6 (3, 12)
Methane emission rate,
mL CH4 L-1 d-1
13 (7, 25) 22 (11, 43) 41 (21, 79) 15 (7, 33)


Although our results illustrated that the mean MER was generally similar across categories of manure types, storage durations, and storage types, we found that between-farm differences accounted for 18% of the total variance in MER. In other words, samples from the same farm were correlated on average 0.18. This suggests that there are farm-to-farm differences in MER that were not explained by the predictors we considered as fixed effects.

Figure 1. Methane emission rates of samples (n = 208 points) showing the median and first and third quartiles (box) with whiskers 1.5 times the interquartile range.

Future Plans

In future work on this project, we plan to explore if between-farm differences in MER can be explained by other farm meta-data such as bedding type, manure removal frequency, storage volume, and surface area of manure. Additionally, we will explore relationships between manure chemical composition (total solids, volatile solids, total nitrogen) and MER. Similar to Andersen et al. (2015), we are examining the temperature sensitivity of methanogenesis in different sample types. In subsequent work, we may consider relating MER to other chemical constituents in manure samples related to substrate availability (e.g., fiber fractions) or fermentation end-products (e.g., volatile fatty acids).

Authors

Presenting author

MaryGrace Erickson, Postdoctoral Associate, University of Minnesota

Corresponding author

Erin Cortus, Associate Professor and Extension Engineer, University of Minnesota, ecortus@umn.edu

Additional author

Noelle Cielito Soriano, Ph.D. Candidate, University of Minnesota

Additional Information

Andersen, D. S., Van Weelden, M. B., Trabue, S. L., & Pepple, L. M. (2015). Lab-assay for estimating methane emissions from deep-pit swine manure storages. Journal of Environmental Management, 159, 18–26. https://doi.org/10.1016/j.jenvman.2015.05.003

Rotz, A., Stout, R., Leytem, A., Feyereisen, G., Waldrip, H., Thoma, G., Holly, M., Bjorneberg, D., Baker, J., Vadas, P., & Kleinman, P. (2021). Environmental assessment of United States dairy farms. Journal of Cleaner Production, 315, 128153. https://doi.org/10.1016/j.jclepro.2021.128153

Acknowledgements

We thank the farms who participated in this research for providing samples and data. Additionally, we are grateful to Kevin Bourgeault, Seth Heitman, Sabrina Mueller, and Jacob Olson for contributing to sampling and laboratory analysis. This research is supported by USDA NIFA Award 2023-68008-39859, and the Minnesota Rapid Agricultural Response Fund.


The authors are solely responsible for the content of these proceedings. The technical information does not necessarily reflect the official position of the sponsoring agencies or institutions represented by planning committee members, and inclusion and distribution herein does not constitute an endorsement of views expressed by the same. Printed materials included herein are not refereed publications. Citations should appear as follows. EXAMPLE: Authors. 2025. Title of presentation. Waste to Worth. Boise, ID. April 7-11, 2025. URL of this page. Accessed on: today’s date.