
Evaluation of the aerosol transmission of the porcine reproductive and respiratory (PRRS) virus from swine production systems

Purpose

Porcine reproductive and respiratory syndrome virus (PRRSV) is a major concern to the U.S. swine industry due to the severe economic loss it can cause. Its symptoms include severe flu-like symptoms, respiratory distress, fever, and premature abortions in pregnant sows. The virus is spread during close contact between pigs or exposure to contaminated urine, semen, feces, and nasal and mammary secretions (1). Control measures have proven exceedingly costly with PRRSV which causes an estimated $1 billion in lost production in the U.S. pork industry per year (3), an 80% increase from a decade earlier (2)(4). With very few, truly effective methods available to control PRRSV after the start of an outbreak, developing methods to mitigate the dispersion of the virus has become a major priority.

Common biosecurity measures for swine operations (e.g., controlled access, personal hygiene, animal management, pest control, and production area cleaning and disinfection) have proved insufficient to stop PRRSV transmission. Producers are, therefore, seeking to understand the potential risks posed by more novel transport methods. Observations of new PRRSV cases emerging during manure handling activities have raised questions about aerosolized manure as a potential transmission vector. This study was conducted to test this possibility in the following stages:

    1. Verify the presence of viable virus sample within pit manure, lagoon samples, or dust coming from barns with active PRRSv outbreaks.
    2. Develop a reliable method for collecting and preserving viable airborne viral samples.
    3. Assess the aerosol transmission “footprint” of PRRSV originating from positive swine farms to improve understanding of potential farm-to-farm disease transmission risks.

What Did We Do?

Novel air sampling devices were constructed by the project team (Figure 1) to be deployed inside and outside swine production units to accumulate samples of particulates and aerosols. The devices accommodate a commercially available Air Prep filter cartridge (innovaprep.com) to capture particulates pulled across the filter by a fan housed within the sampling unit.
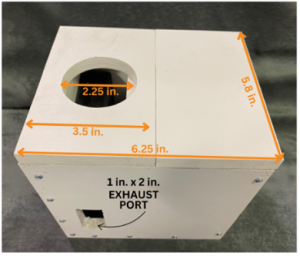
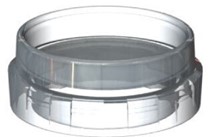
Figure 1. Air sampler unit constructed for this project (L) and commercial AirPrep Filter (R)


Our project team worked closely with the lead veterinarian at a large swine integrator in Nebraska to access farms within 5 to 7 d of pigs being confirmed PRRSV-positive. Sampling events 1 and 2 focused on evaluating PRRSV presence on indoor surfaces, fresh and stored manure, flies, and maggots. Sampling events 3 through 5 focused on evaluating PRRSV presence in air downwind of PRRSV-positive swine production areas or downwind of land application of manure from PRRSV-positive animals.

Sampling Event 1. A swine breeding operation was identified where animals were currently testing positive for and showing clinical signs of PRRSV infection. At this site, two production areas were selected at random for sampling. Surface swabs were collected from floors, fan louvers, and pen dividers. Fresh fecal samples were collected from sows in the same production areas, and an air sampler was placed on the floor in each room and allowed to operate for two hours before retrieving the filters. For surface samples, sterile swabs were swept over each surface type and then placed into phosphate buffered saline (PBS) elution buffer. Fresh fecal samples were collected using a sterile spatula and placed into clean sample containers. Upon retrieving filters from air samplers, a sterilized knife was used to separate the filter from the plastic casing in which it was mounted, and sterile forceps were used to transfer the filter into a PBS elution tube. All samples were transported on ice to the University of Nebraska-Lincoln (UNL) Schmidt Lab and then submitted to the Iowa State University Veterinary Diagnostic Laboratory for analysis by polymerase chain reaction (PCR).

Sampling Event 2. A swine finisher unit was identified where animals were currently testing positive for and showing clinical signs of PRRSV infection. At this site, two production areas were selected at random for sampling inside the building. Surface swabs were collected from floors, fan louvers, feeders, and pen dividers. An air sampler was placed on the floor in each room and allowed to operate for four hours before retrieving the filters. Additional air samplers were mounted outside the building. For one production area, three samplers were mounted at a height aligning with the center of a minimum ventilation fan and spaced at 5, 12, and 19 feet from the rim of the fan hood. For a second production area, two samplers were mounted at a height aligning with the center of a minimum ventilation fan and spaced at 5 and 13 feet from the rim of the fan hood. These samplers were allowed to run for three hours before filters were retrieved. For surface samples, sterile swabs were swept over each surface type and then placed into PBS elution buffer. Manure samples from two deep pit storage sections of the building were collected using a plastic pole and dipper cup and placed into clean plastic bottles. Maggots observed in one pump out port were collected by hand and placed into PBS elution buffer. Upon retrieving filters from air samplers, a sterilized knife was used to separate the filter from the plastic casing in which it was mounted, and sterile forceps were used to transfer the filter into a PBS elution tube. Flies present around the production buildings were also collected at this site. For one sample, approximately six flies were captured and placed directly into PBS elution buffer. For a second sample, approximately six flies were captured, placed into 70% EtOH for 10 s, and then transferred from the ethanol to PBS elution buffer. All samples were transported on ice to the UNL Schmidt Lab and then submitted to the Iowa State University Veterinary Diagnostic Laboratory for analysis by PCR.

Sampling Event 3. A naturally-ventilated PRRSV-positive swine farm was identified. Air samplers mounted on t-posts were deployed in an array at a height above the ground of roughly 6 ft at varying distances (10 yards to 1 mile) from the buildings after using smoke candles to confirm wind direction and dispersion. Sampling was conducted for approximately 2.5 hours on a day with 40-55°F temperature,10-20 mph winds, and full cloud cover (Figure 2).

Sampling Event 4. At a mechanically-ventilated PRRSV-positive swine farm, sampling was conducted using the same process as for Event 3 for approximately 21.25 hours starting on a day with 85-105°F temperature, 4-10 mph winds, and full sun exposure, then continuing overnight.

Sampling Event 5. Using the previously described process, sampling was conducted for approximately 2.5 hours on a day with 70-95°F temperature, 2-10 mph winds, and partly cloudy conditions downwind of a field where lagoon effluent from PRRSV-positive pigs was being applied via center pivot.

Figure 2. Air sampler array at the naturally ventilated swine farm

All samples were submitted to the Iowa State Veterinary Diagnostic Lab for RT-qPCR analysis to identify PRRS viral genomic material.

What Have We Learned?

Results of PCR analyses for sampling event 1 (Table 1) revealed that, in barns where swine oral fluid samples were positive for PRRSv, all surface samples collected were also positive or suspected positive for PRRSv. The same was true for all of the surface and air samples collected inside the barn and for the air samples located up to 19 ft minimum from the building ventilation fans during sampling event 2 (Table 2). Maggots taken from the manure pit during sampling event 2, along with sterilized and unsterilized flies, tested positive for PRRSV, as well. Conversely, all manure samples obtained during sampling event 2 tested negative using the methodologies employed. This outcome does not dismiss manure as a possible transmission source; rather, it underscores the need for ongoing research to develop a reliable detection method for PRRS within such a complex matrix.

The team has not yet recovered air samples testing positive for PRRSV from any of the exterior arrays in sampling events 3-5 (Table 3). This could be due to ambient air conditions during the tests which may have caused rapid destruction of the virus or dilution of the virus below detectable concentrations. The rolling terrain surrounding facilities where arrays of samplers were posted downwind of buildings or the land application site may have created turbulent air movement that diluted samples such that concentrations of PRRSV genomic material capture on filters were too low to produce a positive result by PCR.

Table 1. Cycle Threshold (Ct) values for sampling event 1

Sample Description Ct (Result)
Pen Floor, Room 17 37.5 (Suspect)
Fan Louver, Room 17 30.1 (Positive)
Feeder, Room 17 31.6 (Positive)
Air Filter, Room 17 31.2 (Positive)
Pen Floor, Room 18 31.5 (Positive)
Fan Louver, Room 18 31.4 (Positive)
Feeder, Room 18 37.6 (Suspect)
Air Filter, Room 18 30.5 (Positive)
Fecal Sample 1 ³40 (Negative)
Fecal Sample 2 ³40 (Negative)

Cycle threshold (Ct) indicates the number of PCR cycles required for the sample fluorescence to reach a predefined threshold for identification (<38 = positive, ~38-40 = suspect, ≥40 = negative). Lower Ct values correspond to higher viral RNA concentration.

Table 2. Cycle Threshold (Ct) values for sampling event 2

Sample Description Ct (Result)
Exhaust Air, Room 5, 5 ft from fan 33.1 (Positive)
Exhaust Air, Room 5, 12 ft. from fan 34.1 (Positive)
Exhaust Air, Room 5, 19 ft. from fan 38.1 (Suspect)
Indoor Air, Room 5, Rep 1 30.9 (Positive)
Indoor Air Room 5, Rep 2 33.3 (Positive)
Exhaust Air, Room 6, 5 ft from fan 32.6 (Positive)
Exhaust Air, Room 6, 13 ft. from fan 32.4 (Positive)
Flies 37.0 (Suspect)
Flies Sterilized in Ethanol 36.3 (Positive)
Maggots 39.9 (Suspect)
Floor, Room 5, Rep 1 32.4 (Positive)
Floor, Room 5, Rep 2 32.3 (Positive)
Louvers, Room 5, Rep 1 33.1 (Positive)
Louvers, Room 5, Rep 2 32.1 (Positive)
Pens, Room 5, Rep 1 37.9 (Positive)
Pens, Room 5, Rep 2 35.8 (Positive)
Feeder, Room 5, Rep 1 35.8 (Positive)
Feeder, Room 5, Rep 2 37.5 (Suspect)
Pens, Room 4, Rep 1 35.6 (Positive)
Pens, Room 4, Rep 2 35.3 (Positive)
Floor, Room 4, Rep 1 31.4 (Positive)
Floor, Room 4, Rep 2 32.9 (Positive)
Louvers, Room 4, Rep 1 33.0 (Positive)
Louvers, Room 4, Rep 2 32.1 (Positive)

Cycle threshold (Ct) indicates the number of PCR cycles required for the sample fluorescence to reach a predefined threshold for identification (<38 = positive, ~38-40 = suspect, ≥40 = negative). Lower Ct values correspond to higher viral RNA concentration.

Table 3. Cycle Threshold (Ct) values for sampling events 3 through 5

Sampling Event Sample Description Ct (Result)
Event 3 Air Filters (n=2) ³40 (Negative)
Event 4 Air Filters (n=4) ³40 (Negative)
Fans (n=4) ³40 (Negative)
Oral Fluids, Room 15 34.0 (Positive)
Oral Fluids, Room 16 36.1 (Positive)
Oral Fluids, Room 17 38.0 (Suspect)
Oral Fluids, Room 18 34.7 (Positive
Event 5 Air Filters (n=4) ³40 (Negative)

Cycle threshold (Ct) indicates the number of PCR cycles required for the sample fluorescence to reach a predefined threshold for identification (<38 = positive, ~38-40 = suspect, ≥40 = negative). Lower Ct values correspond to higher viral RNA concentration.

Future Plans

It is essential to identify which ambient weather conditions, if any, are favorable for air dispersion of infective PRRSv and which conditions will significantly limit dispersion. As research continues, the suspected ideal conditions for sampling downwind of mechanically ventilated PRRSv-positive barns or irrigation systems applying lagoon effluent from PRRSv-positive pigs will be 0 to 50°F with low to moderate wind speed and full cloud cover. At least 24 hours of continuous sampling is also expected to produce greater opportunity for positive air samples.

The continued inability to isolate the virus from manure samples is curious, given the universally positive samples we identified from the positive barns. However, the PRRSV is believed to require as few as 10 viral particles to be transmitted. Given the potentially very low concentration of viral material in manure, and the significant PCR inhibitors present in complex organic samples, the team continues to explore new sample preparation and testing methods for this matrix.

Lastly, further investigation into the potential roles of flies and maggots is warranted, particularly with the discovery of sufficient PRRSV genomic material in the gut of surface sterilized flies to yield a positive PRRSV result via RT-qPCR.

Authors

Presenting author

Logan Hafer, Undergraduate Research Assistant, Department of Biological Systems Engineering, University of Nebraska-Lincoln

Corresponding author

Dr. Amy Millmier Schmidt, Professor, Department of Biological Systems Engineering and Department of Animal Science, University of Nebraska-Lincoln, aschmidt@unl.edu

Additional author(s)

Dr. Benny Mote, Associate Professor, Department of Animal Science, University of Nebraska-Lincoln

Dr. Hiep Vu, Associate Professor, Department of Animal Science, University of Nebraska-Lincoln

Additional Information

    1. Porcine Reproductive and Respiratory Syndrome virus (PRRSV). Iowa State University – College of Veterinary Medicine; 2024 [accessed 2024 November 22]. https://vetmed.iastate.edu/vdpam/FSVD/swine/index-diseases/porcine-reproductive.
    2. Butler, J. E., Lager, K. M., Golde, W., Faaberg, K. S., Sinkora, M., Loving, C., & Zhang, Y. I. 2014. Porcine reproductive and respiratory syndrome (PRRS): an immune dysregulatory pandemic. Immunologic research, 59, 81-108. https://link.springer.com/article/10.1007/s12026-014-8549-5.
    3. Dee, S., T. Clement, and E. Nelson. 2023. Transmission of porcine reproductive and respiratory syndrome virus in domestic pigs via oral ingestion of feed material. J of the Am Vet Med Assoc, 262(1). https://doi.org/10.2460/javma.23.08.0447
    4. Osemeke, O.H., T. Donovan, K. Dion, D.J. Holtkamp and D.C.L. Linhares. 2021. Characterization of changes in productivity parameters as breeding herds transitioned through the 2021 PRRSV Breeding Herd Classification System. J Swine Health Prod. 2022;30(3):145-148. https://doi.org/10.54846/jshap/1269

Acknowledgements

Funding for this research was provided by the Nebraska Pork Producers Association under award #22-063 and an Undergraduate Student Research Program award from the UNL Institute of Agriculture and Natural Resources, Agricultural Research Division.


The authors are solely responsible for the content of these proceedings. The technical information does not necessarily reflect the official position of the sponsoring agencies or institutions represented by planning committee members, and inclusion and distribution herein does not constitute an endorsement of views expressed by the same. Printed materials included herein are not refereed publications. Citations should appear as follows. EXAMPLE: Authors. 2025. Title of presentation. Waste to Worth. Boise, ID. April 711, 2025. URL of this page. Accessed on: today’s date. 

Impacts on Soil Properties, E. Coli Prevalence, and Soybean Yield from Surface-Applied Swine Mortality Compost During a Single Growing Season in Eastern Nebraska

Purpose

Livestock producers dealing with animal mortalities may opt for composting as a biosecure on-farm carcass disposal method. The composting process accelerates the decomposition of animal remains, stabilizes nutrients, and, when executed correctly, subjects the carcasses to elevated temperatures capable of eliminating pathogens. Nevertheless, the use of compost derived from animal mortalities may introduce potentially harmful nutrients, heavy metals, pharmaceuticals, or pathogens to cropland when applied as a soil amendment (Sims and Kleinman, 2005).

At the same time, mortality compost represents a potential soil health amendment due to its high carbon content. With carbon being an important building block for organic matter in the soil, the soil will have improved structure and water-holding capacity if carbon content is elevated. There will also be increased microbial activity adding to the soil’s microbial diversity and nutrients present.

This study aimed to confirm these findings and to determine the balance of positive and negative impacts of mortality compost application in Eastern Nebraska by exploring key biological and chemical risk factors in soil receiving swine mortality compost over the course of one growing season.

What Did We Do?

This experiment was conducted at the University of Nebraska Rogers Memorial Farm, located 11 miles east of Lincoln, Nebraska. The study site was comprised of silty clay loam soil that had been cropped using a long-term no-till management system with controlled wheel traffic. Background soil and compost chemical results are portrayed in Table 1. Corn was grown during the previous season, and soybeans were grown during the period of this study. Eight plots (15’ x 15’) were established and randomly assigned to either a 20-ton/ac application of swine mortality compost or no application (control). The compost, made with swine mortalies and a bulking agent of wood chips, was applied to the surface one week after planting.

In-season sampling. Two weeks following treatment application, and every two weeks during the growing season thereafter, soil from each plot was collected from the top 0-4” of the soil profile by random core sampling using a 2 in diameter hand probe. A roughly 200 g composite sample of soil from each plot was used for subsequent analysis. Soil temperature was also recorded for each plot on sampling days at two random locations to depths of 2” and 4” at each location using a hand temperature probe.

Soil samples were assessed in the UNL Schmidt Laboratory in the Department of Biological Systems Engineering for moisture content by drying soil for 48 hours at 221°F, and for the mean weight diameter of wet-stable aggregates by wet-sieving for 10 min at a rate of 30 vertical oscillations per minute. Several biological properties of the soil were also examined, including E.coli prevalence, determined by the proportion of positive samples following enrichment of eight 1-g subsamples of soil in LB broth (Miller) for 8 h at 98.6°F followed by culturing on ChromAgar E.coli selective media for 24 h at 98.6°F. Microbial respiration was measured for two 20-g samples of air-dried soil per plot placed into a 33.8 fl oz glass jar containing a 0.5 fl oz vial of 0.5 M potassium hydroxide (KOH). The soil was re-wet with 0.24 fl oz of deionized water before jars were sealed and incubated at 77°F for 4 days, and the mass of CO2 released during the incubation was determined using the difference in electrical conductivity in the trap material. Finally, metabolic functional diversity was observed for the soil microbial populations by determining the oxidation rates of 31 different carbon substrates using Biolog® EcoPlates following a 48-hour incubation at 77°F of a 10-4 dilution of a 3 g soil sample. Soil microbes in the EcoPlate wells cause oxidation of the carbon species in the plates and results in a color change, which is measured by a microplate reader at 590 and 750 optical density (OD) units. The overall average color intensity, a measure of general population size and activity, as well as the proportional activity by metabolic type (amino acids, carbohydrates, carboxylic acids, polymers, and amines/amines), were considered as ecological soil health indicators in this study.

Harvest and post-harvest sampling. Grain yields were determined by hand harvesting a row length equal to 1/1000 ac from each plot. Soybeans were dried and weighed, and yield values were then converted to bu/ac using a standard 15% moisture content for the soybeans.

Following harvest, soil from each plot was retrieved according to the previously detailed methodology and sent to a commercial laboratory to determine end-of-season values for pH, sum of cations, soluble salts, calcium, organic matter (%), nitrate-N, phosphate (P2O5), potassium (K2O), sulfate, sodium, magnesium, zinc, iron, copper, manganese and heavy metals (arsenic, lead, and chromium) in the top 0-4” of the soil profile. Bulk density was also determined for two locations per plot at depths of 0-2″ and 2-4″.

Table 1. Initial chemical characteristics of compost and soil

Chemical Compost Soil
pH 7.1 6.6
Soluble salts (mmho/cm) 11.4 0.13
Zinc, ppm 57.6 1.12
Iron, ppm 1477 44.8
Copper, ppm 13.4 0.73
Manganese, ppm 100.6 9.2
Arsenic, ppm 1.807 5.971
Lead, ppm 2.09 14.46
Chromium, ppm 7.48 35.85

What Have We Learned?

The application of the compost treatment significantly increased the prevalence of E. coli in the soil samples, but only early (4 weeks) in the growing season (Figure 1). This is likely influenced by the compost’s organic matter and microbial diversity, which serve as a carbon source and support microbial population growth. However, as the season progressed, the difference in the prevalence of E.coli in soil that had or had not received compost application narrowed, potentially due to other factors impacting microbial survivability (such as temperature or moisture content) becoming dominant factors. Regression analysis comparing E.coli prevalence to soil moisture and temperature did not show a strong relationship (R-squared values of 0.48 and 0.18, respectively), which indicates that the microbial population is being impacted by other, more complex factors not included in this analysis.

No other soil biology, chemistry, or physical properties that we tested proved to be significantly impacted (a ≥ 0.05) by the application of mortality compost to the soil, nor was the soybean grain yield. This indicates that while the soil health impacts of this single-season compost application were negligible, there is also little risk to water quality associated with the application of 20 ton/ac swine mortality compost in crop production areas that are well-managed with soil conservation best practices.

Figure 1. Prevalence of E.coli in soil over time following compost application.Symbols next to values in week 4 denote a significant difference in the proportion of E.coli-positive samples. Error bars represent SEM (n=4).
Figure 1. Prevalence of E.coli in soil over time following compost application.
Symbols next to values in week 4 denote a significant difference in the proportion of E.coli-positive samples. Error bars represent SEM (n=4).

Future Plans

The results suggest that there is little risk of prolonged elevated E. coli prevalence in soil when using swine mortality compost in row crop production areas. However, precipitation producing runoff may pose a risk to nearby surface water bodies if experienced within six weeks of compost application. Future research would be required to fully understand the risk of this occurring, but previous research conducted at the same farm determined that a 12.2 m (40 ft) setback of bare soil was sufficient to prevent most chemical and biological pollutants from leaving a field via runoff after receiving surface application of manure (Gilley et al., 2017).  This is an encouraging and valuable guideline for producers who are generating compost as part of their operation and must find suitable sites for application.

The negligible soil health improvements from mortality compost application during this single-season study could dissuade crop producers from seeking out this material if it were available in their vicinity. However, where organic matter is needed to improve soil health over time, this product should not be discounted as a valuable soil carbon amendment. While we did not observe any positive soil health impacts from a single 20 ton/ac application of compost in this study, other studies have seen single season effects. Several other studies found significant impacts of applying a single season of organic amendment on soil microbial biomass (Lazcano, et al., 2012; Leytem, et al., 2024; Crecchio, et al., 2001) and on C:N ratio, which were not tested in this study. Thus, future research could explore alternative rates of application, frequency of sampling, or testing methodologies.

Another possible explanation for the lack of significant soil health impacts was that the field used in this study has been under long-term conservation (20+ years of no-till) practices. As a result, we suspect that the soil health improvement gap (e.g., the difference between soil health status and potential soil health status under ideal management) may be quite minimal. Soil sampled from our plots prior to treatment application revealed an average organic matter (OM) concentration of 3.8%, which exceeds the average 2 to 3% OM concentration for this soil type (Magdoff et al, 2021). However, other soil health factors such as bulk density, microbial population richness, and organic nutrient availability were in line with reports for similar soil types (Oregon State University Extension Service., 2019; Chau et al., 2011; University of Florida., 2015). This likely indicates that future applications of this sort should avoid fields with elevated soil organic matter, as they will not greatly benefit from the addition of organic amendments where soil carbon is already sufficient to the needs of the soil ecosystem.

Authors

Presenting author

Jillian Bailey; Undergraduate Researcher; Department of Biological Systems Engineering; University of Nebraska-Lincoln

Corresponding author

Amy Schmidt, Professor, Department of Biological Systems Engineering, University of Nebraska-Lincoln, aschmidt@unl.edu

Additional author

Mara Zelt, Research Technologist, Department of Biological Systems Engineering, University of Nebraska-Lincoln

Additional Information

Castro, G., Schmidt, A. (2023). Evaluation of Swine Cadaver Disposal through Composting and Shallow Burial with Carbon (poster presentation). ASABE AIM. Omaha, NE. https://publuu.com/flip-book/818714/1802503

Crecchio, C., Curci, M., Mininni, R., Ricciuti, P., & Ruggiero, P. (2001). Short-term effects of municipal solid waste compost amendments on soil carbon and nitrogen content, some enzyme activities and genetic diversity. Biology and Fertility of Soils, 34(5), 311–318. https://doi.org/10.1007/s003740100413

Gilley, J. E., Bartelt-Hunt, S. L., Eskridge, K. M., Li, X., Schmidt, A. M., & Snow, D. D. (2017). Setback distance requirements for removal of swine slurry constituents in runoff. Transactions of the ASABE, 60(6), 1885–1894. https://doi.org/10.13031/trans.12310

Lazcano, C., Gómez-Brandón, M., Revilla, P., & Domínguez, J. (2012). Short-term effects of organic and inorganic fertilizers on soil microbial community structure and function. Biology and Fertility of Soils, 49(6), 723–733. https://doi.org/10.1007/s00374-012-0761-7

Leytem, A.B., Dungan, R.S., Spiehs, M.J., Miller, D.N. (2024). Safe and sustainable use of bio-based fertilizers in agricultural production systems. In: Amon, B., editor. Developing Circular Agriculture Production Systems. 1st edition. Cambridge, UK: Burleigh Dodds Science Publishing. p. 179-214. https://doi.org/10.19103/AS.2023.0120.16

Magdoff, F., Es, Harold van. (2021) (2024, July 18). CH 3. Amount of organic matter in soils – SARE. USDA Sustainable Agriculture Research and Extension. https://www.sare.org/publications/building-soils-for-better-crops/amount-of-organic-matter-in-soils/

Oregon State University Extension Service, Horneck, D. A., Sullivan, D. M., Owen, J., & Hart, J. M. (2019). Soil Test Interpretation Guide. In EC 1478. https://extension.oregonstate.edu/sites/default/files/catalog/auto/EC1478.pdf

Sims, J. T., & Kleinman, P. J. A. (2005). Managing Agricultural Phosphorus for Environmental Protection. In J. T. Sims, & A. N. Sharpley (Eds.) Phosphorus: Agriculture and the Environment (Vol. 46, pp. 1021-1068). American Society of Agronomy. https://doi.org/10.2134/agronmonogr46.c31

University of Florida. (2015). Urban Design – Landscape plants – Edward F. Gilman – UF/IFAS. (n.d.-b). https://hort.ifas.ufl.edu/woody/critical-value.shtml

Acknowledgements

Funding for this study was provided by the Agricultural Research Division (ARD) of the University of Nebraska-Lincoln through an Undergraduate Student Research Program grant award. Much gratitude is extended to collaborating members of Rogers Memorial Farm, Stuart Hoff and Paul Jasa, and to the members of the Schmidt Lab – Alexis Samson, Logan Hafer, Maddie Kopplin, and Carol Calderon – for their assistance with sample collection and analysis.


The authors are solely responsible for the content of these proceedings. The technical information does not necessarily reflect the official position of the sponsoring agencies or institutions represented by planning committee members, and inclusion and distribution herein does not constitute an endorsement of views expressed by the same. Printed materials included herein are not refereed publications. Citations should appear as follows. EXAMPLE: Authors. 2025. Title of presentation. Waste to Worth. Boise, ID. April 711, 2025. URL of this page. Accessed on: today’s date. 

MaNuRe About

Management of Nutrients for Reuse (MaNuRe) aims to address the need in livestock agriculture to better manage and reuse both water and nutrient resources. MaNuRe is a multi-university, multi-disciplinary project to develop, assess, and support the best in manure treatment technology.

With the combination of continued global population growth and trend of extreme climate events and the resulting variability in reliable water resources, the requirement of water recycling becomes an integral part of agriculture wastewater resource management. Important nutrients are also lost to wastewaters, but could be recycled and reused for food production. Water treatment and nutrient needs vary geographically and change based on production, thus the user-driven strategy inherently demands a systems-based, flexible decision-making approach.

Mission and Goals

Our Team

Articles and Publications

Extension and Outreach

ManureTech DST

Research

History of Public Attitudes Toward Microbial Diseases

The national extension team iAMResponsible teaches a multi-university virtual course on antimicrobial resistance across the one health spectrum every spring, some of the course materials are now available here at LPELC.

Here we include a lecture by Dr. Kari Nixon of Whitworth University on the history of public attitudes toward microbial diseases. Continue reading “History of Public Attitudes Toward Microbial Diseases”

Risk-Based Approach to Combatting Antimicrobial Resistance

The national extension team iAMResponsible teaches a multi-university virtual course on antimicrobial resistance across the one health spectrum every spring, some of the course materials are now available here at LPELC.
This lecture, from Dr. Bing Wang of the University of Nebraska, is a discussion of risk-based modeling, its use for assessing AMR interventions, and determining priorities for addressing the problem.

Continue reading “Risk-Based Approach to Combatting Antimicrobial Resistance”

Introduction to Antimicrobial Resistance

The national extension team iAMResponsible teaches a multi-university virtual course on antimicrobial resistance across the one health spectrum every spring, some of the course materials are now available here at LPELC.
This is a recording of the very first lecture for the Antimicrobial Resistance from a One Health Perspective course, presented by Drs Stephanie Lansing and Amy Schmidt, leaders of the iAMResponsible Team, it provides an introduction to antimicrobial resistance. Continue reading “Introduction to Antimicrobial Resistance”

Antimicrobial Resistance is Native to the Environment

Germs are everywhere, some resistant to medical treatment

When I was a kid, I remember being called inside for lunch on a summer day and hearing, “Wash your hands! You’ve been playing in the dirt!” Of course, we all grew up knowing that dirty hands can spread germs. But, I didn’t know until I was much older that the same soil that made my hands dirty was also the source of some pretty amazing medicines. Continue reading “Antimicrobial Resistance is Native to the Environment”