For a long time, farmers have realized the benefits of using manure as a nutrient source. The ratio of various nutrients in manure, however, rarely matches the exact plant needs. Consequently, farmers must choose between overapplying some nutrients, or underapplying others and meeting the remaining needs with commercial fertilizers. Figuring out nitrogen (N) credits can be a difficult task since the total amount of N found in manure is not fully available the year of application, nor even after the second year of application. In addition, understanding P availability in manure is necessary because excess P can ultimately lead to eutrophication of surface waters. The amount of N that is available will depend on several factors such as animal species, bedding (if any), manure storage, and application method. We assume approximately 80% of the total manure P is available the first year, but even this can vary depending on soil texture, manure chemistry, and weather conditions. Current University of Minnesota recommendations help determine N and P credits for a variety of manures (Hernandez and Schmitt 2012). These recommendations were developed several decades ago and need an update since the diets of animals, storage of manures, and manure application equipment have changed over the years. Therefore, the primary purpose of this study is to estimate N and P mineralization from a variety of manures and soil types across different temperature regime. Our goal is to verify and/or update N and P credit recommendations from manure so that farmers are able to make better decisions when purchasing and applying commercial fertilizers in following years.
What did we do?
Laboratory incubations were used to assess N and P release characteristics from a variety of manures in several different soil types. The incubation studies were a complete factorial with 4 replications and with manure type, soil type, and temperature as the main factors. We also included a control treatment that did not include any manure application to see how much nitrogen and phosphorus mineralized from the soils themselves. We tested 8 manures, including: dairy liquid (separated and raw [non-separated]), swine liquid (from a finishing house and a sow barn), beef manure (solid bedded pack and liquid from a deep pit), and poultry (turkey litter and chicken layer manure). Manure analyses to determine nutrient content were conducted on all samples prior to incubations. Soils for the incubations included a coarse textured soil from the Sand Plain Research Center at Becker, MN; a medium textured soil from a research field near Rochester, MN; and a fine textured soil from the West Central Research and Outreach Center in Morris, MN. Soils were collected from the top six inches of soil at each location in bulk and then air dried, ground down to pass a 2-mm sieve, and analyzed for nutrient and organic matter content.
One liter clear glass canning jars were filled with 200 g of sieved soil and were kept at 60% of field capacity which was maintained by weighing every 4-6 days and adding deionized water as needed to replace the weight lost. We used the University of Minnesota guidelines and manure analysis results to calculate the appropriate application rate for each manure type. During the incubation study, the temperature inside the incubator was kept at either 25⁰C (77⁰F). We collected subsamples at 0, 7, 14, 28, and 56 days after the experiment had begun. Subsamples were destructively analyzed for potassium chloride extractable ammonium and nitrate and Bray-1 or Olsen extractable phosphate. Figure 1 shows the schematics of our experimental set-up and components.
Figure 1: Growth chamber incubation study experimental set-up.
What have we learned?
At the time of writing, the experiment has only been run at one temperature, 25⁰C (77⁰F) and subsamples for days 0-28 have been collected. Ammonium and nitrate have been analyzed for subsamples for days 0-14. The remaining treatments will be completed later in 2019. Statistical analyses have not been conducted at this time.
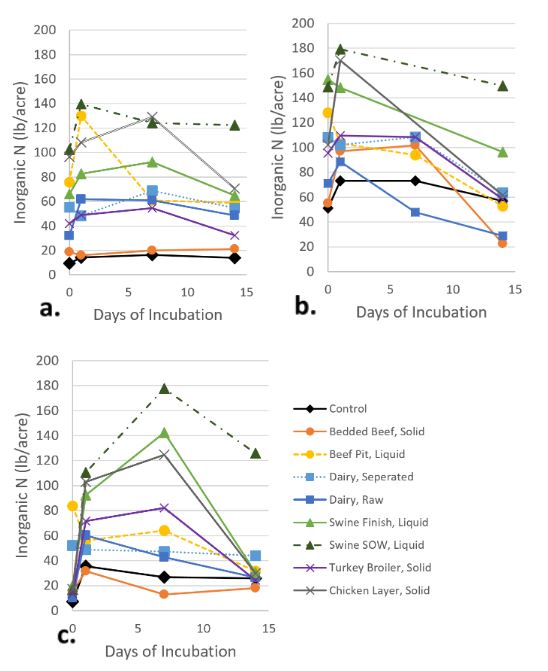
The results of the initial soil and manure tests can be found in Tables 1 and 2, respectively. This will give an idea of the starting conditions of the soils and manures. For visual reference, Figure 2 shows the inorganic N (ammonium + nitrate) from each treatment from days 0-14 for the incubation at 25⁰C. The control samples showed that more inorganic N was present in the medium textured soil than the other soils. In general, the swine manure from both finisher and sow barns released the most inorganic N compared with other manures. Of the beef manures, the liquid deep pit manure tended to release more inorganic N than the bedded pack manure, likely due to the lack of bedding to tie up nitrogen. Of the dairy manures, the raw and liquid separated tended to release inorganic N similarly, except in the medium textured soil where the liquid separated manure released more inorganic N. Across soil types, the inorganic N release tended to be stable in the coarse textured soil, while in the medium and fine textured soil, it appears to have increased initially then slowly decreased. It is unclear why this may have happened but could be due to volatilization of ammonium, denitrification of nitrate, or immobilization of N into organic forms. More tests are needed and will be completed later in 2019.
Table 1. Initial characteristics of three soil types used in this study: coarse textured soil from Becker, MN; medium textured soil from Rochester, MN; and a fine-textured soil from Morris, MN.
Soil Characteristics
Soil Textural Class
Coarse
Medium
Fine
Organic matter (%)
1.1
1.0
3.3
pH
5.1
5.2
7.9
Phosphorus – Olsen (ppm)
11
8
7
Potassium (ppm)
95
101
140
Magnesium (ppm)
42
49
570
Calcium (ppm)
274
310
3482
Ammonium (ppm)
3.4
2.8
8.6
Nitrate (lb/acre)
3.0
2.5
8.5
Table 2. Initial characteristics of eight manure types used in this study. The units of nutrients are in pounds per ton for solid manure and in pounds per 1000 gallons for liquid manure.
Species Type
Manure Type
Moisture
Total N
Ammonium-N
Total P (as P2O5)
Total K (as K2O)
C:N Ratio
(%)
(lbs per unit)
(lbs per unit)
(lbs per unit)
(lbs per unit)
Beef
Bedded Pack, Solid
60.5
13.43
2.37
9.59
18.01
22:1
Deep Pit, Liquid
86.6
56.72
36.7
23.43
30.83
9:1
Dairy
Separated, Liquid
93.2
32.7
15.8
13.31
29.26
7:1
Raw, Liquid
88.9
33.17
15.66
13.08
31.29
13:1
Swine
Finisher, Liquid
86.8
59.16
41.63
37.63
27.35
9:1
Sow, Liquid
99.3
16.5
15.69
1.38
11.34
1:1
Poultry
Chicken Layer, Solid
48.6
55.51
14.39
35.78
25.91
7:1
Turkey Litter, Solid
53.0
28.2
13.16
26.69
28.65
12:1
Figure 2. The amount of inorganic-N (the sum of ammonium-N + nitrate-N) in soil mixed with various manure types in: a. coarse textured soil from Becker, MN; b. medium textured soil from Rochester, MN; and c. fine textured soil from Morris, MN.
Future plans
We plan to analyze all the 25 °C samples for nitrogen and phosphorus as well as samples from experiment at 15 and 5 °C this year. We also collected ammonia (NH3) gas samples from the headspace of each jars. We plan to analyze these samples to understand the effects of manure application on ammonia volatilization losses. In addition, on a separate set of experiments we deployed anion and cation exchange resins in each jar. These resins were replaced each week on average. We plan to extract these resins for N and P.
This material is based on work that is supported by the Sugarbeet Research and Education Board of Minnesota and North Dakota as well as the Agricultural Fertilizer Research and Education Council of Minnesota.
Additional information
Hernandez JA, Schmitt MA. 2012. Manure management in Minnesota. Saint Paul (MN): University of Minnesota Extension [accessed 24 Nov 2017].
Pagliari PH, Laboski CAM. 2014. Effects of manure inorganic and enzymatically hydrolyzable phosphorus on soil test phosphorus. Soil Soc. of Am. J. 78(4): 1301-1309.
Russelle MP, Blanchet KM, Randall GW, Everett LA. 2009. Characteristics and nitrogen value of stratified bedded pack dairy manure. Crop Management 8(1). https://dl.sciencesocieties.org/ publications/cm/abstracts/8/1/2009-0717-01-RS.
The authors are solely responsible for the content of these proceedings. The technical information does not necessarily reflect the official position of the sponsoring agencies or institutions represented by planning committee members, and inclusion and distribution herein does not constitute an endorsement of views expressed by the same. Printed materials included herein are not refereed publications. Citations should appear as follows. EXAMPLE: Authors. 2019. Title of presentation. Waste to Worth. Minneapolis, MN. April 22-26, 2019. URL of this page. Accessed on: today’s date.
This project involves the analysis of a new data set for manure characteristics from open lot beef systems demonstrating both average characteristics and factors contribution to variability in manure characteristics among these systems. Defining the characteristics and quantities of harvested manure and runoff from open earthen lot animal systems is critical to planning storage requirements, land requirements for nutrient utilization, land application rates, and logistical issues, such as equipment and labor requirements. Accuracy of these estimates are critical to planning processes required by federal and state permitting programs. Poor estimates can lead to discharges that result in court action and fines, neighbor nuisance complaints, and surface and ground water degradation. Planning procedures have historically relied upon standard values published by NRCS (Stettler et al., 2008), MWPS (Lorimor et al., 2000), and ASABE (2014) for average characteristics.
What Did We Do?
A large data set of analyses from manure samples collected over a 15-year period from 444 independent cattle feedlot pens at a single eastern Nebraska research facility was reviewed to provide insight to the degree of variability in observed manure characteristics and to investigate the factors influencing this variability. No previous efforts to define these characteristics have included data gathered over such a wide range of dietary strategies and weather conditions. This exclusive research data set is expected to provide new insights regarding influential factors affecting characteristics of manure and runoff harvested from open lot beef systems. The objective of this paper is to share a preliminary summary of findings based upon a review of this data set.
What Have We Learned?
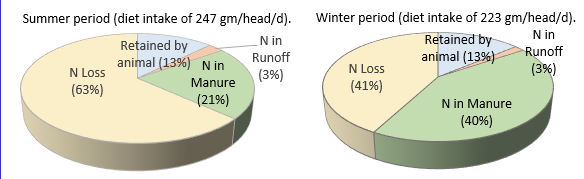
A review of this unique data set reveals several important preliminary observations. Standard values reported by ASABE and MWPS for beef manure characteristics in open lot systems are relatively poor indicators of the significant variability that is observed within open lot feeding systems. Our data set reveals significant differences between manure characteristics as a function of feeding period (Table 1) and substantial variability within feeding period, as illustrated by the large coefficients of variation for individual characteristics. Differences in winter and summer conditions influence the characteristics and quantities of solids, organic matter, and nutrients in the harvested manure. The timing of the feeding period has substantial influence on observed differences in nitrogen loss and nitrogen in manure (Figure 1). Nitrogen recovery for the warmer summer feeding periods averaged 51 and 6 grams/head/day in the manure and runoff, respectively, with losses estimated to be 155 grams/head/day. Similarly, nitrogen recovery in manure and runoff for the winter feeding period was 90 and 4 grams/head/day, respectively, with losses estimated at 92 grams/head/day (Figure 1 and Koelsch, et al., 2018). In addition, differences in weather and pen conditions during and following winter and summer feeding periods impact manure moisture content and the mixing of inorganics with manure (Table 1).
Table 1. Characteristics of manure collected from 216 and 228 cattle feedlot pens during Summer and Winter feeding periods, respectively1.
University of Nebraska Feedlot in East Central Nebraska
1 Summer = April to October feeding period, Winter = November to May feeding period
2 Coefficient of variation, %
3 Unsurfaced lot in dry climate with annual manure removal.
Figure 1. Distribution of dietary nitrogen consumed by beef cattle among four possible ed points for summer and winter feeding periods.
Dietary concentration of nutrients was observed to influence the harvested manure P content (Figure 2) but produce minimal impact on harvested manure N content (not shown). Diet was an important predictor in observed N losses, especially during the summer feeding period. However, its limited value for predicting harvested manure N and moderate value for predicting harvesting manure P suggests that other factors such as weather and management may be influential in determining N and P recovered (Koelsch, et al., 2018).
Figure 2. Influence of dietary P concentration on harvested manure P.
Significant variability exists in the quantity of total solids of manure harvested with a factor of 10 difference between the observed low and high values when compared on a mass per finished head basis (note large CVs in Table 1). This variability has significant influence on quality of the manure collected as represented by organic matter, ash content, and moisture content.
Although individual experimental trials comparing practices to increase organic matter on the feedlot surface have demonstrated some benefit to reducing nitrogen losses, the overall data set does not demonstrate value from higher pen surface organic matter for conservation of N in the manure (Koelsch, et al., 2018). However, higher organic matter manure is correlated to improved nitrogen concentration in the manure suggesting a higher value for the manure (Figure 3).
Figure 3. Influence of pen surface organic matter measured as organic matter in the harvested manure) on nitrogen concentration in the manure.
It is typically recommended that manure management planning should be based upon unique analysis for manure characteristics representative of the manure being applied. The large variability in harvested manure from open lot beef systems observed in this study further confirms the importance of this recommendation. The influence of weather on the manure and the management challenges of collecting manure from these systems adds to the complexity of predicting manure characteristics. In addition, standard reporting methods such as ASABE should consider reporting of separate standard values based upon time of the year feeding and/or manure collection period. This review of beef manure characteristics over a 15 year period further documents the challenge of planning based upon typical or standard value for open lot beef manure.
Future Plans
The compilation and analysis of the manure and runoff data from these 444 independent measure of feedlot manure characteristics is a part of an undergraduate student research experience. Final review and analysis of this data will be completed by summer 2019 with the data published at a later time. The authors will explore the value of this data for adjusting beef manure characteristics for ASABE’s Standard (ASABE, 2014).
References
ASABE. 2014. ASAE D384.2 MAR2005 (R2014): Manure Production and Characteristics. ASABE, St. Joseph, Ml. 32 pages.
Lorimor, J., W. Powers, and A. Sutton. 2000. Manure characteristics. Manure Management Systems Series MWPS-18. Midwest Plan Service. Ames Iowa: Iowa State University.
Stettler, D., C. Zuller, D. Hickman. 2008. Agricultural Waste Characteristics. Chapter 4 of Part 651, NRCS Agricultural Waste Management Field Handbook. pages 4-1 to 4-32.
Authors
Richard (Rick) Koelsch, Professor of Biological Systems Engineering and Animal Science, University of Nebraska-Lincoln
rkoelsch1@unl.edu
Megan Homolka, student, and Galen Erickson Professor of Animal Science, University of Nebraska-Lincoln
The authors are solely responsible for the content of these proceedings. The technical information does not necessarily reflect the official position of the sponsoring agencies or institutions represented by planning committee members, and inclusion and distribution herein does not constitute an endorsement of views expressed by the same. Printed materials included herein are not refereed publications. Citations should appear as follows. EXAMPLE: Authors. 2019. Title of presentation. Waste to Worth. Minneapolis, MN. April 22-26, 2019. URL of this page. Accessed on: today’s date.
Animal production is part of a larger agricultural nutrient recycling system that includes soil, water, plants, animals and livestock excreta. When inefficient storage or utilization of nutrients occurs, parts of this cycle become overloaded. The U.S. Beef industry has made great strides in improving production efficiency with a significant emphasis on improving feed efficiency. Improved feed efficiency results in fewer excreted nutrients and volatile organic compounds (VOC) that impair environmental quality. Anabolic steroids are used to improve nutrient feed efficiency which increases nitrogen retention and reduces nitrogen excretion. This study was conducted to determine the methane (CH4), carbon dioxide (CO2), nitrous oxide (N2O), odorous VOCs, ammonia (NH3), and hydrogen sulfide (H2S) production from beef cattle manure and urine when aggressive steroid implants strategies were used instead of moderate implant strategies.
What Did We Do?
Two groups of beef steers (60 animals per group) were implanted using two levels of implants (moderate or aggressive). This was replicated three times, twice with spring-born calves and once with fall-born calves, for a total of 360 animals used during the study. Both moderate and aggressive treatment groups received the same initial implant that contain 80 mg trenbolone acetate and 16 mg estradiol. At second implant, steers in the moderate group received an implant that contained 120 mg trenbolone acetate and 24 mg estradiol, while those in the aggressive group received an implant that contained 200 mg trenbolone acetate and 20 mg estradiol. Urine and feces samples were collected individually from 60 animals that received a moderate implant and 60 animals that received an aggressive implant at each of three sampling dates (Spring and Fall 2017 and Spring 2018). Within each treatment, fresh urine and feces from five animals were mixed together to make a composite sample slurry (2:1 ratio of manure:urine) and placed in a petri dish. There were seven composite mixtures for each treatment at each sampling date. Wind tunnels were used to pull air over the petri dishes. Ammonia, carbon dioxide, and nitrous oxide concentrations were measured using an Innova 1412 Photoacoustic Gas Analyzer. Hydrogen sulfide and methane were measured using a Thermo Fisher Scientific 450i and 55i, respectively. Gas measurements were taken a minimum of six times over 24- to 27-day sampling periods.
What Have We Learned?
Flux of ammonia, hydrogen sulfide, methane, nitrous oxide, and total aromatic volatile organic compounds were significantly lower when an aggressive implant strategy was used compared to a moderate implant strategy. However, the flux of total branched-chained volatile organic compounds from the manure increased when aggressive implants were used compared to moderate implants. Overall, this study suggests that air quality may be improved when an aggressive implant is used in beef feedlot animals.
Table 1. Overall average flux of compounds from manure (urine + feces) from beef feedlot cattle implanted with a moderatea or aggressiveb anabolic steroid.
Hydrogen Sulfide
Ammonia
Methane
Carbon Dioxide
Nitrous Oxide
Total Sulfidesc
Total SCFAd
Total BCFAe
Total Aromaticsf
µg m-2 min-1
——–mg m-2 min-1——–
Moderate
4.0±0.1
2489.7±53.0
117.9±4.0
8795±138
8.6±0.1
0.7±0.1
65.2±6.6
5.9±0.5
2.9±0.3
Aggressive
2.7±0.2
2186.4±46.2
104.0±3.8
8055±101
7.4±0.1
0.8±0.1
63.4±5.7
7.6±0.8
2.1±0.2
P-value
0.01
0.04
0.01
0.01
0.01
0.47
0.83
0.05
0.04
aModerate treatment = 120 mg trenbolone acetate and 24 mg estradiol at second implant; bAggressive treatment = 200 mg trenbolone acetate and 20 mg estradiol at second implant; cTotal sulfides = dimethyldisulfide and dimethyltrisulfide; dTotal straight-chained fatty acids (SCFA) = acetic acid, propionic acid, butyric acid, valeric acid, hexanoic acid, and heptanoic acid; eTotal branch-chained fatty acids (BCFA) = isobutyric acid and isovaleric acid; fTotal aromatics = phenol, 4-methylphenol, 4-ethylphenol, indole, and skatole
Future Plans Urine and fecal samples are being evaluated to determine the concentration of steroid residues in the livestock waste and the nutrient content (nitrogen, phosphorus, potassium and sulfur) of the urine and feces.
Authors
mindy.spiehs@ars.usda.gov Mindy J. Spiehs, Research Animal Scientist, USDA ARS Meat Animal Research Center, Clay Center, NE
Bryan L. Woodbury, Agricultural Engineer, USDA ARS Meat Animal Research Center, Clay Center, NE
Kristin E. Hales, Research Animal Scientist, USDA ARS Meat Animal Research Center, Clay Center, NE
Additional Information
Will be included in Proceedings of the 2019 Annual International Meeting of the American Society of Agricultural and Biological Engineers.
USDA is an equal opportunity provider and employer.
Acknowledgements
The authors wish to thank Alan Kruger, Todd Boman, Bobbi Stromer, Brooke Compton, John Holman, Troy Gramke and the USMARC Cattle Operations Crew for assistance with data collection.
The authors are solely responsible for the content of these proceedings. The technical information does not necessarily reflect the official position of the sponsoring agencies or institutions represented by planning committee members, and inclusion and distribution herein does not constitute an endorsement of views expressed by the same. Printed materials included herein are not refereed publications. Citations should appear as follows. EXAMPLE: Authors. 2019. Title of presentation. Waste to Worth. Minneapolis, MN. April 22-26, 2019. URL of this page. Accessed on: today’s date.
Manure management is a major system on dairy farms, and there is a goal to minimize costs and maximize benefits. Technology that would reduce the mass of the manure to be spread, produce energy and a potential by-product for off-farm sales is needed. Adding wet gasification technology to existing manure systems with the goals of reduced spreading costs and possibly increased by-product sales was evaluated on a central New York farm that was considering expanding. For expansion to be possible, additional cropland was needed to recycle the additional manure at a further distance from the farmstead. An economic analysis examining the potential impact the wet gasification technology would have on the farm was conducted and results were shared with the dairy producer for use in making informed decisions.
What did we do?
A wet gasification technology that was presented by the manufacturer to be able to extract energy from manure solids (also reducing mass) was evaluated to determine the potential as an improvement to the farm’s existing manure management system. Application of this technology on an example farm was investigated to see what the applications might be on the existing farm (1,500 cows and 1,590 acres) and when expanded to 2,500 cows with 2,990 acres of cropland. Current and projected farm data along with cost and performance data from the manufacturer of the gasification system were used to perform an annual economic cost-benefit analysis as a way to determine the value of the system to the farm’s manure management enterprise.
Figure 1. Example Mass and Energy Flows for a Wet Gasification System
What have we learned?
There are many variables to consider, and the results of the sensitivity analysis show that the variables that influence the outcome of the total annual economic cost-benefit analysis are the ones least under the control of the technology provider or farm (capital cost, lost capital rate, milk production change due to bedding use change, nitrogen value of fertilizer, price of electricity, and value of the ash). Annual spreading costs at the time of analysis ranged from $36/acre for close fields with a low amount of manure spread, to $256/acre for further fields spread at a high amount of manure.
For the case farm analyzed, the system economics would only be favorable if optimistic values were assumed for some of the predictor variables such as high prices for the ash by-product and/or higher prices for the excess energy produced. Raw dairy manure’s moisture content is too high for efficient gasification. Wet gasification is better suited to operations where the raw manure has lower moisture content (due to substantial bedding use) or can be pre-processed to obtain a very dilute liquid stream (that can be spray irrigated) and a solid product, having 25-30% solids, that could be processed by gasification to produce a salable ash. The values for byproducts, energy and nutrients from manure, need to be large enough to support a manure treatment system. Dairy farms need to consider the impact of a manure treatment technology on the whole farm system.
Prices to obtain a zero economic benefit (net benefits minus costs equal $0) for the expanded 2,500-cow dairy in central NY for each variable alone.
Variable
Break-Even Price
Comments
Capital costs ($/Unit)
$0 Wet Gasification
$0 for SLS
$1,750/kW for steam gen set
Assuming grants are available
Assuming a separator already exists
Steam gen-set is $1,750/kW
Electric Price ($/kWh)
$0.156/kWh
5M kWh/yr. produced
Includes $0.03/kWh maintenance cost on engine generators. (This is renewable energy but only ~50% reduction in GHG
Hauling cost ($/load)
$2,530/load
159 loads/yr. reduced
8,400 gallons/load (approximately a 420-mile round trip)
Ash Sales ($/ton)
$374/ton
898 tons/yr. produced
This price includes the reduced hauling costs as the water separated from the ash can be spray irrigated without hauling.
Future Plans
We continue to evaluate manure treatment systems that have the potential to reduce the mass of the manure to be spread, produce energy, partition the nutrients, reduce greenhouse gas emissions, and a produce a potential by-product for off-farm sales and extending this knowledge to dairy operators.
Corresponding author, title, and affiliation
Peter Wright, Agricultural Engineer, Dept. of Animal Science, Cornell University
Pew2@cornell.edu
Other authors
Curt Gooch, Senior Extension Associate at Cornell University, Dept. of Animal Science, PRO-DAIRY
Additional information
Additional project information can be found on the dairy environmental system webpage: www.manuremanagement.cornell.edu.
Acknowledgements
The farm and the wet gasification technology company provided the needed data to make the economic analysis. Funding for this project was supported by Cornell’s Jumpstart program.
The authors are solely responsible for the content of these proceedings. The technical information does not necessarily reflect the official position of the sponsoring agencies or institutions represented by planning committee members, and inclusion and distribution herein does not constitute an endorsement of views expressed by the same. Printed materials included herein are not refereed publications. Citations should appear as follows. EXAMPLE: Authors. 2019. Title of presentation. Waste to Worth. Minneapolis, MN. April 22-26, 2019. URL of this page. Accessed on: today’s date.
This study has the objectives of characterizing dairy manure pre and post solid-liquid separation (SLS), estimating and comparing processing efficiencies between different technologies, and relating emissions to manure characteristics by using modeling tools.
What did we do?
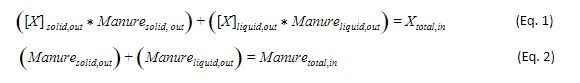
Manure samples from nine dairy farms in southern and eastern Wisconsin were collected every two weeks. All nine farms separated manure into liquid and solid streams and seven farms used anaerobic digesters (ADs) prior to solids separation (Table 1). For all farms, manure was sampled pre-processing (untreated manure) and after any individual processing step in order to isolate the performance of each treatment unit at each farm (Figure 1). All manure samples were analyzed for total solids (TS), volatile solids (VS), total nitrogen (TN), ammonia (NH3), total phosphorus (TP), total potassium (TK) and chemical oxygen demand (COD). Separation efficiency was estimated by solving a system of two equations of separation mass balance (Equations 1 and 2) based on the concentrations of each constituent.
Where:
X (kg) is the constituent under evaluation (e.g. TS, NH3, etc.)
[ ] indicates percent concentration in the solid (solid, out), liquid (liquid, out) fractions after separation, and total before separation (total, in)
Manure (kg) is the manure mass in the solid (solid, out), liquid (liquid, out) fractions after separation, and total before separation (total, in)
What have we learned?
Both screw press and centrifuge technologies achieve higher separation efficiencies for TS and VS than for TN, NH3, TP, and TK, meaning that more TS and VS stay with the solids fraction. Moreover, NH3stays almost entirely in the liquid fraction. Results indicate that centrifugation might achieve higher TP separation efficiencies than screw pressing. Greenhouse gas (GHG) emissions, were affected by the management practices used to handle the liquid and solid fractions. Methane emissions from liquid storage are reduced as a percentage of the VS stays with the solids fraction. However, nitrous oxide emissions from the separated solids might increase if separated solids are stored and not quickly land applied or transported outside of the farm for posterior use.
Future Plans
Analysis for anaerobic digestion efficiency and pathogen inactivation will be incorporated in this study to conduct a complete assessment of manure characteristics after AD and SLS and their impact on different environmental indicators.
Table 1. Summary of each farm’s manure management process.
Farm ID
AD
SLS
Feedstock
1
Mixed plug flow
Screw press
Dairy manure
2
No
ABRU
Dairy manure
3
Complete Mix
Screw press with blower
Dairy manure
4
Mixed plug flow
Screw press
Dairy manure
5
Mixed plug flow
Screw press
Paunch manure, food waste
6
Mixed plug flow
Screw press
Dairy manure
7
Mixed plug flow
Screw press
Dairy manure
8
Complete Mix
Centrifuge
Dairy manure, ethanol byproduct, FOG
9
No
ABRU
Dairy manure
AD: anaerobic digestion, SLS: solid-liquid separation, ABRU: aerobic bedding recovery unit , FOG: fat, oil, and grease
Figure 1. Scheme of the manure processing technologies and sampling locations.
Authors
Aguirre-Villegas Horacio Andres. Assistant Scientist. Department of Biological Systems Engineering, University of Wisconsin-Madison. aguirreville@wisc.edu
Sharara Mahmoud. Assistant Professor. Department of Biological and Agricultural Engineering. NC State University
Larson Rebecca. Associate Professor. Department of Biological Systems Engineering, University of Wisconsin-Madison
The authors are solely responsible for the content of these proceedings. The technical information does not necessarily reflect the official position of the sponsoring agencies or institutions represented by planning committee members, and inclusion and distribution herein does not constitute an endorsement of views expressed by the same. Printed materials included herein are not refereed publications. Citations should appear as follows. EXAMPLE: Authors. 2019. Title of presentation. Waste to Worth. Minneapolis, MN. April 22-26, 2019. URL of this page. Accessed on: today’s date.
The purpose of this project was to demonstrate the effects of adding natural clinoptilolite zeolites to a dairy manure compost mix at the moment of initiating the composting process on characteristics of the final compost and nitrogen (N) retention. On-farm composting of manure is one Best Management Practice (BMP) available to dairy producers. Composting reduces the volume of composted wastes by 20 to 60% and weight by 30 to 60%, which allows the final product to be significantly more affordable to transport than raw wastes. When done properly, composting can convert a considerable fraction of the N present in the raw manure into a more stable form, which is released slowly over a period of years and thereby not partially lost to the environment (Rynk et al., 1992; Magdoff and Van Es, 2009). During the manure handling and composting process, between 50 and 70% of the N can be lost as ammonia (NH3) if additional techniques are not used to increase nitrogen retention. Most of the time, manures from dairies and other livestock operations don’t have the proper carbon to nitrogen ratio (C:N) to be composted efficiently without added carbon. A balanced mix for composting should be between C:N of 30:1 to 40:1 (Rynk et al., 1992; Fabian et al., 1993). Since manures are richer in nitrogen (C:N ratios below 15:1), and bedding doesn’t add enough carbon during most of the year, a great proportion of the available N is lost as NH3 due to the lack of carbon to balance the composting process, resulting in a lower grade compost that can generate local and regional pollution due to NH3 emissions. In many arid zones there are not enough sources of carbon to balance the nitrogen present in the manure. Due to this lack of adequate carbonaceous material, additional methods to reduce the loss of N as NH3 during the composting process are needed. Several amendments have been evaluated in the past to achieve this reduction in N loss (Ndegwa et al., 2008). Zeolites are minerals defined as crystalline, hydrated aluminosilicates of alkali and alkaline earth cations having an infinite, open, three-dimensional structure. Clinoptilolite zeolite is mined in several western states including Idaho, where mining is near the dairy production areas.
This paper showcases an on-farm project that explored the effects of adding clinoptilolite to dairy manure at the time of composting as a tool to reduce NH3 emissions, retain N in the final composted product, and evaluate its effect on the final product.
What did we do?
This on-farm research was conducted at an open-lot dairy in Southern Idaho with 100 milking Jersey cows. Manure stockpiled during the winter and piled after the corral’s cleaning was mixed with fresh pushed-up manure from daily operations and straw from bedding and old straw bales, in similar proportions for each windrow. The compost mixture was calculated using a compost spreadsheet calculator (WSU-Puyallup Compost Mixture Calculator, version 1.1. Puyallup, WA). Moisture was adjusted by adding well water to reach approximately 50% to 60% moisture on the initial mix. Windrows were mixed and mechanically turned using a tractor bucket. Three replications were made for control and treatment. The control (CTR) consisted of the manure and straw mix as described. The treatment (TRT) consisted of the same mix as the control, plus the addition of 8% w/w (15%DM) of clinoptilolite zeolite during the initial mix. Windrows were actively composted for 149 days on average. Ammonia emissions were measured using passive samplers (Ogawa & Co. Kobe, Japan) and results were described in a previous Waste to Worth proceeding paper (de Haro Martí, et al. 2017). Complete initial manure (compost feedstock mix) and final screened compost nutrient lab analyses were performed for each windrow. Compost maturity tests were performed using the SOLVITA® test (Woods End Laboratories, Mt Vernon, ME). Statistical analyses were conducted using SAS 9.4 (SAS Institute, Cary, NC). Analyses included ANOVA (PROC MIXED) and paired t-test when applicable.
What have we learned?
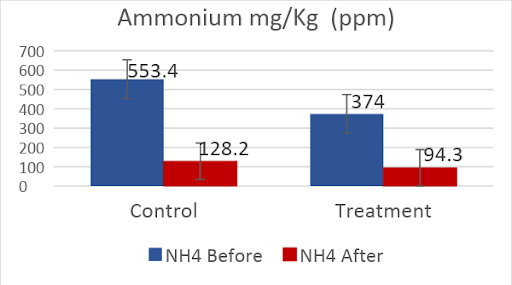
The initial mix lab analysis revealed no significant differences in all parameters between control and treatment, except for ammonium (NH4+) where a tendency was observed. Many of the most stable parameters were very close to one another numerically, indicating a good management of the on-farm feedstock formulation and mixing. Ammonium at 553.4±100 mg/kg for CTR and 256.77±100 mg/kg for TRT showed a tendency (0.05<p≤0.1, Figure 1).
Figure 1. Ammonium ppm before and after composting
This difference from the beginning of the process indicates that clinoptilolite has an immediate impact on NH4+ when added to the compost mix, changing the NH4+ and NH3 behavior and volatilization even during the construction of the windrow.
Nitrate (NO3) concentration in the TRT compost, 702±127 mg/kg was three times higher than the CTR, 223±127 (p= 0.05, Figure 2).
Figure 2. Nitrate ppm before and after composting
The presence of such high amount of NO3 compared to the control indicates a strong prevalence of nitrification processes (Sikora and Szmidt, 2001; Weil and Brady, 2017). Elevated NO3 concentrations are desirable in high quality compost used in plant nurseries, green houses, and horticulture, and are usually obtained from feedstock with much higher carbon content than the one used in this research. The NO3 to NH4+ ratio (NO3:NH4) in the treated windrows is also indicative of a much more stable compost than what is to be expected in a dairy compost with such low initial C:N (Sikora and Szmidt, 2001). High NO3 concentrations in compost could, however, generate a concern for NO3 leaching if the compost is not managed properly during storage and at the time of application (Miner et al., 2000; Weil and Brady, 2017). Total nitrogen (TN) on the compost was 14,933±1,379 mg/Kg (1.5%) for CTR and 11,300±1,379 mg/Kg (1.1%) for TRT (p=0.13), showing no significant difference.
Table 1. Solvita® test results on finished compost
Sample
TRT or CTR
CO2
Index
NH3
Index
Maturity Index
Compost Condition
O2 depletion
Phytotoxicity
Noxious hazard
pH
NH4+ Estimate (ppm)
N-Loss potential
W 1
CTR
6.5
3.5
5.5
Curing
1.60%
Medium/ Slight
Moderate /Slight
9.1
500
Moderate/Low
W 2
CTR
6.5
2
4.5
Active
2.50%
High
Severe
9.3
1500
M/ High
W 5
CTR
6.5
2
4.5
Active
2.50%
High
Severe
9.8
1500
M/ High
W 3
TRT
7
5
7
Finished
0.70%
None
None
9.5
<200
V Low-None
W 4
TRT
7
5
7
Finished
0.70%
None
None
8.9
<200
V Low-None
W 6
TRT
6
5
6
Curing
1.20%
None
None
9.3
<200
V Low-None
The Solvita® test results from the screened composts (Table 1) show a significant difference (p=0.007) in the NH3 test results between CTR, index 2.5±0.35 and TRT, index 5.0±0.35. Carbon Dioxide (CO2) test results showed no significant differences between CTR and TRT. All other calculated parameters showed a significant difference between control and treatment. Maturity index was 4.8±0.33 for CTR and 6.7±0.33 for TRT (p<0.02). Oxygen depletion was 0.022±0.002 for CTR and 0.009±0.002 for TRT (p<0.02). NH4+ estimate was 1167 for CTR and <200 for TRT (p=0.05). Other estimated test parameters indicate a significant difference between CTR and TRT results. Control windrows showed more unstable conditions, reaching the active or curing status, medium to high phytotoxicity, moderate to severe noxious hazard, and moderate to low N-loss potential. In contrast, treatment windrows showed more stable conditions, including reaching finished and curing status, no phytotoxicity or noxious hazard, and very low to no N-loss potential.
These results, coupled with the NO3:NH4 ratio and much higher NO3 values in the zeolite amended compost, indicate that the addition of clinoptilolite zeolite to a dairy manure compost mix in this study induced nitrification processes, produced NH4+ retention, NH3 emissions reduction, and lower oxygen depletion without significantly modifying the CO2 production. It also led to compost maturity characteristics that are regularly achieved only in compost mixes with much higher carbon content and C:N ratios, usually associated with high quality composts. No negative effects were observed in the composting process or final product.
Future Plans
A greenhouse trial on silage corn comparing treatment and control compost effects followed. Results need to be analyzed and published.
Authors
Mario E. de Haro-Martí. Extension Educator. University of Idaho Extension, Gooding County, Gooding, Idaho. mdeharo@uidaho.edu
Mireille Chahine. Extension Dairy Specialist. University of Idaho Extension, Twin Falls R&E Center, Twin Falls, Idaho.
Additional information
References:
de Haro-Martí, M.E., H. Neibling, M. Chahine, and L. Chen. 2017. Composting of dairy manure with the addition of zeolites to reduce ammonia emissions. Waste to Worth, Advancing Sustainability in Animal Agriculture conference. Raleigh, North Carolina.
Fabian, E. E., T. L. Richard, D. Kay, D. Allee, and J. Regenstein. 1993. Agricultural composting: a feasibility study for New York farms. Available at: http://compost.css.cornell.edu/feas.study.html. Accessed 04/28/2011.
Lorimor, J., W. Powers, A. Sutton. 2000. Manure Characteristics. Manure Management System Series. Midwest Plan Service. MPWS-18 Section 1. Iowa State University.
Magdoff, F., & Van Es, H. (2009). Building soils for better crops – Sustainable soil management (3rd ed.). Brentwood, MD, USA: Sustainable Agriculture Research and Education program.
Miner, J. R., Humenik, F. J., & Overcash, M. R. 2000. Managin livestock wastes to preserve environmental quality (First ed.). Ames, Iowa, USA: Iowa State University Press.
Mumpton, F.A. 1999. La roca magica: Uses of Natural Zeolites in Agriculture and Industry. Proceedings of the National Academy of Sciences of the United States of America, Vol. 96, No. 7 (Mar. 30, 1999), pp. 3463-3470
Ndegwa, P. M., Hristov, A. N., Arogo, J., & Sheffield, R. E. 2008. A review of ammonia emission mitigation techniques for concentrated animal feeding operations. Biosystems Eng. (100), 453-469.
Rink, R., M. van de Kamp, G.B. Willson, M.E. Singley, T.L. Richard, J.J. Kolega, F.R. Gouin, L.L. Laliberty Jr., D.K. Dennis. W.M. Harry, A.J. Hoitink, W.F.Brinton. 1992. On-Farm Composting Handbook. NRAES-54. Natural Resource, Agriculture, and Engineering Service. Cooperative Extension. Ithaca, New York.
Sikora, L. J., & Szmidt, R. A. 2001. Nitrogen sources, mineralization rates, and nitrogen nutrition benefits to plants from composts. In P. J. Stofella, & B. A. Kahn (Eds.), Compost utilization in horticultural cropping systems (pp. 287-306). Boca Raton, Florida, USA: CRC Press LLC.
Weil, R. R., & Brady, N. C. 2017. The nature and properties of soils (Fifteenth. Global Edition ed.). Harlow, Essex, England: Pearson Education Limited.
Acknowledgements
This project was made possible through a USDA- ID NRCS Conservation Innovation Grants (CIG) # 68-0211-11-047. The authors also want to thank the involved dairy farmer and colleagues that helped during this Extension and research project. Thanks to USDA-ARS Kimberly, ID for the loan and sample analysis of the Ogawa passive samplers.
The authors are solely responsible for the content of these proceedings. The technical information does not necessarily reflect the official position of the sponsoring agencies or institutions represented by planning committee members, and inclusion and distribution herein does not constitute an endorsement of views expressed by the same. Printed materials included herein are not refereed publications. Citations should appear as follows. EXAMPLE: Authors. 2019. Title of presentation. Waste to Worth. Minneapolis, MN. April 22-26, 2019. URL of this page. Accessed on: today’s date.
Ionophores are a type of antibiotics that are used in cattle production to shift ruminal fermentation patterns. They do not kill bacteria, but inhibit their ability to function and reproduce. In the cattle rumen, acetate, propionate, and butyrate are the primary volatile fatty acids produced. It is more energetically efficient for the rumen bacteria to produce acetate and use methane as a hydrogen sink rather than propionate. Ionophores inhibit archaea forcing bacteria to produce propionate and butyrate as hydrogen sinks rather than working symbiotically with methanogens to produce methane as a hydrogen sink. Numerous research studies have demonstrated performance advantages when ionophores are fed to beef cattle, but few have considered potential environmental benefits of feeding ionophores. This study was conducted to determine if concentrations of greenhouse gases, odorous volatile organic compounds (VOC), ammonia, and hydrogen sulfide from beef cattle manure could be reduced when an ionophore was fed to finishing cattle.
What Did We Do?
Four pens of feedlot cattle were fed an ionophore (monensin) and four pens received no ionophore (n=30 animals/pen). Samples were collected six times over a two-month period. A minimum of 20 fresh fecal pads were collected from each feedlot pen at each collection. Samples were mixed within pen and a sub-sample was placed in a small wind-tunnel. Duplicate samples for each pen were analyzed. Ammonia, carbon dioxide (CO2), and nitrous oxide (N2O) concentrations were measured using an Innova 1412 Photoacoustic Gas Analyzer. Hydrogen sulfide (H2S) and methane (CH4) were measured using a Thermo Fisher Scientific 450i and 55i, respectively.
What Have We Learned?
Table 1. Overall average concentration of compounds from feces of beef feedlot cattle fed diets with and without monensin.
Total CH4 concentration decreased when monensin was fed. Of the VOCs measured, only total sulfide concentration was lower for the manure from cattle fed monensin compared to those not fed monensin. Ammonia, N2O, CO2, H2S, and all other odorous VOC were similar between the cattle fed monensin and those not fed monensin. The results only account for concentration of gases emitted from the manure and do not take into account any urinary contributions, but indicate little reduction in odors and greenhouse gases when monensin was fed to beef finishing cattle.
Future Plans
A study is planned for April – July 2019 to measure odor and gas emissions from manure (urine and feces mixture) from cattle fed with and without monensin. Measurements will also be collected from the feedlot surface of pens with cattle fed with and without monensin.
Authors
Mindy J. Spiehs, Research Animal Scientist, USDA ARS Meat Animal Research Center, Clay Center, NE
Bryan L. Woodbury, Agricultural Engineer, USDA ARS Meat Animal Research Center, Clay Center, NE
Kristin E. Hales, Research Animal Scientist, USDA ARS Meat Animal Research Center, Clay Center, NE
Additional Information
Dr. Hales also looked at growth performance and E. coli shedding when ionophores were fed to finishing beef cattle. This work is published in Journal of Animal Science.
Hales, K.E., Wells, J., Berry, E.D., Kalchayanand, N., Bono, J.L., Kim, M.S. 2017. The effects of monensin in diets fed to finishing beef steers and heifers on growth performance and fecal shedding of Escherichia coli O157:H7. Journal of Animal Science. 95(8):3738-3744. https://pubmed.ncbi.nlm.nih.gov/28805884/.
USDA is an equal opportunity provider and employer.
Acknowledgements
The authors wish to thank Alan Kruger, Todd Boman, and the USMARC Cattle Operations Crew for assistance with data collection.
The authors are solely responsible for the content of these proceedings. The technical information does not necessarily reflect the official position of the sponsoring agencies or institutions represented by planning committee members, and inclusion and distribution herein does not constitute an endorsement of views expressed by the same. Printed materials included herein are not refereed publications. Citations should appear as follows. EXAMPLE: Authors. 2019. Title of presentation. Waste to Worth. Minneapolis, MN. April 22-26, 2019. URL of this page. Accessed on: today’s date.
Over the last 15 years it has become common to build new poultry production facilities on a piece of property that will provide the necessary land area for all of the barns and support facilities, and that comply with the setbacks (i.e. surface water, nearest neighbors) required by local, state, and federal regulations. The manure management plan in such cases depended on the transport of poultry manure to remote cropland that was often not owned and managed by the poultry producer. In some states, the law held the poultry producer legally responsible for any possible environmental consequences associated with irresponsible spreading or handling. Such laws tended to limit transport distances due to the lack of liability transfer. In other states, like South Carolina, poultry manure brokers were required to have a state permit that allowed for the transfer of liability from the producer to the broker by means of a contract. The broker became liable for proper application rates, adherence to setback requirements, application at agronomic rates, and other state requirements. While transfer of liability did encourage the movement of manure from nearby fields with high soil-test phosphorous contents to remote fields that could benefit from all plant nutrients in manure it also gave rise to an increase in the number or farms that were permitted with manure brokerage as the only manure nutrient management alternative.
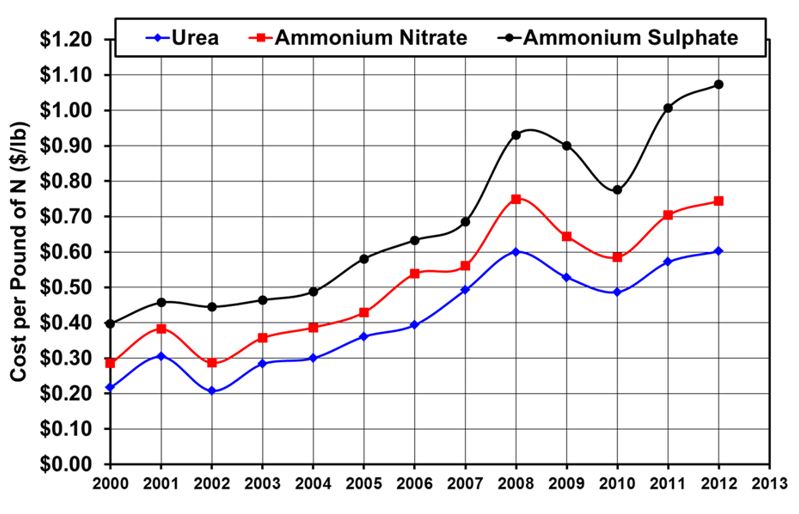
During the period from 2002 to 2008 when many new poultry farms were being built the average prices of N, P2O5, and K2O were increasing due to surges in fuel prices. Nitrogen prices increased in a linear manner from 29 to 75 cents per pound or a 2.6 fold increase in price (Table 1 and Figure 1). Prices of the other major nutrients, P2O5 and K2O, increased by over a factor of 3 for the same six year period (Figure 2). Such increases in the cost of fertilizers greatly increased demand for poultry manure, and further encouraged poultry producers to build barns that depended on brokerage as the only manure management option without any considerations of potential decreases in manure value. In recent years, fertilizer prices have decreased and brokerage of manure is not as attractive. The objective of this study was to determine the impact of fertilizer price fluctuations on the value of broiler litter, high-rise layer manure, turkey grow-out litter, and turkey brooder litter.
Table 1. Fertilizer composition information and equation used to convert price per ton to price per pound.
Fertilizer Description
Nutrient Content Per Ton of Fertilizer
Urea – 46% N by weight
920 lb N/ton
Ammonium Nitrate – 34% N by weight
680 lb N/ton
Ammonium Sulfate – 21% N and 24% by weight
420 lb N/ton
Conc. Super-Phosphate – 46% P2O5 by weight
920 lb P2O5 /ton
Potassium Chloride – 60% K2O by weight
1200 K2O / ton
Equation Used to Convert Fertilizer Price to Price per Pound of Nutrient
$ / lb Nutrient = $ / Ton of Fertilizer÷ lb Nutrient / Ton
Figure 1. Variation in nitrogen prices based on national averages from 2000 to 2012 (USDA-ERS, 2013).
Figure 2. Variation in P2O5 and K2O prices based on national averages from 2000 to 2012 (USDA-ERS, 2013).
What did we do?
Fertilizer Nutrient Content of Poultry Manure
The type of poultry raised in a building and the amount of bedding used causes a wide variation in the plant nutrient content of the manure removed from the building. The manure composition used in the study was taken from data obtained in South Carolina and is shown in Table 2. Broiler litter and turkey grow-out litter were the most similar since pine shavings were used as bedding and several flocks of birds were grown-out on the litter prior to building clean-out. Clean-out frequency varies greatly from every 1 to 1.5 years. The data shown in Table 2 corresponded to annual litter clean-out. The moisture contents (MC) of these two litters were also similar (24% for the broiler litter and 26% for the turkey grow-out litter). Turkey production begins on a brooder farm where chicks are placed, brooded, and the poults are transported to a grow-out farm. These farms are unique in that the litter was completely changed after each flock. The result is that litter from a brooder farm is much drier (14% moisture content) and contains less manure than any other type of poultry manure. The lower manure content also resulted in lower plant nutrient content. Manure from a high-rise layer barn was at the other extreme. Since no bedding was added to the manure the moisture content was much higher (47%). The high moisture content resulted in lower plant available nitrogen (PAN) content as compared to broiler litter, as well as lower phosphorus content (expressed as P2O5) and potassium (expressed as K2O).
Table 2. Poultry manure composition (lb / ton) used in the analysis (Chastain et al, 2001).
Nutrient
Broiler Litter(MC = 24%)
Layer Manure(MC = 47%)
Turkey Grow-out Litter (MC = 26%)
Turkey Brooder Litter (MC = 14%)
Ammonium-N
10
12
12
2.6
Nitrate-N
3.6
None detected
0.4
0.6
Org-N
43.8
22
42
37.2
Total-N
57.4
34
54
40.4
PAN – inc *
38
23
35
25
P2O5
66
51
64
29
K2O
57
26
37
20
* PAN – inc. = Incorporated plant available N = 0.60 x Org-N + 0.80 x Ammonium-N + Nitrate-N
Data for all three forms of nitrogen are provided in Table 2. However, not all of the nitrogen in manure is available for use by a crop. For this study, it was assumed that poultry manure was incorporated on the same day that it was applied by disking. As a result, 80% of the ammonium-N was counted as plant available. The amount of organic-N (Org-N) mineralized was assumed to be 60% based on common recommendations in South Carolina, however mineralization rates vary based on soil temperature, pH, and moisture. All the small amounts of nitrate contained in the manure was counted as available. The equation used for PAN estimates is provided with the table. Additional information concerning the estimate of plant available-N is provided by Chastain et al (2001).
The three plant nutrients used in our analysis are shown in bold colors in Table 2 for each type of poultry manure. They were the PAN, which is the best estimate of the nitrogen in manure that can be substituted for fertilizer-N, P2O5, and K2O.
Fertilizer Component Prices Used
The price of a pound of fertilizer nitrogen depends of the source. The price data shown previously in Figure 1 shows clearly that the most expensive source of nitrogen was ammonium sulfate, followed by ammonium-nitrate and urea. Ammonium-sulfate, the most expensive source of N, has few advantages unless soil-test results indicate that addition of large amounts of sulfur is needed. Ammonium-nitrate is one of the most common types of nitrogen used to manufacture complete fertilizers. It has the advantage of being water soluble, and is not as readily lost to the air as ammonia as compared to urea. Urea has the advantages of being more water soluble than ammonium-nitrate, and contains 35% more N per ton than ammonium-nitrate. The primary disadvantage of urea is that a significant amount (20% to 40%) can be lost to the air by ammonia volatilization unless it is incorporated in the soil to a depth of at least one inch. So the basic question to decide is: which N-price should be used to define the value of the plant available-N in poultry manure? The price of urea was selected because urea and poultry manure behave similarly with regards to ammonia volatilization losses.
The prices of N, P2O5, and K2O were shown to fluctuate widely from 2000 to 2012 (see Figures 1 and 2). The largest cause of these price fluctuations was the price of energy (i.e. oil) needed to manufacture and transport fertilizers. As a result, the prices of these three major plant nutrients were not allowed to vary independently in the analysis. That is, prices of all three nutrients had to be selected by year because of the dependence of all three on energy prices.
It was not a study objective to try to predict future prices since that would be possible, nor was it to perform calculations for each year. To do so would provide many numbers, but would obscure the basic points to be learned. Instead, the approach used was to select nutrient prices by year and use the years that encompassed the linear increase that began in 2004 as well as major peaks and valleys seen in the price of nitrogen in 2008, 2010, and 2012. Prices were also obtained from market reports to obtain prices for the fourth quarter of 2016 (USDA-SC, 2016; DTN, 2016). The actual prices used by year for the analysis are given in Table 3.
Table 3. Component fertilizer prices used in the analysis (USDA-ERS, 2013). The prices shown for 2016 were average prices obtained from market publications from the fourth quarter (USDA-SC, 2016; DTN, 2016).
Year
$/lb N (Urea)
$/lb P2O5
$/lb K2O
2004
0.30
0.29
0.15
2008
0.60
0.87
0.47
2010
0.49
0.55
0.43
2012
0.60
0.72
0.54
2016
0.37
0.26
0.27
Value of Poultry Manure Used as a Complete Fertilizer – N,P, and K
The first step in the study was to calculate the value of a ton of poultry manure by multiplying the price of N, P2O5, and K2O for each year (Table 3) by the amount of these nutrients per ton of manure (Table 2). This assumes that all of the nutrients in the manure can be used to grow a marketable crop. This is only true if the soil is poor in fertility or the excess P can be used by other crops in the rotation without application of additional manure. Many brokerage contracts in South Carolina, are based on application of 2 tons of litter per acre prior to a primary crop, such as corn or cotton. Additional litter is not spread on the second crop which is often soybeans. The results for the first step are provided in Table 4.
Table 4. Variation in the value of various types of poultry manure ($/ton) based on variability in price of N, P2O5, and K2O. Prices assume that all of the nutrients in the manure can be used in a crop rotation.
Year
Broiler (MC = 24%)
Layer (MC = 47%)
Turkey Grow-out (MC = 26%)
Turkey Brooder (MC = 14%)
2004
39.09
25.59
34.61
18.91*
2008
107.01
70.39
94.07
49.63
2010
79.43
50.50
68.26
36.80
2012
101.10
64.56
87.06
46.68
2016
46.61
28.79
39.58
22.19*
* Denotes values too low to be part of a viable brokerage contract with typical brokerage prices being in the range of $20 to $25 per ton of manure.
The most important observations that can be made from the results given in Table 4 are given below.
The value of broiler and turkey grow-out litter followed similar fluctuations. The values ranged from about $35 to $39 per ton in 2004 to a maximums of $94 to $107 per ton in 2008. By the end of 2016 the value of turkey grow-out litter and broiler litter ranged from about $40 to $47 per ton. During the years with high fertilizer prices brokerage customers that were paying $40 to $50 to spread 2 tons of litter per acre were receiving much more fertilizer value than they were paying for.
Turkey brooder litter consistently had the lowest value per ton as compared to the others due to low nutrient content and the large amounts of bedding used. The value of a ton of this type of litter was too low in 2004 and 2016 to be viable for litter brokerage contracts. Even during years with high fertilizer prices (2008 and 2012) turkey brooder litter was rarely brokered since it was so dry. Such dry, low-density manure that was mostly pine shavings further reduced the amount of litter and fertilizer value that could be fit into a typical trailer.
Layer manure consistently had lower value per ton as compared to broiler and turkey grow-out litter. The lower value was due to the much higher moisture content which diluted the nutrient value of the manure. Layer litter was a viable brokerage option, but not for long haul distances.
Value of Poultry Manure Applied to Fields with Sufficient P2O5
A common situation is when soil-test results indicate that a field has sufficient P2O5 in the soil for not only the crop to be grown immediately, but also for the next crop in the rotation (soybeans for example). In such cases, the P2O5 in poultry manure has no value, and only the N and K2O in the manure can be used as a fertilizer substitute. The results for this situation are provided in Table 5.
Table 5. Variation in the value of various types of poultry manure ($/ton) based on N and K2O prices. It was assumed that soil-test indicate that no P2O5 was needed.
Year
Broiler (MC = 24%)
Layer (MC = 47%)
Turkey Grow-out (MC = 26%)
Turkey Brooder (MC = 14%)
2004
19.95*
10.80*
16.05*
10.50*
2008
49.59
26.02
38.39
24.40
2010
43.13
22.45*
33.06
20.85*
2012
53.58
27.84
40.98
25.80
2016
29.45
15.53*
22.94*
14.65*
* denotes values are two low to be part of a viable brokerage contract with typical brokerage prices being in the range of $20 to $25 per ton of manure.
The results indicated that when the N price was $0.30/lb and K2O averaged $0.15/lb in 2004 the value of poultry manure was too low to be moved at contact prices of $20 to $25 per ton. Also, at prices associated with 2008, 2010, and 2012 the value of broiler and turkey grow-out litter ranged from $33 to $54 per ton. Layer and turkey brooder litter were poor to marginal values for brokerage contacts when the P2O5 was not needed over the entire range of fertilizer prices.
Comparing the results for 2008 for broiler litter indicates that if P2O5 was not needed the value fell from $107.01/ton to $49.59/ton. That is, the value of the litter was reduced by 54%. The year with the next highest value, 2012, eliminating the need for P2O5 reduced the litter value by 47%. Large drops in litter value can also be observed for other types of poultry manure by comparing the values in Tables 4 and 5. These results indicate that the P2O5 contained in poultry manure is one of the largest sources of value.
Value of Poultry Manure as Only a Source of Nitrogen
The analysis was performed again to reflect the value of poultry manure if nitrogen is the only major nutrient needed based on soil-test results. The results given in Table 6 clearly show that nitrogen alone never provided enough value to support brokerage contracts.
Table 6. Variation in the value of various types of poultry manure ($/ton) when nitrogen is the only nutrient needed based on soil-test results.
Year
Broiler (MC = 24%)
Layer (MC = 47%)
Turkey Grow-out (MC = 26%)
Turkey Brooder (MC = 14%)
2004
11.40*
6.90*
10.50*
7.50*
2008
22.80*
13.80*
21.00*
15.00*
2010
18.62*
11.27*
17.15*
12.25*
2012
22.80*
13.80*
21.00*
15.00*
2016
14.06*
8.51*
12.95*
9.25*
* denotes values are two low to be part of a viable brokerage contract with typical brokerage prices being in the range of $20 to $25 per ton of manure.
Results for a Four-House Broiler Farm
The previous results demonstrated that high litter nutrient contents combined with strong fertilizer prices yielded litter values that were much greater than the amount paid to litter brokers. The results also demonstrated that P2O5 was one of the key contributors to litter value. The results of the analysis were applied to a four-house broiler farm to more clearly demonstrate the practical implications. Fertilizer prices from January 2019 in central South Carolina were also added to the analysis. The key assumptions and results are provided in Table 7.
Table 7. Application of analysis results to a 4-house broiler farm. Building size = 50 ft x 500 ft, litter production was assumed to be 580 tons/year (145 tons/house/yr) with a price of $10/ton paid to the broiler producer ($5800/year).
Year
N Price ($/lb)
P2O5 Price ($/lb)
K2O Price ($/lb)
Litter Value ($/ton)
Value of 580 tons of litter ($/Year)
Value from N (%)
Value from P2O5 (%)
Value From K2O (%)
Loss to Producer ($/Year)
2004
0.30
0.29
0.15
39.09
22,672
29
49
22
16,872*
2008
0.60
0.87
0.47
107.01
62,066
21
54
25
56,266
2010
0.49
0.55
0.43
79.43
46,069
23
46
31
40,269
2012
0.60
0.72
0.54
101.1
58,638
23
47
30
52,838
2016
0.37
0.26
0.27
46.61
27,034
30
37
33
21,234
2019**
0.38
0.54
0.31
67.75
39,295
21
53
26
33,495
* The price paid to a broiler producer in a brokerage contract ranges from 0 to $15/ton of litter. A value of $10 /ton of litter is common. The loss was calculated as: (litter value ($/ton) – $5800).
** Prices from central South Carolina obtained in January 2019.
The results indicate that the total value of litter on a four house farms that produces 580 tons of litter per year varied from $22,672 per year in 2004 to a maximum of $62,066 per year in 2008. Currently, the value in January 2019 was estimated to be $39,295/year. In every year, the P2O5 contained in the litter contributed the most to the litter value. This contrasts with the common assumption that the high P2O5 content in litter is a problem as compared to nitrogen. The results point out that the most value can be obtained from litter by giving phosphorous use the priority in manure management. Assuming that the broiler producer was consistently paid $10/ton of litter by the broker the annual litter income was only $5800 per year. If the producer had integrated broiler production with crop production using a rotation that would realize all the fertilizer value in the litter the total litter value would have served to improve profitability of the cropping enterprise. If the producer relied on brokerage as the sole manure management strategy then the annual loss to the producer ranged from $16,872 to $56,266 per year depending on fertilizer prices.
What these results also point to, but do not quantify, is the variation in risk. Producers who built farms using brokerage as the sole manure management plan during the years of high fertilizer prices gave away litter that was worth 3.9 to 10.7 times more than they were paid. They also have incurred a great risk since brokerage contracts typically last only one year, and crop producers who once were happy to purchase brokered litter are no longer consistent customers. Such producers are forced to quickly find other litter use alternatives often in areas where agricultural and forest land may not be close to the farm. Building broiler barns relying on annual brokerage contracts as the sole manure management option has been shown to be short sighted, and has a low probability of being economically or environmentally sustainable. Co-locating poultry production with some sort of profitable plant production enterprise that can use all of the fertilizer value in the litter is preferred. The next most viable alternative may be to use litter to produce high-quality compost for high volume, consistent markets.
What have we learned?
It was found that the value of poultry manure as a complete fertilizer (N,P,K) varied from $18.91 to $107.01 per ton depending of component prices (N, P, K), moisture content, and the amount of bedding used. If the receiving fields did not require phosphorous, based on soil test, the realized value ranged from $10.50 to $49.59 per ton. Finally, if soil-test indicate that N was the only major nutrient needed the value decreased to $7.50 to $22.80 per ton. During the same time frame, brokerage prices ranged from $20 to $50 per ton depending on haul distance and spreading service. However, most brokerage contracts were based on $20 to $25 per ton of manure. Several practical observations were made from the results:
Brokerage of litter may only be a viable alternative when the receiving cropland needs a complete fertilizer and when the N, P, and K contents of the manure are not diluted by water or bedding.
Manure brokerage is not economically sustainable if N is the only major nutrient needed by the receiving cropland.
Integrated farms that can use the manure produced by the poultry barns to fertilize their own cropland have the potential to reduce the legal and economic risk to the execution of a manure nutrient management plan.
Poultry farms that currently rely on litter brokerage as the only manure management plan are losing customers and need to look at other alternatives that provide a less risky and sustainable use for the mature produced.
Analysis of the impact of fluctuations in fertilizer price on litter produced from four broiler houses indicated that the full value of the litter ranged from $22,672 to $62,066 per year. The P2O5 contained in the litter accounted for the majority of the fertilizer value (37% to 54%). As a result, complete utilization of litter phosphorous in a crop rotation is the key to realizing the maximum value from litter.
Author
John P. Chastain, Ph.D., Professor and Extension Agricultural Engineer
Department of Agricultural Sciences, Agricultural Mechanization & Business Program, Clemson University, 245 McAdams Hall, Clemson, SC 29634-0312
jchstn@clemson.edu
Sources of Additional Information
Chastain, J.P., J.J. Camberato, and P. Skewes. (2001). Poultry Manure Production and Nutrient Content. Chapter 3B in Confined Animal Manure Managers Certification Program Manual: Poultry Version, Clemson University Extension, Clemson SC, pp 3b-1 to 3b-17. Available at: https://www.clemson.edu/extension/camm/manuals/poultry_toc.html
USDA-SC (2016). Dept of Ag Market News, South Carolina Crop Production Report Dec. 8.
Zublena, J.P., J.V. Baird, and J.P. Lilly. (1997). SoilFacts: Nutrient Content of Fertilizer and Organic Materials (AG-439-18).
Acknowledgements
This study was supported by the Clemson Extension Confined Animal Manure Managers Program.
The authors are solely responsible for the content of these proceedings. The technical information does not necessarily reflect the official position of the sponsoring agencies or institutions represented by planning committee members, and inclusion and distribution herein does not constitute an endorsement of views expressed by the same. Printed materials included herein are not refereed publications. Citations should appear as follows. EXAMPLE: Authors. 2019. Title of presentation. Waste to Worth. Minneapolis, MN. April 22-26, 2019. URL of this page. Accessed on: today’s date.
This presentation will provide an overview of Pennsylvania’s Commercial Manure Hauler and Broker Certification program and highlight results of the industry survey. Pennsylvania’s Manure Hauler and Broker Certification Program was mandated by state law in 2006. The unique program has five certification levels, each with unique education requirements (Table 1). In 2018, a survey was completed by 218 certified individuals at eleven Continuing Education Credit events.
Analysis of the survey revealed a significant positive relationship between certification level and score on knowledge questions. Company owners, managers and supervisors are required to attend more educational programs, and these individuals scored higher on knowledge questions than their employees. Those individuals surveyed worked on an average of 38.5 farms per year. Results of the survey indicated that the program empowers industry professionals with science-based knowledge. Thus, enabling wise field-level decisions across many farms, acres, and manure handling scenarios with positive implications on water quality.
The goals of the survey were to 1) gather descriptive information about certified individuals, 2) test certified individual on key program competencies, and 3) use test results as a tool for evaluation of educational impact and shortfalls to guide future programming. Furthermore, results can validate program effectiveness in discussions with local, state, and federal agencies. Such a body of facts is pertinent and timely as governmental agencies and agricultural interest groups work together to meet goals established for the Chesapeake Bay and beyond.
Program educators feel that survey results supported their thoughts that educational efforts and certification help the industry to continually improve responsible handling of manure nutrients in the state and affirm that these programs have real favorable impacts on water and air quality.
A peer-reviewed journal article is expected to be available later in 2019 that will include greater depth of information on the program and survey.
Table 1: Description of Certification Levels and Continuing Education Credit (CEC) requirements of Pennsylvania’s Commercial Manure Hauler and Broker Certification Program.
Certification Level
Brief Description
Certification Education Requirements
Continuing Education Credit (CEC) Requirements
Manure Hauler Level 1
Transport but not land-apply manure.
Completes verification form and understanding checklist.
None. Must complete checklist annually.
Manure Hauler Level 2
Transport and land-apply manure. Must be supervised.
Studies workbook and completes examination at county office.
6 CECs in 3-year period.
Manure Hauler Level 3
Owner or manager. Can supervise Hauler Level 2 ‘s.
Attends Act 49 Orientation certification class and completes examination.
9 CECs in 3-year period.
Manure Broker Level 1
Assumes ownership of manure and determines its end-use. Cannot write Nutrient Balance Sheet. Can supervise Hauler Level 2 ‘s.
Attends Act 49 Orientation certification class and completes examination.
9 CECs in 3-year period.
Manure Broker Level 2
Assumes ownership of manure and determines its end-use. Can write Nutrient Balance Sheet. Can supervise Hauler Level 2 ‘s. Can take additional course to write P-Index plans.
Attends Act 49 Orientation certification class and completes examination. Attends Nutrient Balance Sheet class and completes examination.
12 CECs in 3-year period, 3 or more of which must be specific to Nutrient Balance Sheets.
The authors are solely responsible for the content of these proceedings. The technical information does not necessarily reflect the official position of the sponsoring agencies or institutions represented by planning committee members, and inclusion and distribution herein does not constitute an endorsement of views expressed by the same. Printed materials included herein are not refereed publications. Citations should appear as follows. EXAMPLE: Authors. 2019. Title of presentation. Waste to Worth. Minneapolis, MN. April 22-26, 2019. URL of this page. Accessed on: today’s date.
The recent development of the Newtrient on-line catalog (www.newtrient.com/Catalog/Technology-Catalog; see accompanying conference proceedings about the catalog) revealed the need to establish a set of environmental and farm operational based critical indicators (CIs). The indicators are useful in identifying manure treatment technologies that primarily best address dairy farm environmental sustainability but include some social aspects.
What did we do?
The Newtrient Technical Advancement Team, comprised of academic and industry professionals in dairy manure management, developed and implemented a novel methodology that identifies technologies that best address dairy farm sustainability mainly from an environmental but also from a social perspective. A project-amended process used by the International Organization for Standardization (ISO) was used as the basis for methodology development; the methodology is known as the Newtrient Evaluation and Assessment of Technology (NEAT) process.
For this work, six specific CIs were selected based on key environmental challenges/opportunities facing the dairy industry; they are: nitrogen recovery, phosphorus recovery, liquid manure storage requirements, greenhouse gas reduction, odor reduction, and pathogen reduction. A literature search was performed to evaluate 20 manure treatment technology types under five technology categories (Table 1).
A scoring system relative to the baseline condition of long-term (anaerobic) manure storage was developed and applied to each technology type and an appropriate relative score for each CI was determined. The NEAT results are presented in an easy to understand dashboard called the NEAT Matrix (Figure 1).
What have we learned?
Use of the NEAT process across the 20 manure treatment technology types confirms that there is no single technology type that can address all the environmental and operational indicators. An integrated manure management system that is comprised of strategically selected technologies may be assembled to move each dairy farm toward sustainability.
Table 1. Technology categories and associated manure treatment technology types evaluated using the Newtrient Evaluation and Assessment of Technology (NEAT).
Technology Category
Evaluated Technology Types
Primary solid-liquid separation
Centrifuge
Rotary screen
Screw press
Slope screen
Secondary solid-liquid separation
Clean water membrane
Evaporative technologies
Ultrafiltration membrane
Physical and biochemical stabilization
Active solids drying
Composting
Drum composter bedding
Surface aeration
Nutrient recovery
Ammonia stripping
Chemical flocculation
Struvite crystallization
Nitrification/denitrification
Energy recovery
Anaerobic digestion
Gasification
Hydrothermal Carbonization
Pyrolysis
Torrefaction
Figure 1. Generic example of the Newtrient Evaluation and Assessment of Technology (NEAT) Matrix
Future Plans
Future research in this area will continue to focus on using NEAT to evaluate integrated manure management systems designed specifically to achieve farm goals/needs.
Corresponding author, title, and affiliation
Curt Gooch, Environmental Systems Engineer, PRO-DAIRY Dairy Environmental System Program, Dept. of Animal Science, Cornell University.
cag26@cornell.edu
Other authors
Mark Stoermann (Newtrient, LLC), Garth Boyd (Context), Dana Kirk (Michigan State University), Craig Frear (Regenis), and Frank Mitloehner (UC Davis).
Additional information
Additional project information, is available on the Newtrient website: www.newtrient.com
Acknowledgements
Newtrient, LCC and the paper authors thank the following supporters of Newtrient: Agri-Mark, Inc., Dairy Farmers of America, Inc., Dairy Management Inc., Foremost Farms USA, Land O’Lakes, Inc., Maryland Virginia Milk Producers Cooperative Association, Inc., Michigan Milk Producers, National Milk Producers Federation, Prairie Farms Dairy, Inc., Select Milk Producers, Inc., Southeast Milk, Inc., St. Albans Cooperative Creamery, Tillamook County Creamery Association, and United Dairymen of Arizona
The authors are solely responsible for the content of these proceedings. The technical information does not necessarily reflect the official position of the sponsoring agencies or institutions represented by planning committee members, and inclusion and distribution herein does not constitute an endorsement of views expressed by the same. Printed materials included herein are not refereed publications. Citations should appear as follows. EXAMPLE: Authors. 2019. Title of presentation. Waste to Worth. Minneapolis, MN. April 22-26, 2019. URL of this page. Accessed on: today’s date.
Manage Cookie Consent
To provide the best experiences, we use technologies like cookies to store and/or access device information. Consenting to these technologies will allow us to process data such as browsing behavior or unique IDs on this site. Not consenting or withdrawing consent, may adversely affect certain features and functions.
Functional
Always active
The technical storage or access is strictly necessary for the legitimate purpose of enabling the use of a specific service explicitly requested by the subscriber or user, or for the sole purpose of carrying out the transmission of a communication over an electronic communications network.
Preferences
The technical storage or access is necessary for the legitimate purpose of storing preferences that are not requested by the subscriber or user.
Statistics
The technical storage or access that is used exclusively for statistical purposes.The technical storage or access that is used exclusively for anonymous statistical purposes. Without a subpoena, voluntary compliance on the part of your Internet Service Provider, or additional records from a third party, information stored or retrieved for this purpose alone cannot usually be used to identify you.
Marketing
The technical storage or access is required to create user profiles to send advertising, or to track the user on a website or across several websites for similar marketing purposes.