
Greenhouse Gases and Ammonia Emissions from Application of Beef Manure and Urea in Corn

When manure is used as fertilizer on crop land, it has been shown to improve soil health and increase crop yields compared to commercial fertilizer. However, the nutrients in manure can be quite variable. Little is known about the potential emissions of ammonia and greenhouse gases (carbon dioxide, methane, and nitrous oxide) when manure is used as a nitrogen fertilizer. These emissions can lead to nutrient losses and environmental degradation. There is limited information on the influence of land application of solid beef manure on overall gaseous emissions. The ongoing integration of beef cattle manure and crop production, together with the impacts of management decisions needs to be understood to be sustainable at multiple levels. Furthermore, gaseous emissions and the mitigation from land-applied manure needs to be comparatively assessed with commercial fertilizer to fully understand management modifications on crop production. The purposes of this study were (i) to estimate daily and seasonal emission/uptake rates of CO2, CH4, N2O, and NH3 and soil inorganic N levels under different N sources in corn cropping system; (ii) to identify important soil and weather control variables for gaseous emissions; and (iii) to assess the effects of different N management strategies (manure vs. urea) on corn yield and grain quality.

What did we do?

A 2-yr field experiment was conducted during the 2016 and 2017 growing seasons at the North Dakota State University (NDSU) research farm in Fargo, ND. The soil was poorly drained Fargo-Ryan silty clay. The experimental design was randomized with four replications. The treatments used were: (i) no fertilizer (NF) control (ii) solid beef cattle manure (SM) applied at 34 and 20.2 Mg ha−1 in the preceding fall of Year 1 (15 Oct. 2015) and Year 2 (19 Oct. 2016), respectively; (iii) solid beef cattle manure with wheat straw bedding (BM) applied at 67.3 and 43 Mg ha−1 in the preceding fall of Year 1 and Year 2, respectively; and (iv) urea only (UO) (46–0-0) applied at 220 kg ha−1 in May of Year 1 (4 May 2016) and Year 2 (9 May 2017). In addition, 117 kg P ha−1 (Year 1) and 88 kg P ha−1 (Year 2) were applied to UO plots to meet the corn P demand. Phosphorus was supplied with triple superphosphate (0–45–0). For measuring N2O, CO2, and CH4 fluxes from the soil surface, headspace gas samples were collected using PVC static chambers. Ammonia volatilization losses from each plot were measured using a semi-static open chamber (trap). Emissions of GHGs and NH3 were calculated for (i) daily mean soil to atmosphere fluxes for Year 1 and Year 2 and (ii) cumulative growing season emission for Year 1 (May 2016–September 2016) and Year 2 (May 2017–September 2017).
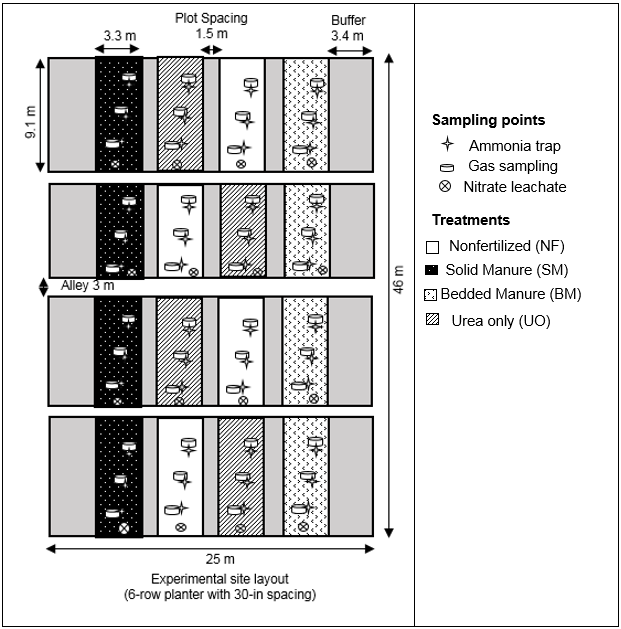
Figure: Experimental plots set up for measuring greenhouse gas fluxes using PVC static chambers from the soil surface in Fargo, North Dakota. (Photo credit: Suresh Niraula)

What have we learned?  

Manure applied to soil reduced cumulative nitrous oxide by 23% in SM and 31% in BM compared with the UO soil. Cumulative CO2 emission was 42% lower in UO than in SM or BM. Cumulative methane emission ranged from −0.04 (NF) to 0.21 (BM) kg CH4–C ha−1, with the highest emission from BM. Cumulative NH3 emission was 11% lower from  manure treatments than UO. The results highlight the challenges that come with variability in manure, soil, and weather as well as the potential for meeting crop N demand while reducing greenhouse gas emissions when using manure as an N source. With contrasting weather patterns during the Year 1 and Year 2 growing seasons, this study emphasized the importance of long-term study to fully understand the emission trend because an individual year may not fully account for variabilities in soil N indices. In addition, further research on biogeochemical processes in soil of fall-applied manure compared with spring-applied urea is needed to overcome the limitation of this study.

Future plans

We recommend the use of an automated chamber from gaseous emissions to continuously build on existing guidelines for the use of static chambers. More research is needed in several other types of agricultural management systems to investigate the loss of soil and manure N.

Authors

Dr. Suresh Niraula, Postdoctoral Associate, Department of Soil, Water, and Climate – University of Minnesota (Corresponding author email: sniraula@umn.edu)

Dr. Shafiqur Rahman, Associate Professor Agricultural and Biosystems Engineering (North Dakota State University)

Dr. Amitava Chatterjee, Associate Professor Soil Science (North Dakota State University)

Acknowledgements

This material is based on work that is supported by the National Institute of Food and Agriculture, USDA (grant 2015-67020-23453). Any opinions, findings, conclusions, or recommendations expressed in this publication are those of the author(s) and do not necessarily reflect the view of the USDA.

Additional information

Jantalia, C., A. Halvorson, R. Follett, B. Alves, J. Polidoro, and S. Urquiaga. 2012. Nitrogen source effects on ammonia volatilization as measured with semi-static chambers. Agron. J. 104(6): 1595–1603. doi:10.2134/agronj2012.0210.

Parkin, T.B., and R.T. Venterea. 2010. Chapter 3. Chamber-Based Trace Gas Flux Measurements. In Follett, R.F. (ed.), Sampling Protocols. p. 3–39.

The authors are solely responsible for the content of these proceedings. The technical information does not necessarily reflect the official position of the sponsoring agencies or institutions represented by planning committee members, and inclusion and distribution herein does not constitute an endorsement of views expressed by the same. Printed materials included herein are not refereed publications. Citations should appear as follows. EXAMPLE: Authors. 2019. Title of presentation. Waste to Worth. Minneapolis, MN. April 22-26, 2019. URL of this page. Accessed on: today’s date.
Sodium Bisulfate Treatment of Horse Stalls in the Southeastern United States

For the equine industry, concerns about ammonia (NH3) levels in the barn environment are multifaceted and include issues of animal welfare, animal and human health, and environmental impacts. In Florida, many performance horses are housed in stalls at least part of the day as are horses with allergic skin conditions and/or pasture associated asthma. The warm and humid climate produces favorable conditions for ammonia generation and fly emergence. Previous research has demonstrated the effectiveness of sodium bisulfate in lowering floor substrate and bedding pH, reducing ammonia concentrations, and fly populations in livestock facilities (poultry houses and dairies)1,2. However, research on application of sodium bisulfate in equine facilities is limited to two studies conducted in the northeastern United States3.

What did we do?

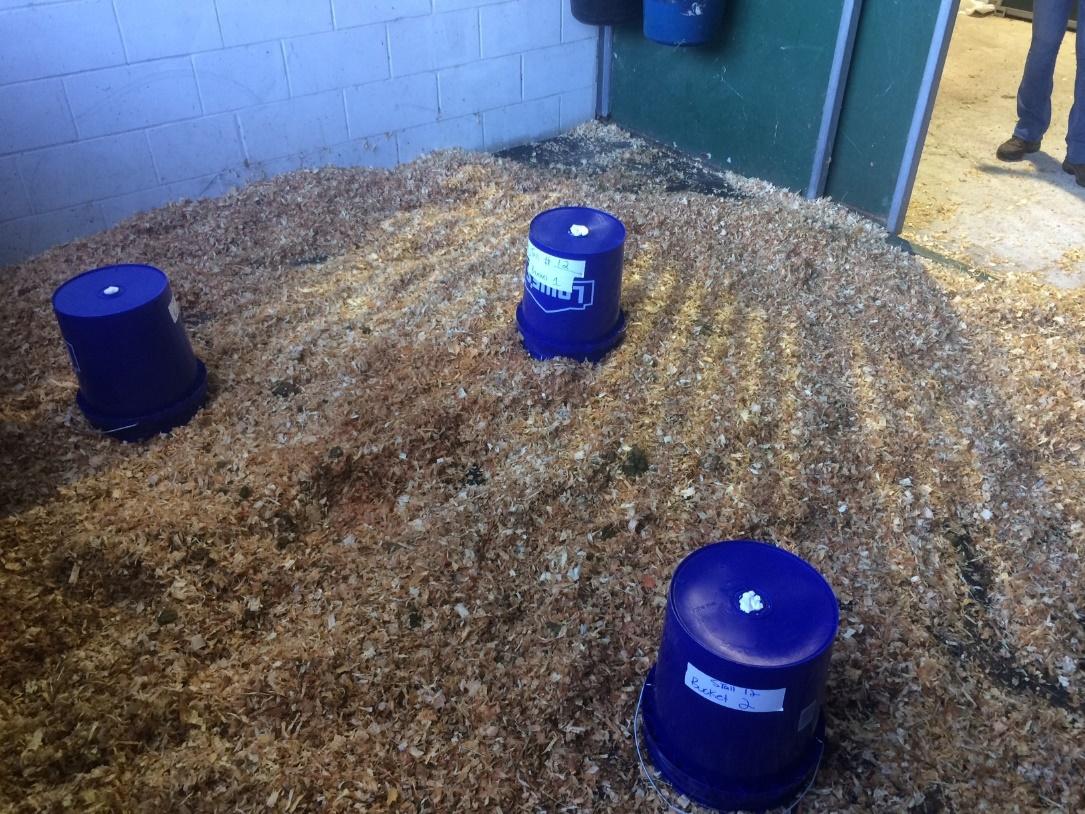
The objective of this pilot study was to determine the effects of sodium bisulfate (PLT®) application in a north central Florida equine facility on bedding pH, NH3 concentration, and fly counts. Four 12 x 12 ft stalls in a 20-stall barn were used, 2 control (CON) and 2 treated with sodium bisulfate (SB), individually housing mature geldings. Data were collected during the third week of August, 2018. Stalls were initially bedded with 67 lbs of wood shavings. Amount of product initially added to SB stalls was 14 lbs (manufacturer recommended application rate of 100 lbs/1,000 sqft) followed by 7 lbs daily for 4 days. Horses were housed in stalls overnight (12 hours/day) and stalls cleaned (manure and wet bedding removed) once/day. An aspirating pump and gas detection tubes (Kitagawa, Japan) were used to determine NH3 concentration before stall cleaning (AM measurement), to allow for manure and urine accumulation, and 10 hours post stall cleaning (PM measurement). Three 5-gallon buckets were placed over the stall surface in a triangular pattern to standardize airflow and the location of each bucket was marked to allow replication across AM and PM readings. OnSet HOBO loggers were used to monitor temperature and relative humidity. Fly traps containing no fly attractant, were suspended 8 feet above the floor in the center of each stall to determine fly counts.

What Have We Learned?

Background (cleaned stalls without bedding material; rubber mats only) and baseline (bedded stalls) NH3 concentrations were < 5 ppm and not different between SB and CON stalls. NH3 concentrations had a cumulative effect and were greater on day 3 (69.8 ppm) compared to day 1 (< 5 ppm) and day 2 (16.7 ppm). NH3 concentrations were greater in CON stalls (28.6 ppm) compared to SB stalls (< 5 ppm). Bedding pH was lower in SB stalls (1.82) compared to CON stalls (6.16) demonstrating an overall treatment effect, but pH of the bedding increased over the duration of the study. The number of flies caught in traps did not differ between treatments, although fly counts did increase over time. Reductions in pH and NH3 observed in the present study were comparable to previous studies. We expected reductions in flies in stalls treated with SB, however, fly counts were extremely low overall and a different approach for quantifying fly numbers may be necessary.

Future Plans

Future research directions include testing different application rates for equine stalls and determining efficacy of SB with different bedding types. Additional studies to investigate the effectiveness of SB in mitigating NH3 emissions in equine facilities4 and reducing fly populations and bacteria in stalls should be pursued. There is also potential to assess the benefits of SB application near manure storage areas on equine operations.

Corresponding author, title, affiliation and email

Carissa Wickens, Extension Equine Specialist, University of Florida.   cwickens@ufl.edu

Other authors: Jill Bobel, Biological Scientist, University of Florida; Danielle Collins, Graduate Student, University of Florida; Alex Basso, Graduate Student, University of Florida

Additional information:

1Johnson, T. M. and B. Murphy. 2008. Use of sodium bisulfate to reduce ammonia emissions from poultry and livestock housing. Proceedings of the Mitigating Air Emissions from Animal Feeding Operations Conference, Des Moines, IA. Iowa State University, pp. 74-78.

2Sun, H., Y. Pan, Y. Zhao, W. A. Jackson, L. M. Nuckles, I. L. Malkina, V. E. Arteaga and F. M. Mitloehner. 2008. Effects of sodium bisulfate on alcohol, amine, and ammonia emissions from dairy slurry. J. Environmental Quality 37:608-614. 

3Sweeney, C.R., S.M. McDonnell, G.E. Russell, and M. Terzich. 1997. Effect of sodium bisulfate on ammonia concentration, fly population, and manure pH in a horse barn. Am. J. Vet. Res. 57(12):1795-1798.

4Weir, J., H. Li, L.K. Warren, E. Macon, C. Wickens. 2017. Evaluating the impact of ammonia emissions from equine operations on the environment. Waste to Worth: Spreading Science and Solutions. Cary, NC. April 18-21, 2017. https://lpelc.org/evaluating-the-impact-of-ammonia-emissions-from-equine-operations-on-the-environment/. Accessed on: February 28, 2019.

Additional information regarding this project is available by contacting Carissa Wickens (cwickens@ufl.edu), or Jill Bobel (jbrides2@ufl.edu).

Acknowledgements:

The authors wish to thank Dr. Josh Payne, Technical Services Manager, Jones-Hamilton Company, Agricultural Division, and Dr. Hong Li, Associate Professor, Department of Animal and Food Sciences, University of Delaware for providing technical expertise and support for this project. We would also like to thank Carol Vasco, Tayler Hansen, Agustin Francisco, and Claudia Lopez for their assistance with data collection.

Figure 1: Placement of buckets over the stall floor for measurement of NH3 concentrations. The ammonia pump with attached gas detection tube was placed through a small hole drilled into the top of each bucket.
Figure 2: Average daytime and nighttime temperatures and percent relative humidity during the study period.

The authors are solely responsible for the content of these proceedings. The technical information does not necessarily reflect the official position of the sponsoring agencies or institutions represented by planning committee members, and inclusion and distribution herein does not constitute an endorsement of views expressed by the same. Printed materials included herein are not refereed publications. Citations should appear as follows. EXAMPLE: Authors. 2019. Title of presentation. Waste to Worth. Minneapolis, MN. April 22-26, 2019. URL of this page. Accessed on: today’s date.
The Use of USDA-NRCS Conservation Innovation Grants to Advance Air Quality Improvements

USDA-NRCS has nearly fifteen years of Conservation Innovation Grant project experience, and several of these projects have provided a means to learn more about various techniques for addressing air emissions from animal agriculture.  The overall goal of the Conservation Innovation Grant program is to provide an avenue for the on-farm demonstration of tools and technologies that have shown promise in a research setting and to further determine the parameters that may enable these promising tools and technologies to be implemented on-farm through USDA-NRCS conservation programs.

What Did We Do?

Several queries for both National Competition and State Competition projects in the USDA-NRCS Conservation Innovation Grant Project Search Tool (https://www.nrcs.usda.gov/wps/portal/nrcs/ciglanding/national/programs/financial/cig/cigsearch/) were conducted using the General Text Search feature for keywords such as “air”, “ammonia”, “animal”, “beef”, “carbon”, “dairy”, “digester”, “digestion”, “livestock”, “manure”, “poultry”, and “swine” in order to try and capture all of the animal air quality-related Conservation Innovation Grant projects.  This approach obviously identified many projects that might be related to one or more of the search words, but were not directly related to animal air quality. Further manual review of the identified projects was conducted to identify those that specifically had some association with animal air quality.

What Have We Learned?

Out of nearly 1,300 total Conservation Innovation Grant projects, just under 50 were identified as having a direct relevance to animal air quality in some way.  These projects represent a USDA-NRCS investment of just under $20 million. Because each project required at least a 50% match by the grantee, the USDA-NRCS Conservation Innovation Grant program has represented a total investment of approximately $40 million over the past 15 years in demonstrating tools and technologies for addressing air emissions from animal agriculture.

The technologies that have been attempted to be demonstrated in the animal air quality-related Conservation Innovation Grant projects have included various feed management strategies, approaches for reducing emissions from animal pens and housing, and an approach to mortality management.  However, the vast majority of animal air quality-related Conservation Innovation Grant projects have focused on air emissions from manure management – primarily looking at anaerobic digestion technologies – and land application of manure. Two projects also developed and enhanced an online tool for assessing livestock and poultry operations for opportunities to address various air emissions.

Future Plans

The 2018 Farm Bill re-authorized the Conservation Innovation Grant Program through 2023 at $25 million per year and allows for on-farm conservation innovation trials.  It is anticipated that additional air quality projects will be funded under the current Farm Bill authorization.

Authors

Greg Zwicke, Air Quality Engineer, USDA-NRCS National Air Quality and Atmospheric Change Technology Development Team

greg.zwicke@ftc.usda.gov

Additional Information

More information about the USDA-NRCS Conservation Innovation Grants program is available on the Conservation Innovation Grants website (https://www.nrcs.usda.gov/wps/portal/nrcs/main/national/programs/financial/cig/), including application information and materials, resources for grantees, success stories, and a project search tool.

The authors are solely responsible for the content of these proceedings. The technical information does not necessarily reflect the official position of the sponsoring agencies or institutions represented by planning committee members, and inclusion and distribution herein does not constitute an endorsement of views expressed by the same. Printed materials included herein are not refereed publications. Citations should appear as follows. EXAMPLE: Authors. 2019. Title of presentation. Waste to Worth. Minneapolis, MN. April 22-26, 2019. URL of this page. Accessed on: today’s date.
Comparison of Struvite to Mono-Ammonium-Phosphate as a Phosphorus Source on Commercial Alfalfa Fields

The purpose of this project was to demonstrate a regional nutrient (phosphorus (P)) recycling relationship between the dairy industry and alfalfa forage growers. Dairies often have excess P in manure in relation to the need for crop production on-farm. Easily mineable reserves of phosphorus (P) worldwide are limited, with a majority residing in Morocco (USGS 2013). One approach to recycling P is to capture excess P from dairy manure in the form of struvite for off-farm export for use as a nutrient source of crop production. Washington State produces a significant amount of alfalfa for domestic and international sales.

What did we do

Struvite (Magnesium Ammonium Phosphate – NH4MgPO4· 6H2O) and Mono Ammonium Phosphate (MAP) were applied to 33 and 30 acres (control and treatment, Farm 1); and 60 and 55 acres (control and treatment, Farm 2) sections of alfalfa fields at two commercial forage producers in Eastern Washington. Fertilizer (struvite or MAP) was applied on an equivalent P2O5 basis in August 2017 and September 2018 (Farm 1 – existing stand) and September 2017 and September 2018 (Farm 2 – new seeding).

What have we learned

Accumulative yield of alfalfa in 2018 for Farm 1 was struvite = 7.14 tons, MAP = 7.51 tons. Accumulative yield (2 of 3 cuttings) of alfalfa in 2018 for Farm 2 was struvite = 3.08 tons, MAP = 2.95 tons. Average P concentration of alfalfa in 2018 for Farm 1 was struvite = 0.27, MAP = 0.27 (% DM).  Average P concentration in alfalfa in 2017 for Farm 1 was struvite = 0.31, MAP = 0.32 (% DM). Average P concentration of alfalfa in 2018 for Farm 2 for struvite and MAP was 0.27 and 0.28 % DM, respectively. Average accumulative P uptake of alfalfa in 2018 for Farm 1 was 38 and 39 lbs P/acre for struvite and MAP, respectively. Average accumulative P uptake (2 of 3 cuttings) of alfalfa in 2018 for Farm 2 was struvite = 15 lbs, MAP = 16 lbs P/acre. Results indicate that struvite is equivalent to MAP as a P source for commercial production of alfalfa.

Future Plans

The nutrient recycling project will continue through 2019. In addition, companion replicated plots studies are underway to evaluate the effects of ratio of MAP:Struvite and amount of P application for yield and quality of alfalfa.

Authors

Joe Harrison1, Steve Norberg1, Kevin Fullerton1, Elizabeth Whitefield1, Erin Mackey1, and Keith Bowers2.

1Washington State University, jhharrison@wsu.edu

2Multiform Harvest

Citations and video links

U.S. Geological Survey, Mineral Commodity Summaries, January 2013. http://minerals.usgs.gov/minerals/pubs/commodity/phosphate_rock/mcs-2013-phosp.pdf

    The Mobile Struvite Project Overview Video: Capturing Phosphorus from Liquid Dairy Manure and Cost Efficient Nutrient Transport

    Dairy Struvite Video: Capturing Phosphorus from Dairy Manure in the Form of Struvite on 30 Dairy Farms in WA state

    Alfalfa Struvite Video: Struvite, a Recycled Form of Phosphorus from Dairy Manure, used as Fertilizer for Alfalfa Production

Acknowledgements

This project funded by the USDA NRCS CIG program and the Dairy Farmers of Washington.


The authors are solely responsible for the content of these proceedings. The technical information does not necessarily reflect the official position of the sponsoring agencies or institutions represented by planning committee members, and inclusion and distribution herein does not constitute an endorsement of views expressed by the same. Printed materials included herein are not refereed publications. Citations should appear as follows. EXAMPLE: Authors. 2019. Title of presentation. Waste to Worth. Minneapolis, MN. April 22-26, 2019. URL of this page. Accessed on: today’s date.

Evaluating Manure Nutrient Density and Paths for Improved Distribution

Increased density of livestock farms in some locations has increased manure nutrient density applied to the land base in that area. The increased nutrient density in some cases exceeds crop demands and leads to increased nutrient losses to the environment. In this study, we are using new approaches (including optimization modeling) to better inform stakeholders on locations which have excess manure nutrients produced as compared to crop uptake and pathways to improve distribution of manure nutrients including manure processing and transport options. The output of this work can be used to guide policy and development of methodologies to transport manure nutrients most cost effectively to improve nutrient distribution over a larger land-base area (such as a watershed).

What did we do?

We gathered data for livestock facilities in Wisconsin including location and production of manure to determine nutrient production as well as cropping information to determine nutrient uptake over a given land base. We then gathered information on several manure processing systems and used optimization models to identify the most cost effective methods of processing and transport to improve nutrient distribution.  

What have we learned?

We have found that some manure processing technologies are more economically viable than other technologies based on the desired environmental goal. In addition, we have begun to outline specific policy incentives that may be needed to begin to see increased installations of the manure processing systems modeled.  

Future plans

We plan to further investigate additional manure technologies, develop a website so others can integrate data into the models, and run additional scenarios to guide investments on manure processing systems. In addition, out next steps look to integrate life cycle assessment data into the optimization models for refinement of integration of environmental impacts.

Authors

Rebecca A. Larson, Associate Professor, Biological Systems Engineering, University of Wisconsin-Madison, rebecca.larson@wisc.edu

Horacio Aguirre-Villegas, Assistant Scientist, Biological Systems Engineering, University of Wisconsin-Madison

Mahmoud Sharara, Assistant Professor, North Carolina State University

Victor Zavala, Associate Professor, Chemical & Biological Engineering, University of Wisconsin-Madison

Apoorva Sampat, Chemical & Biological Engineering, University of Wisconsin-Madison

Yicheng Hu, Chemical & Biological Engineering, University of Wisconsin-Madison

Acknowledgements   

This material is based on work that is supported by the National Institute of Food and Agriculture, U.S. Department of Agriculture, under award number 2017-67003-26055.


The authors are solely responsible for the content of these proceedings. The technical information does not necessarily reflect the official position of the sponsoring agencies or institutions represented by planning committee members, and inclusion and distribution herein does not constitute an endorsement of views expressed by the same. Printed materials included herein are not refereed publications. Citations should appear as follows. EXAMPLE: Authors. 2019. Title of presentation. Waste to Worth. Minneapolis, MN. April 22-26, 2019. URL of this page. Accessed on: today’s date.
Spatial and Temporal Soil Nitrogen Distribution After Shallow Disk Manure Injection in Corn

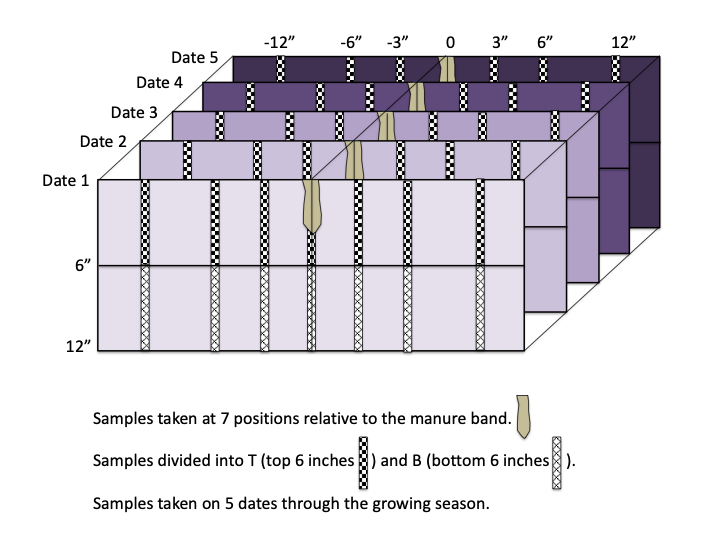
The purpose of this field research was to explore nitrogen (N) distribution in the form of nitrate and ammonium in both a spatial and temporal manner over two seasons in manure injection plots in central Pennsylvania. The description of N movement from high concentration at the manure band through the season can aid in understanding of nutrient migration and utilization efficiencies. The work was complimentary to previous soil sampling protocol developed for mid-season nitrate testing in corn fields with injected manure.

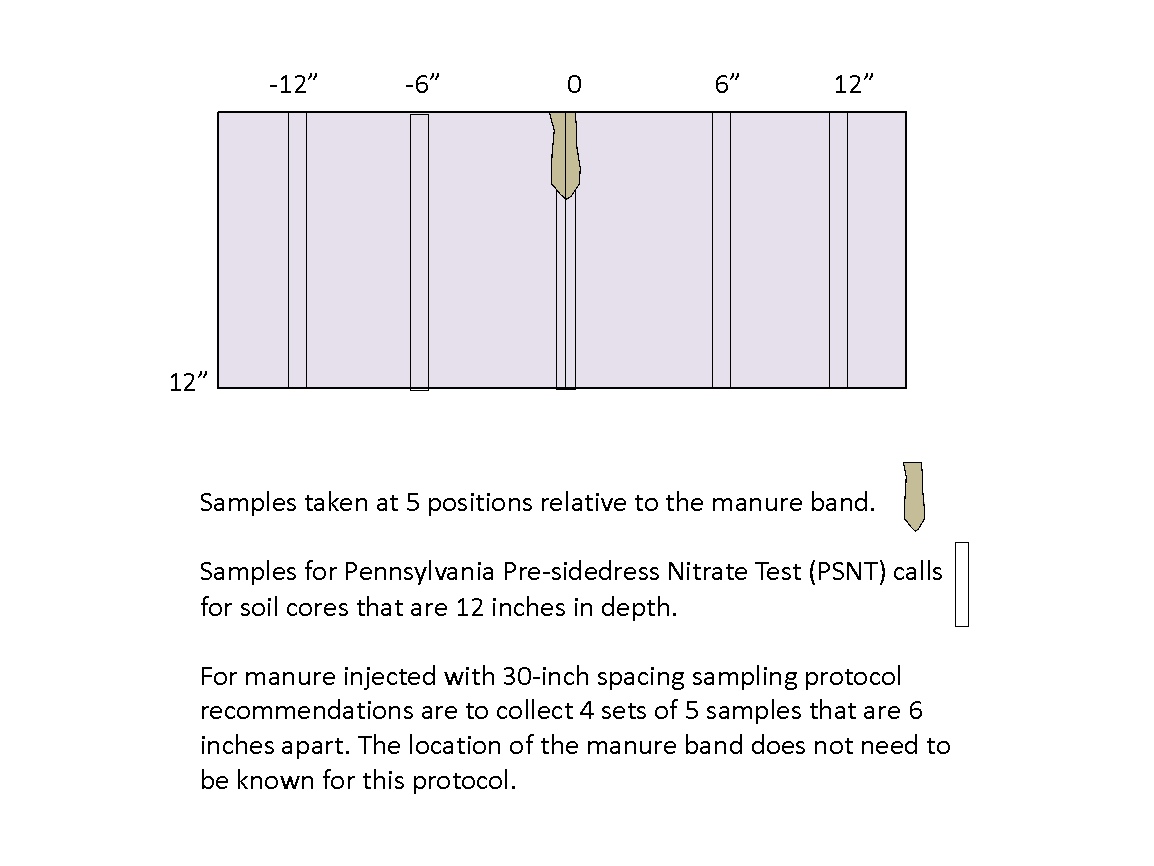
Mid-season soil testing for N protocols such as the Pre-Sidedress Nitrate Test in corn can be valuable tools to examine nutrient efficiencies. Economic benefit can result when producers use test information to determine if current soil N will allow maximum crop growth or if additional N sidedressing is needed to reach yield goals. Environmental benefits of the test include optimizing in-field N while minimizing excess application of the nutrient. However, conducting the test on soils where manure injection has occurred presents accuracy challenges due to uneven nutrient distribution. A soil sampling protocol for these scenarios was presented at the 2017 Waste to Worth Conference. The protocol calls for composite collection of four sets of soil samples, with each set containing five soil cores of 12-inch depth collected six inches apart from each other in a line perpendicular to the direction of manure injection (Figure 1).

Figure 1. Earlier work determined that collecting and compositing four sets of five soil samples that were 12-inches deep and 6-inches apart where manure injection banding was in place was an accurate substitution for Pre-sidedress Nitrate Testing compared to soils with surface broadcasted nitrogen.

What did we do?

In the current research, N measurements were taken at several distances from the manure band center and analyzed at depths of 0-6 inches and 6-12 inches. Measures in manure plots were collected at five different dates through each of two growing seasons (Figure 2).

Figure 2. Current research explored nitrogen distribution through 5 dates in the growing season to develop both a spatial and temporal appreciation of nitrate distribution and efficiencies.

What have we learned?

Results show that N concentrations ‘peak’ in the region immediately near the injection band early in the season and then flatten through the season. A comparison of the top 6-inch samples with average of the both sampling depths indicate that the top 6 inches may be predictive of the entire 12-inch depth. This presentation will provide results and trends observed in N movement from injection bands in these soil plots.

Authors

Robert Meinen, Senior Extension Associate, Department of Animal Science, The Pennsylvania State University, rjm134@psu.edu


The authors are solely responsible for the content of these proceedings. The technical information does not necessarily reflect the official position of the sponsoring agencies or institutions represented by planning committee members, and inclusion and distribution herein does not constitute an endorsement of views expressed by the same. Printed materials included herein are not refereed publications. Citations should appear as follows. EXAMPLE: Authors. 2019. Title of presentation. Waste to Worth. Minneapolis, MN. April 22-26, 2019. URL of this page. Accessed on: today’s date.

Phosphorus contribution from distillers grains to corn and wheat in North Dakota

There is growing interest from farmers to know if distillers grains (DGs) could be used as a cheap alternative or supplemental input for cereal production. Condensed distillers solubles (CDS) and wet distillers grains (WDG) are co-products from ethanol production that are mainly used as sources of feed for livestock. They are sometimes available to farmers when in excess of demands as feed, or when for whatever reason, the plant encounters some storage limitations, and have to dispose of the products. Potential environmental problems and cost of freighting huge loads to distant places for disposal has been a concern for ethanol plants. However, the cost of procurement and transportation of DGs, storage, and availability of appropriate equipment to apply these products to farmlands, are some of the bottlenecks for farmers interested in their value as fertilizer sources. Despite these concerns, farmers who farm in close proximity to ethanol plants, or who have the means to transport and apply these products in nearby fields are the ones likely to benefit from the DGs as fertilizer inputs. Preliminary studies indicate that when DGs are applied to soil as sources of nitrogen (N) or phosphorus (P), yields have been similar or better in comparison to synthetic fertilizers. Farmers also appreciate the environmental value in that nutrients removed with the corn following harvest from their fields to the ethanol plants can be recycled back to farmlands. Procurement of DGs by farmers also creates and enhances a synergism between farmers and the ethanol plants, considering the latter could cut down on storage, drying, or disposal costs if farmers are willing to buy or take any excess DGs.

What Did We Do?

Methods are reported for field studies that assess the effects of P from three sources on grain yield and quality of corn in 2017, and wheat in 2017 and 2018. Study sites were located at the NDSU Carrington Research Extension Center, Carrington (ND). The P sources were CDS, WDG, and triple super phosphate (TSP) fertilizer. Rates of P were 0, 40, and 80 lbs P2O5 for wheat in addition to 120 lbs/ac for corn. Wheat treatments in 2017 and 2018 included surface application versus incorporation following application. The weight or volume of WDG or CDS applied varied by year, depending on the nutrient analysis. In 2018, to apply 20 lbs P, 3.3 T/ac of WDG, and 270 gallons/ac of CDS were required. At these rates, 112 lbs N, 17 lbs S, and 27 lbs K2O were applied with WDG. CDS contributed 32 lbs N, 31 lbs K20, and 15 lbs S at the 40 lbs P rate. Urea was applied up to the N rate recommended (79 lbs) to prevent deficiency for the check (0 lbs P) and TSP treatments, and less for the 40 lbs P rate of CDS. Sulfur (as ammonium sulfate) was also added to the check plots and those that received TSP. Treatments were surface applied and incorporated. CDS was mixed with water to facilitate manual application to the small plots, 5 x 25 ft.

What Have We Learned?

In 2017, P did not impact yields for both corn and wheat trials. This was probably due to high soil P level, 16 and 13 ppm P from the corn and wheat respective fields, before planting. P sources did not affect yields. Following harvest, P removed with the grain, on a dry weight basis, was significantly greater with WDG (76.2 lbs/ac) compared to TSP (69 lbs). The difference in grain P removed between WDG and CDS (75.7 lbs/ac) was not statistically significant. Neither yields nor protein differed between P sources.

In 2018, yields improved significantly from P application with DGs and TSP as sources. The P unfertilized plot (0 lbs P) produced 42 bushels, which was significantly less (by 10 bushels) than yields at 40 lbs P. Yields were also significantly less at 40 lbs P (by 5 bushels) compared to 80 lbs P. Yields produced by CDS, WDG, and TSP were similar (54 bushels). Earlier in the season, Normalized Difference Vegetation Index data were collected using a remote sensor to provide an index of crop vigor. There were no differences in vigor between P rates. Meanwhile, the crop vigor of TSP treatment was significantly greater than for both DGs. This was likely due to better availability of P and N, early in the growing season, from urea and TSP. However, these nutrients were later available after mineralization from DGs, in amounts that were adequate to satisfy the crop’s needs similar to respective P rates from TSP. Grain P removal was not different between P sources. When averaged across P rates, P removal in the grain was 33 lbs P2O5. Grain P removal was 23, 30, and 35 lbs/ac at 0, 40, and 80 lbs rates, respectively.

effect of P sources on yield of spring wheat at three rates of P plot
Figure 1. Effect of P sources on yield of spring wheat at three rates of P (2017).

Grain protein was significantly greater with WDG compared to CDS and TSP, probably due to higher N applied with DGs at the 80 lbs rate of P, 223 lbs N at 80 lbs P compared to 79 lbs applied with TSP and CDS on a soil that already had 47 lbs and previous crop was soybeans.

Considering the 2018 results and results previously reported from the 2015 and 2016 trials, CDS and WDG can be valuable sources of P and other nutrients for grain crops in North Dakota. For farmers who can transport DGs short distances, pay little or nothing for it, and apply with their manure applicators, they should feel comfortable applying DGs as a good source of P and N.

Future Plans

Some farmers have been curious about the dried distillers grains as P sources. We will conduct another study in 2019 including the dry product (DDG), even though we understand it is very unlikely that farmers would make any profit with the dry product as a source of nutrients.

Authors

Jasper M Teboh, Research Soil Scientist, NDSU – Carrington Research Extension Center

Jasper.Teboh@ndsu.edu

Szilvia Yuja, Research Soil Specialist, NDSU – Carrington Research Extension Center

Additional Information

Where can people go to learn more about this project or research? List journal articles, websites, publications, articles, social media, or other resources.

Please contact me with questions at Jasper.Teboh@ndsu.edu, or by phone at 701-652-2951 (Ext 109).

Results from this research were first presented at the ASA/SSSA/CSSA 2016 annual conference in Phoenix and is accessible at: https://scisoc.confex.com/crops/2016am/webprogram/Paper100533.html

A summary of findings was later presented on the NDSU – Carrington REC blog at: https://www.ag.ndsu.edu/CarringtonREC/center-points/distillers-grains-impacted-yields-of-corn-and-spring-wheat-when-used-as-a-source-of-p

NDSU Carrington Research and Extension Center Annual report, 2018. https://www.ag.ndsu.edu/carringtonrec/documents/annual-reports/2018-annual-report

Acknowledgements

The authors are grateful to the North Dakota Corn Council, and North Dakota Agricultural Products Utilization Commission for funding the corn and wheat projects, respectively, and also to Tharaldson Ethanol (Casselton, ND) for supplying us with the distillers grains.   


The authors are solely responsible for the content of these proceedings. The technical information does not necessarily reflect the official position of the sponsoring agencies or institutions represented by planning committee members, and inclusion and distribution herein does not constitute an endorsement of views expressed by the same. Printed materials included herein are not refereed publications. Citations should appear as follows. EXAMPLE: Authors. 2019. Title of presentation. Waste to Worth. Minneapolis, MN. April 22-26, 2019. URL of this page. Accessed on: today’s date.
Considerations in Evaluating Manure Treatment Systems for Dairy Farms

Advanced manure treatment may become a major system on some dairy farms in the future.  Reducing the impacts of excess nitrogen and or phosphorous may be necessary on farms with a limited or remote land base.  Additional treatments to recover solids, extract energy, concentrate nutrients, reduce odors, reduce the mass/volume, and/or reduce pathogens may become more of a priority as farms seek to move toward sustainability.  Potential systems should be evaluated from many perspectives including on an economic and effectiveness basis. There are many variables to consider in evaluating a manure management system. Potential systems should be selected based on many criteria including:  operational history, operational reliability, market penetration, capital cost, O&M cost, value proposition, and vendor information and documentation including case studies and customer reviews.

What did we do?

Manure management formally started in the second half of the 20th century with the development and implementation of the water quality best management practice (BMP) of long-term manure storage.  Storage provides farms with the opportunity to recycle manure to cropland when applied nutrients can be more efficiently used by the crop.  Many long-term manure storages were built to improve nutrient recycling and minimize risk. In some cases, anaerobic lagoons were built to both reduce the organic matter spread to fields and store manure.  Simultaneously as poultry and livestock consolidation escalated, more manure storages were built and their volume increased to reflect the recognized need to store manure longer. Cooperative Extension, Soil and Water Conservation Districts and Natural Resources Conservation Service have assisted in providing planning, design, construction and maintenance of these manure storage systems.

What have we learned?

Many lessons have been learned from storing manure long-term.  They include, but are not limited to:

    • While storing manure long-term reduces water quality impairment, it also produces and emits methane, a greenhouse gas.  Greenhouse gases are reported to contribute to global warming. The US dairy industry is under attack by some because of this, and it is likely that the decline in fluid milk sales has, in some part, been affected by this.  The lesson learned here is that the implementation of BMPs can have unintended consequences; therefore, all future BMPs need to be thoroughly vetted before substantial industry uptake happens in order to avoid undesirable unintended consequences.
    • Larger long-term storages are better than short-term (smaller) ones.  Storages that store manure for a longer period of time provide farms with increased flexibility when it comes to recycling manure to cropland.
    • Long-term storages can emit odors that can be offensive to neighbors and communities.  Farms have adopted improved manure spreading practices, namely direct incorporation, to reduce odor issues but incorporation doesn’t work well on some crops.  Some farms have also adopted anaerobic digestion as a long-term storage pre-treatment step in order to reduce odor emissions from storage and land application.
    • Substantial precipitation can accumulate in long-term storages located on farms in humid climates.  Increased storage surface area (generally an outcome of building larger storages) results in more precipitation to store and handle as part of the manure slurry.  Every acre-foot of net perception results in 325,900 gallons of additional slurry to store and spread. If each manure spreader load is 5,000 gallons, then this means 65 additional loads are required.
    • Neighbors of larger farms are more sensitive to intensive truck traffic than regular but low-level truck traffic.  Long-term storages require intensive, focused effort to empty and the over the road truck traffic can be offensive in some farm locations.
    • Insufficient storage duration results in the need to recycle manure to cropland during inopportune times and thus may not be contributing to the BMP goal.  Fall spreading is still required on many farms; however, it also may be unlikely that a sufficient spring planting window exists for farms to spread all their manure in the spring, avoid compacting wet soils and also get spring crops planted in time.
    • Where longer term storage duration and or incorporation of the manure to prevent odor emissions is needed to facilitate spring and summer manure spreading, farms may have more manure nutrients than needed to meet crop demand.

Future Plans

The above lessons learned support the need for advanced manure treatment systems on some farms that can also be used as the basis for considerations that should be included when evaluating all manure treatment systems.  It is important that the manure treatment equipment/system components and the overall system address the farm need(s) as best as possible. A challenge with evaluating the existing manure treatment equipment available to the farmer is the lack of performance and economic data.  Comparatively, advanced manure treatment (we define this as treatment above basic primary solid-liquid separation) is in its infancy stage of adoption and thus little field performance data exists. Our plans are to continue (as funding allows) to perform more on-farm manure treatment system evaluations and to report facts to our US dairy industry stakeholders.

Corresponding author, title, and affiliation

Curt Gooch, Environmental Systems Engineer, PRO-DAIRY Dairy Environmental System Program, Dept. of Animal Science, Cornell University

cag26@cornell.edu

Other authors

Peter Wright, Agricultural Engineer, PRO-DAIRY Dairy Environmental System Program, Dept. of Animal Science, Cornell University

Additional information

Additional project information, including reports about on-farm assessment of manure treatment systems, is available on the Dairy Environmental System Program webpage: www.manuremanagement.cornell.edu

Acknowledgements

New York State Department of Agriculture and Markets for their continued financial support of the PRO-DAIRY Program, the New York State Energy Research and Development Authority (NYSERDA) for funding many on-farm sponsored projects, and the US dairy farmers who have collaborated with us for over three decades.

The authors are solely responsible for the content of these proceedings. The technical information does not necessarily reflect the official position of the sponsoring agencies or institutions represented by planning committee members, and inclusion and distribution herein does not constitute an endorsement of views expressed by the same. Printed materials included herein are not refereed publications. Citations should appear as follows. EXAMPLE: Authors. 2019. Title of presentation. Waste to Worth. Minneapolis, MN. April 22-26, 2019. URL of this page. Accessed on: today’s date.

NRCS Solid-Liquid Separation Document – It is Finally Here!!

NRCS has a new technical document entitled “Solid-Liquid Separation Alternatives for Manure Handling and Treatment.”  It was created through efforts from Dr. John Chastain, Clemson University with funding provided by USDA-NRCS.

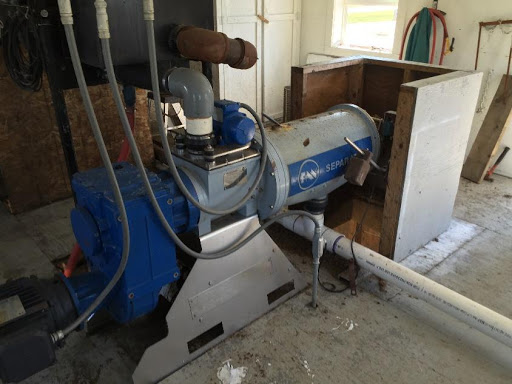
Screw press solid-liquid separator
Screw press solid-liquid separator (Source: USDA-NRCS)

This document brings together both the theory behind solid-liquid separation and the practical application of many different separation technologies.  Several farm scale demonstration projects are also summarized in the report. Solid-liquid separation can serve to achieve many livestock operational objectives such as nutrient partitioning, improved pumping characteristics, solids removal from storage facilities and reduced organic loadings.  The use of separation technologies is essential for many operations and has become an integral part of the efficient performance of these livestock facilities. Some of the purposes and uses of this document include assisting in solid-liquid separation technology selection, evaluating separation performance, and quantifying the impact of solid-liquid separation on manure management.  This presentation provides an overview of this document including methods of solid-liquid separation, influence of manure characteristics and handling methods, fundamentals of solid-liquid separation, performance of various solid-liquid separation technologies, unique separation technologies and applications and design considerations.

What Did We Do?

Use of coagulant and flocculant to enhance solid-liquid separation
Use of coagulant and flocculant to enhance solid-liquid separation (Source: USDA-NRCS)

Extensive effort through literature searches and testing went into compiling performance and design information on various types of solid-liquid separation technologies.  Separation theory was incorporated into the document to provide an understanding of separation principles and background information to assist in technology selection for improved system performance.  To improve usability of the document, it was divided into the following chapters: Methods of Solid-Liquid Separation, Manure Characteristics and Handling Methods, Fundamentals of Solid-Liquid Separation, Measures of Solid-Liquid Separation Performance, High-Rate Solid-Liquid Separation, Unique Applications of Solid-Liquid Separation Technology, and Design Considerations.  Several examples were provided throughout to assist in the design process of the various technologies. The document also includes information on the uses and benefits of coagulants and flocculants and separation methods associated with sand laden manure. Numerous system diagrams assist in illustrating the vast array of solid-liquid separation technologies that can be implemented in an animal manure treatment system.

What Have We Learned?

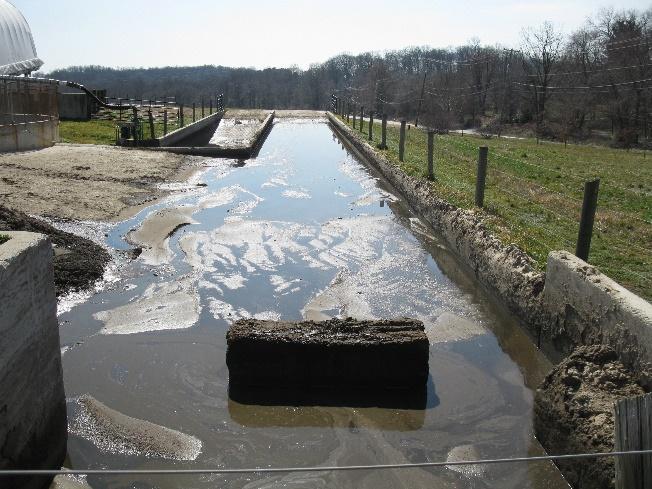
Sand settling land
Sand settling land (Source: USDA-NRCS)

This work brings together fundamental information about solid-liquid separation, benefits and limitations of many separation technologies, performance measurement techniques along with design considerations into one document.  Even though there are significant differences in performance and costs between the various separation technologies, the approach selected is largely dependent on critical elements such as landowner objectives, facility size, performance goals, operation and maintenance and other factors.  This document will help designers and operators choose the separation technology or technologies that will best meet the goals established for the operation.

Future Plans

This document will be published as chapter 4 of the USDA-NRCS National Engineering Handbook, Part 637 Environmental Engineering.

Author

Jeffrey P. Porter, P.E.

Animal Manure and Nutrient Management Team Leader

USDA-Natural Resources Conservation Service

jeffrey.porter@gnb.usda.gov

Additional information

Once published, a copy of the document can be found at https://directives.sc.egov.usda.gov/.

Acknowledgements

A special thank you goes out to the Piedmont-South Atlantic Coast Cooperative Ecosystems Studies Unit (CESU).  This Cooperative and Joint Venture Agreement allowed for this work to be completed.

Additional support was provided by the Confined Animal Manure Managers Program, Clemson Extension, Clemson University, Clemson, SC.

The authors are solely responsible for the content of these proceedings. The technical information does not necessarily reflect the official position of the sponsoring agencies or institutions represented by planning committee members, and inclusion and distribution herein does not constitute an endorsement of views expressed by the same. Printed materials included herein are not refereed publications. Citations should appear as follows. EXAMPLE: Authors. 2019. Title of presentation. Waste to Worth. Minneapolis, MN. April 22-26, 2019. URL of this page. Accessed on: today’s date.

Newtrient Manure Technology Catalog: An On-line Resource for Farmers, Their Key Advisors and Others Involved in Dairy Manure Management

Looking at the manure-management technologies that currently exist and the new and emerging technologies, Newtrient provides a reliable, third-party technology evaluation tool for the dairy industry. Three years of time and effort has been put into evaluating almost 300 technologies that are included in the catalog, over half of which are related to biogas production or digestate management. Newtrient launched an open-source, technology catalog in 2017 that provides a comprehensive listing of relevant and readily available dairy manure management technologies in the U. S.

What we do?

The U.S. dairy industry is voluntarily playing a critical role in working “towards sustainability” (Scott & Gooch, 2017). As a result of industry consolidation, manure treatment technologies are being developed and marketed that target larger operations. The goal is to help farms work on continuous improvement on sustainability issues while operating at larger scale. Unfortunately, the efficacy and economics of the treatment technologies are not always well established. As a result, the relative costs and impacts are often difficult to compare, although its importance is realized.

Newtrient, on behalf of the U.S. dairy industry, formed a Technology Assessment Team (TAT) in 2016, comprised of a cross section of academic and industry professionals with in-depth expertise in dairy manure management. One of the first tasks assigned to the TAT was to conduct systematic verification and catalog available dairy manure treatment technologies in the United States. The ongoing effort by Newtrient is to identify and evaluate available dairy manure treatment technologies which has resulted in the Newtrient online Technology Catalog (Catalog) with over 240 entries (Newtrient, 2019).

Lessons Learned?

Many lessons have been learned during the development of the Newtrient Technology Catalog.  One of the most important is that it is necessary to develop a standard, easy to use way of presenting the information on many differing technologies and companies, the Newtrient TAT does this in a variety of ways including:

    • Company description – We work with each vendor to provide a brief description of the company, its mission and its history.
    • Technology description – A succinct and informative overview of the technology and how it works is the goal and this, combined with an image or flow chart, is often enough for the average visitor.
    • Business information – A vendor-completed Newtrient Business Information Request (BIR) form can be viewed or downloaded when additional information is desired.
    • Technology information – A vendor-completed Newtrient Technology Information Request (TIR) is also available on line providing additional technical details including what it takes to install and make the technology work.
    • Expert reviews – Expert opinion and evaluation of technologies from the Newtrient TAT provide insight and perspective that is not available anywhere else.
    • Newtrient 9-Point Score – A quick and intuitive visual reference that provides answers to 9 specific questions in three categories, chosen to help set a standard for technologies and a basis for comparison. The nine points include the following:
        • COMMERCIAL VIABILITY
          • OPERATIONAL HISTORY – Is this technology currently operational on at least three North American dairy farms?
          • OPERATIONAL RELIABILITY – Does this technology have record of reliable performance of more than 12 months at each of at least three farms?
          • MARKET PENETRATION – Has this technology been installed on at least 10 North American dairy farms?
        • ECONOMICS & INDUSTRY VALUE
          • CAPITAL COST – Has information on the installed capital costs been clearly defined and communicated to the Newtrient TAT?
          • OPERATIONS AND MAINTENANCE COST – Are the actual operations and maintenance costs clearly defined and communicated to the Newtrient TAT?
          • VALUE PROPOSITION – Does this technology or the products it makes, deliver to the farm identifiable economic, environmental, or community value (e.g. reduced cost, increased income, reduced odor, improved nutrient use, etc.)?
        • TRANSPARENCY & INTERACTION
          • VENDOR INFORMATION SHARING – Has the company provided complete and verified Newtrient BIR and TIR documents to Newtrient?
          • CASE STUDY – Has a case study demonstrating the performance claimed by the vendor been completed by the Newtrient TAT?
          • CUSTOMER REVIEWS – When asked how likely is it they would recommend this technology to a colleague; have at least three customers scored the technology at least a 7 out of 10?
    • Highlighting Technologies – Newtrient reviews technologies and provides recognition for those that have proven themselves, show potential or have not engaged with Newtrient but are actively marketing to dairymen. The three categories are:
      • Newtrient Recognized:  for technologies that are proven in the field.
      • Emerging Technology:  for technologies that show significant promise.
      • Not Vendor Verified:  for vendors who have not worked with Newtrient to verify and validated the information regarding their business or technology.
    • Newtrient Evaluation & Assessment of Technologies (NEAT) – After the catalog was first introduced it became obvious that there was additional work that was needed regarding the impact of each technology on key environmental areas.  In response, the TAT developed the NEAT process for evaluating technologies and their impacts on six key areas (see accompanying paper presented at this conference on the NEAT process).

Future Plans

The Newtrient Technology Catalog is ever changing and being updated; new technologies are added regularly, BIRs and TIRs are updated, new case studies are written, and new functionality is added regularly. The catalog was recently updated to accommodate outcomes of applying the NEAT process to select technology types.  Additionally, the TAT is evaluating inclusion of the following:

    • NRCS Conservation Practice Standards and guide to USDA grant programs
    • Feed and manure additives with a system for comparing their efficacy and economics
    • Directories of resources for help in nutrient management planning, engineering, and other professional services related to manure treatment/nutrient management
    • Expanding and updating the Newtrient TIR to include all of the information needed to qualify a technology for USDA grant and cost share programs

Author

Mark Stoermann, Chief Operating Officer, Newtrient LLC.

mstoerm@newtrient.com

Other authors

Curt Gooch, Environmental Systems Engineer, PRO-DAIRY Dairy Environmental System Program, Dept. of Animal Science, Cornell University.

Additional information

Additional information, including business information, technical information and case studies on technologies, is available on the catalog page of the Newtrient website: https://www.newtrient.com

Acknowledgements

Newtrient, LCC and the papers authors thank the following supporters of Newtrient: Agri-Mark, Inc.; Dairy Farmers of America, Inc.; Dairy Management Inc.; Foremost Farms USA; Land O’Lakes, Inc.; Maryland Virginia Milk Producers Cooperative Association, Inc.; Michigan Milk Producers, National Milk Producers Federation; Prairie Farms Dairy, Inc.; Prairie Farms Dairy, Inc.; Select Milk Producers, Inc.; Southeast Milk, Inc.;  St. Albans Cooperative Creamery; Tillamook County Creamery Association; and United Dairymen of Arizona.

The authors are solely responsible for the content of these proceedings. The technical information does not necessarily reflect the official position of the sponsoring agencies or institutions represented by planning committee members, and inclusion and distribution herein does not constitute an endorsement of views expressed by the same. Printed materials included herein are not refereed publications. Citations should appear as follows. EXAMPLE: Authors. 2019. Title of presentation. Waste to Worth. Minneapolis, MN. April 22-26, 2019. URL of this page. Accessed on: today’s date.