The Manure Analysis Proficiency (MAP) Program, administered by the Minnesota Department of Agriculture, began in the mid-1990s to assist US Midwest analytical laboratories to verify the accuracy (including both bias and precision) of laboratory manure analyses. In 2003, the program expanded nationally and continues today. With an annual enrollment of 60 to 74 labs each year over the past two decades and the analysis of 120 manure proficiency samples of 12 test parameters, trends in laboratory methods and performance have arisen. The presentation will cover inter-laboratory bias and precision of the primary manure analysis parameters: total solid content, nitrogen, ammonia nitrogen (NH3-N), phosphorus and potassium.
What Did We Do?
The MAP Program was designed to follow international standards under the ISO/IEC 17025 general requirements for the coordination of a proficiency testing program. This includes development and use of standard protocols for the preparation of manure proficiency testing (PT) samples, the use of blind sample replicates for the assessment of intra-lab precision, and the implementation of robust statistical measures for the assessment of data for the evaluation of both laboratory accuracy (bias) and precision.
Since 2002, the MAP program has sent PT samples to laboratories twice per year. Each cycle includes three manure types with each type having three replicates (for a total of nine manure samples). The PT samples are selected based on source animal type and a range of total solids (2-90%). Samples are thoroughly ground and homogenized and then packaged and frozen prior to overnight shipping to program participants. Each participating laboratory completes the required tests and sends back their results along with their analytical methods used to the MAP program. With the results tabulated from all laboratories each cycle, method bias is assessed based on the inter-lab (or between lab) median and 95% confidence limits (using the median absolute deviation). Precision is assessed based on the intra-lab (or within lab) relative standard deviation of PT sample replicates. Participating labs are provided graphical reports illustrating method performance as well as lab bias and precision.
One-hundred twenty-nine manure PT samples from dairy, beef, swine, and poultry operations have been evaluated since 2002 and each sample was analyzed by 60 to 74 labs participating in the MAP program (depending on the year). The samples ranged from 3.1 to 91% total solids, 0.02 to 2.71% total nitrogen, and 0.05 to 0.48% total phosphorus. With this wide range of manure types and conditions, plus the ability to pair data with manure analysis methods and accuracy ratings, we can evaluate the efficacy of certain methods and discuss their pros and cons.
What Have We Learned?
MAP program results for nitrogen have shown the dry combustion method to be unsuitable for manure samples with total solid content less than 10%. Results for four different ammonia methods indicate generally good agreement between methods in the median concentrations, but methods varied in precision. Across samples, intra-laboratory precision decreased with decreasing analyte concentration, often associated with decreased manure total solid content. In general, total solids, phosphorus and potassium methods were of high precision with intra-lab precision < 5%. Manure test parameters exhibiting poor intra-lab precision were EC, pH, and NO3-N.
Future Plans
The MAP program continues to operate under the Minnesota Department of Agriculture in partnership with Central Lakes College in Brainerd, MN. The team is currently working with the USDA-NRCS (who provided funding), the University of Minnesota, and laboratory directors of public and private laboratories to update the “Recommended Methods of Manure Analysis” manual which is expected to be released and printed in 2022.
Authors
Robert Miller, Technical Director, Agricultural Laboratory Proficiency Program
Corresponding author email address
rmiller@soiltesting.us
Additional author
Jerry Floren, MAP Program Director (retired), Minnesota Department of Agriculture
Larry Gunderson at the Minnesota Department of Agriculture
The authors are solely responsible for the content of these proceedings. The technical information does not necessarily reflect the official position of the sponsoring agencies or institutions represented by planning committee members, and inclusion and distribution herein does not constitute an endorsement of views expressed by the same. Printed materials included herein are not refereed publications. Citations should appear as follows. EXAMPLE: Authors. 2022. Title of presentation. Waste to Worth. Oregon, OH. April 18-22, 2022. URL of this page. Accessed on: today’s date.
Most manure book values used today from the MidWest Plan Service (MWPS) and American Society of Agricultural and Biological Engineers (ASABE) were derived from manure samples prior to 2003. To update these manure test values, the University of Minnesota in partnership with the Minnesota Supercomputing Institute, is working to build a dynamic manure test database called ManureDB. During this database construction, the University of Minnesota collected manure data spanning the last decade from five labs across the country. Trends, similarities, and challenges arose when comparing these samples. Having current manure test numbers will assist in more accurate nutrient management planning, manure storage design, manure land application, and serve agricultural modeling purposes.
What Did We Do?
We recruited five laboratories for this preliminary study who shared some of their manure sample data between 2012-2021, which represented over 100,000 manure samples. We looked at what species, manure types (liquid/solid), labels, and units we had to work with between the datasets to make them comparable. Once all the samples were converted into either pounds of nutrient/ton for solid manure or pounds of nutrient/1000 gallons for liquid manure, we took the medians of total nitrogen, ammonium-nitrogen (NH4-N), phosphate (P2O5), and potassium oxide (K2O) analyses from those samples and compared them to the MWPS and ASABE manure nutrient values.
What Have We Learned?
There is no standardization of laboratory submission forms for manure samples. The majority of samples have minimal descriptions beyond species of animal and little is known about storage types. With that said, we can still detect some general NPK trends for the beef, dairy, swine, poultry manure collected from the five laboratories in the last decade, compared to the published book values. For liquid manure, the K2O levels generally increased in both the swine and poultry liquid manure samples. For the solid swine manure and solid beef manure, total N, P2O5, and K2O levels all increased compared to the published book values. The solid dairy manure increased in P2O5 and K2O levels, and the solid poultry manure increased in total N and K2O. See Figure 1 for the general trends in liquid and solid manure for swine, dairy, beef, and poultry.
Table 1. Manure sample trends 2012-2021 compared to MWPS/ASABE manure book values. (+) = trending higher, (o) = no change/conflicting samples, (-) = trending lower
Liquid
Total N
NH4–N
P2O5
K2O
Swine
o
o
–
+
Dairy
–
o
–
o
Beef
o
o
o
o
Poultry
o
+
–
+
Solid
Total N
NH4–N
P2O5
K2O
Swine
+
o
+
+
Dairy
o
o
+
+
Beef
+
–
+
+
Poultry
+
o
o
+
Future Plans
The initial data gives us a framework to standardize fields for the future incoming samples (location, manure type, agitation, species, bedding, storage type, and analytical method) along with creating a unit conversion mechanism for data uploads. We plan to recruit more laboratories to participate in the ManureDB project and acquire more sample datasets. We will compare and analyze this data as it becomes available, especially more detailed data for each species. We will be designing ManureDB with statistical and data visualization features for future public use.
Authors
Nancy L. Bohl Bormann, Graduate Research Assistant, University of Minnesota
This work is supported by the AFRI Foundational and Applied Science Program [grant no. 2020-67021-32465] from the USDA National Institute of Food and Agriculture, the University of Minnesota College of Food, Agricultural and Natural Resource Sciences, and the Minnesota Supercomputing Institute.
The authors are solely responsible for the content of these proceedings. The technical information does not necessarily reflect the official position of the sponsoring agencies or institutions represented by planning committee members, and inclusion and distribution herein does not constitute an endorsement of views expressed by the same. Printed materials included herein are not refereed publications. Citations should appear as follows. EXAMPLE: Authors. 2022. Title of presentation. Waste to Worth. Oregon, OH. April 18-22, 2022. URL of this page. Accessed on: today’s date.
Most manure composition data summaries available in the U.S. are outdated because genetics, feed rations, manure handling, and housing practices have evolved over the past two decades. This means that the community that uses this manure data, such as farmers developing manure management plans, engineers designing manure storages, state and federal regulators establishing best management practices for manure land application, or researchers modeling nutrient cycling and gas emissions, is using outdated information. Thousands of manure samples, however, are analyzed every year by university and commercial labs across the country and could provide an up-to-date source of information. Until recently, there has been no mechanism for combining and summarizing this valuable data in a way that makes the results accessible to the broader community of users. Together with the Minnesota Supercomputing Institute (MSI) and the Minnesota Department of Agriculture (MDA) – who runs the only manure analysis proficiency program in the United States – researchers at the University of Minnesota are developing a national database for manure test results. The database, or ManureDB, will meet FAIR principles (Findable, Accessible, Interoperable, and Reusable) to ensure the data is shared and used by a wide audience.
What Did We Do?
The project team brought together a stakeholder group involved with manure management, regulation, lab analysis, and research to help us develop standards and best practices for data management. The stakeholder team helped inform the creation of several deliverables to date, including a schema and framework for the database, as well as a data use agreement template. The MSI is currently working on the development of the public-facing website that will interface with the database as well as a data cleaning tool to help standardize the data as it is uploaded.
What Have We Learned?
The stakeholder group identified that data privacy is a top priority. Customer data (i.e., name and address) will be removed, though state and zip codes will remain with the data (full zip codes will not be shared publicly). We also found that there is a stark difference between what data the full stakeholder team would like to see (i.e., manure data for livestock facilities by county or watershed code for different livestock species and manure storage types) versus what commercial laboratories collect (i.e. livestock species and sometimes the address of the livestock facility, but more often the address of the person requesting the tests). Standardizing manure submission forms in the future will potentially help ensure that information collected for each sample is consistent. Future educational efforts for those advising farmers on manure testing will be needed to ensure the forms are filled out accurately instead of being left blank.
Future Plans
This project is ongoing. We are in the process of working with our current participating labs to sign data use agreements and then to clean and upload data. New labs will be recruited throughout the project period. A public-facing dashboard will be created to search through aggregate data. We are working with our stakeholder groups to design websites for other potential use cases, including a site to download cleaned data for research purposes and potentially a site for labs to be able to benchmark their samples against labs from within and outside of their regions.
Authors
Melissa L. Wilson, Assistant Professor and Extension Specialist, University of Minnesota
Corresponding author email address
mlw@umn.edu
Additional authors
Erin L. Cortus, Associate Professor and Extension Engineer, University of Minnesota
Nancy L. Bohl Bormann, Graduate Research Assistant, University of Minnesota
Kevin Janni, Extension Engineer, University of Minnesota
Larry Gunderson, Pesticide & Fertilizer Management, Minnesota Department of Agriculture
Tom Prather, Senior Software Developer, University of Minnesota
Kevin Silverstein, Scientific Lead RIS Informatics Analyst, University of Minnesota
This work is supported by the AFRI Foundational and Applied Science Program [grant no. 2020-67021-32465] from the USDA National Institute of Food and Agriculture. We’d also like to thank our stakeholders for their time commitment.
The authors are solely responsible for the content of these proceedings. The technical information does not necessarily reflect the official position of the sponsoring agencies or institutions represented by planning committee members, and inclusion and distribution herein does not constitute an endorsement of views expressed by the same. Printed materials included herein are not refereed publications. Citations should appear as follows. EXAMPLE: Authors. 2022. Title of presentation. Waste to Worth. Oregon, OH. April 18-22, 2022. URL of this page. Accessed on: today’s date.
While animal manure contains nutrients and organic material that are beneficial for crop production, the concentrations of those nutrients are typically too low to allow economically viable transportation of bulk manures over long distances to where crops are sometimes produced. Therefore, dairy manure tends to be applied to soils near where it is generated. Since phosphorous (P) is conserved during manure handling compared to nitrogen, P concentrations in soils where dairy manure is applied tend to exceed crop demands. Due to the implication that P runoff from agricultural operations plays an important role in the eutrophication of streams and other water bodies, farmers are experiencing increasing pressure and regulation to not apply animal manures to fields that are already overloaded with P.
A possible solution to P overloading is to remove some of the P from manure before it is applied. In testing the MAnure PHosphorus EXtraction (MAPHEX) System Church et al. (2016, 2017, 2018), found that by treating liquid dairy manure with a screw press followed by a decanter centrifuge, 38 – 60% of the P could be removed from the manures of a wide variety of farms. A benefit to this approach is that the P removed, is concentrated into a stackable solid (about 72% moisture) that can be more economically transported to distant fields where P may be in deficit. The remaining liquid and course solids, containing greater than 90% of the manure N, can be beneficially used nearer the source without loading those soils with P. A comprehensive farm-scale evaluation of manure nutrient extraction is needed which can be done using the Integrated Farm System Model (IFSM; USDA, 2022). The IFSM has been used to assess other manure handling strategies along with many farm-scale options for crop, animal and feeding management.
What Did We Do?
We evaluated the whole-farm performance, environmental effects, and potential economic benefit of extracting P from dairy manure using a decanter centrifuge (Rotz et al., 2022). A farm in Pennsylvania with distant cropland was simulated with the IFSM to evaluate the feasibility of extracting P to reduce transport requirements on-farm or to produce a concentrated P product for off-farm use. Three production systems were evaluated with and without the use of centrifuge extraction. The first was the current farm with manure collected by flushing, next was the same farm with manure collection by scraping and the last was a modified farm with scraped manure where only forage crops were produced and concentrate feeds were purchased. Collection by scraping greatly reduced the volume of manure handled by the centrifuge thus reducing operating time and electricity use. Reducing the crop land and removing grain production created an imbalance in nutrient utilization with potential accumulation of P in the farm soil. Under this constraint, use of the centrifuge provided a method for removing a portion of the manure P for export from the farm.
Farm simulations estimated all forms of nitrogen, P, and carbon losses. This included erosion of sediment and runoff of sediment-bound and dissolved P across the farm boundaries. Costs for owning and operating the manure handling systems were determined using the economic component in IFSM. All equipment and facilities were amortized over an economic life and the annualized cost was added to other operating costs to get a total. Manure handling costs included fixed and operating (repair and maintenance, fuel, and labor) costs of the rotary screen, screw presses, and centrifuge. Manure hauling was also an important cost in the assessment because the number of trucks required and hauling distance varied among systems. Hauling cost included the amortized initial cost of trucks and annual costs for truck repair and maintenance, fuel, and operator labor.
What Have We Learned?
On a large dairy farm of 2,000 cows and 3,450 acres of land where manure must be transported to distant cropland to obtain uniform distribution, P extraction with a centrifuge provided a better ratio of nitrogen and P contents in manure used on nearby cropland and reduced transport costs for nutrients applied to more distant cropland. Centrifuge extraction was found to be more practical and economical when used with manure scraped from the barn floor than with flushed manure. Use of the centrifuge was not economically justified with the flush system where large volumes of low concentration liquid manure were handled. When barn floors were scraped, the benefit received through reduced manure volume more than offset the increased costs of owning and operating the centrifuge. To avoid long-term accumulation of soil P on the farm with less land (2,000 cows and 2,720 acres) where concentrate feed (27% of total feed) was imported, centrifuge extraction provided a material with a high P concentration that could be exported from the farm for other uses. Extracting the P in excess of crop needs cost about $1.14/lb P. This was generally greater than the price of phosphate fertilizer, but the extract also included other nutrients and micronutrients of value to crops.
A centrifuge provides a useful tool for extracting and concentrating manure P, but the economic benefit to the producer depends upon the value of the full array of nutrients contained, manure handling practices, and the end use of the extracted material. Although marketing this material for its P content alone may not be economical, the material may have other value and the reduction in long-term risk of surface water eutrophication has a less well-defined economic benefit to society.
Future Plans
The IFSM provides a tool for evaluating the performance, environmental impacts and economics of beef cattle and dairy production systems. The addition of the new component for modeling manure nutrient extraction technologies provides a tool for evaluating the whole farm costs and benefits of various technologies being developed or proposed for on-farm use. These can include manure processing based upon dissolved air floatation, evaporation, ultrafiltration, and the full MAPHEX system.
Authors
Alan Rotz, Agricultural Engineer, Agricultural Research Service, USDA
Corresponding author email address
al.rotz@usda.gov
Additional authors
Michael Reiner, Support Scientist, Agricultural Research Service, USDA; Sarah Fishel, Support Scientist, Agricultural Research Service, USDA; Clinton Church, Chemist, Agricultural Research Service, USDA
Additional Information
Church, C. D., Hristov, A., Bryant, R. B., Kleinman, P. J. A., & Fishel, S. K. 2016. A novel treatment system to remove phosphorus from liquid manure. Appl. Eng. Agric. 32: 103 – 112. doi:10.13031/aea.32.10999
Church, C. D., Hristov, A., Bryant, R. B., & Kleinman, P. J. A. 2017. Processes and treatment systems for treating high phosphorus containing fluids. US Patent 10,737958.
Church, C. D., Hristov, A. N., Kleinman, P. J. A., Fishel, S. K., Reiner, M. R., & Bryant, R. B. 2018. Versatility of the MAnure PHosphorus Extraction (MAPHEX) System in removing phosphorus, odor, microbes, and alkalinity from dairy manures: A four-farm case study. Appl. Eng. Agric. 34: 567 – 572. doi: 10.13031/aea12632
Rotz, C.A., Reiner, M., Fishel, S., & Church, C. 2022. Whole farm performance of centrifuge extraction of phosphorus from dairy manure. Appl. Eng. Agric. In press.
This work was supported by the U.S. Department of Agriculture, Agricultural Research Service. USDA is an equal opportunity provider and employer. The authors thank the producer who contributed characteristics of their farm for this assessment.
The authors are solely responsible for the content of these proceedings. The technical information does not necessarily reflect the official position of the sponsoring agencies or institutions represented by planning committee members, and inclusion and distribution herein does not constitute an endorsement of views expressed by the same. Printed materials included herein are not refereed publications. Citations should appear as follows. EXAMPLE: Authors. 2022. Title of presentation. Waste to Worth. Oregon, OH. April 18-22, 2022. URL of this page. Accessed on: today’s date.
The amount of nitrogen lost to the air as ammonia following the application of manure is important for two reasons. From the farmer’s point of view, the loss of nitrogen as ammonia gas represents a loss of fertilizer that could have contributed to the production of a crop. From an environmental point of view, ammonia lost from a field to the atmosphere is a source of air pollution that can combine with sulfites and nitrates in the atmosphere to form extremely fine particulate matter (PM2.5) that can have harmful effects on human health and can contribute to water pollution when deposited into surface water by rainfall. Land application of animal manure is one of many sources of ammonia emissions that also include municipal and industrial waste treatment, use and manufacture of fertilizers, combustion of fossil fuel, coke plants and refrigeration (USEPA, 1995).
Animal manure can be used as a fertilizer substitute. However, the types of nitrogen in manure are more complicated than those found in most common chemical fertilizers. Nitrogen can be present in manure as ammonium-N, ammonia-N, organic-N, and nitrate-N. Not all the nitrogen in manure is immediately available for plant use. Most animal manure contains very little nitrate-N and as a result it is typically not measured. However, manure that receives aerobic treatment, i.e., composting or aeration, should be analyzed for nitrate-N since it is a valuable form of nitrogen that is the same as contained in one of the most common types of fertilizer – ammonium nitrate.
Most laboratories measure the total ammoniacal nitrogen content (TAN) of animal manure, which includes ammonium-N and ammonia-N (TAN = NH4+-N + NH3 -N). The amount of TAN that is in the ammonia form depends greatly on the pH of the manure. At a pH of 6.5 none of the TAN is in the ammonia form – it is all ammonium-N which is a great form of plant fertilizer. At a high pH, such as, 9.5, 65% of the TAN is in the ammonia form. Most animal manures have a pH in the range of 8 to 8.5 and about 10% most of the TAN is ammonia-N and can be lost to the air. As a result, TAN is often labeled as ammonium-N on manure analysis reports.
A key aspect of using animal manure as a fertilizer substitute is to make a good estimate of the fraction of the total nitrogen contained in the animal manure that can be used to grow a plant. This portion of the nitrogen is called the plant available nitrogen (PAN) and can be estimated using the following equation:
PAN =mf Organic-N + Af TAN + Nitrate-N.
(1)
Most of the nitrogen in untreated slurry and solid animal manure is organic nitrogen (organic-N) that must be mineralized in the soil to become available to plants as ammonium-N. The fraction of the organic-N that will be mineralized during the growing season is represented in equation 1 as the mineralization factor, mf. The value of the mineralization factor varies depending on animal species, the amount of treatment, as well as soil pH, moisture, and temperature. The values of mfrecommended are 0.70 for lagoon water and 0.50 for swine slurry (Chastain, 2006).
The fraction of TAN in manure that will be available to the plant is represented by the ammonium-N availability factor, Af. The ammonium-N availability factor (a decimal) is determined from the fraction of TAN lost to the air as ammonia-N using the following formula:
Af=1-( AL/ 100).
(2)
The amount of ammonia-N lost following application varies with the method of application, the extent and timing of incorporation in the soil by disking as well as the pH of the manure, the pH that the manure attains following application, and the air temperature. Most extension publications provide recommended values for estimating ammonia-N losses. For example, Clemson Cooperative Extension (CAMM, 2005) recommends use of an ammonia loss (AL) of 50% for broadcast of manure without incorporation. This would mean that a value of 0.5 is used for ammonium-N availability factor (Af) in equation 1. If the manure is incorporated into the soil within one day the recommended value for AL is 20% giving an Af value of 0.80.
The amount of nitrate-N contained in animal manure is often so small that it is not measured. However, manure that is exposed to enough air or that is treated aerobically will have a significant amount and measurement of the nitrate-N content is recommended. All the nitrate-N contained in manure is 100% plant available.
Various studies and reviews (Chastain, et al., 2001; Montes, 2002; Montes and Chastain, 2003; Chastain, 2006) have indicated that the amount of ammonia lost following application of animal manure varies much more than indicated by most extension recommendations (e.g., CAMM, 2005). The result of large differences between recommended estimates and actual values is either substantial over or under estimation of the amount of ammonia emissions to the air as well as over or underestimation of the amount of nitrogen that will be available for the plant. The objective of this paper is to provide practical recommendations for the ammonium-N availability factors for swine manure based on the application method, total solids content, and the time between broadcast and incorporation.
What Did We Do?
The data and the correlations used to develop the recommendations in this paper were provided by Montes (2002) and Chastain (2006). The effect of the application method on ammonia-N loss was estimated using the following equation:
AL =fA ALBC.
(3)
The application factors, fA, that correspond to an application method are given in Table 1 and ALBC was the ammonia loss for broadcast manure. The value of the ammonium-N availability factor, Af, for each application method was calculated using the definition given previously in equation 2.
How fast ammonia is lost following broadcast application of manure was determined by Montes (2002). The results indicated that ammonia-N loss following irrigation of lagoon water occurred too quickly to consider incorporation by disking. Values for broadcast and incorporation for slurry manure are given in Table 1. The results indicated that incorporation must follow broadcast of slurry manure within 8 hours if it is desired to reduce ammonia-N loss by 50% (fA=0.50).
Table 1. Application method factors to describe the reduction in ammonia loss as compared to broadcast application of manure. (Values based on reviews of the literature by Chastain et al., 2001 and Montes, 2002).
Application Method
fA
What type of manure can use this method?
Broadcast without incorporation
1.0
All
Broadcast followed by incorporation within 4 hoursA
0.29
Slurry
Broadcast followed by incorporation within 6 hoursA
0.40
Slurry
Broadcast followed by incorporation within 8 hoursA
0.50
Slurry
Broadcast followed by incorporation within 12 hoursA
0.64
Slurry
Band spreading (drop or trailing hose)
0.50
Liquid and Slurry
Band spreading with immediate shallow soil cover
0.12
Liquid and Slurry
Shallow injection (2 to inches below soil surface)
0.10
Liquid and Slurry
Deep injection (4 to 6 inches below soil surface)
0.08
Liquid and Slurry
AfA calculated using K = 0.086 h-1 (Chastain, 2006)
A few studies indicated that application of manure to bare soil versus cut hay, or plant residue reduced ammonia-N loss following broadcast by 10% to 20% (see Montes, 2002 and Chastain, 2006). However, it was decided that there was not sufficient data to generalize the result for practical use.
What Have We Learned?
The model was applied to as wide a range of swine manure application situations as possible. The results were tabulated as ammonium-N availability factors, Af, that may be used in the PAN equation (equation 1) along with an estimate for the mineralization factor.
Variation in Ammonium-N Availability by Application Method
The impact of application method on the ammonium-N availability factor for swine manure is shown in Table 2. Application method had the least impact on irrigation of surface water from an anaerobic treatment lagoon. The value of Af was 0.98 for irrigated swine lagoon water. This corresponded to an ammonia-N loss of 2% (AL = (1-Af) x 100). The amount of ammonia-N lost was low since more than 0.25 inches of lagoon water was applied, and most of the ammonium-N was washed into the soil. However, the ammonium-N availability factors for broadcast of manure decreased sharply as the total solids content of swine manure increased. This corresponded to ammonia-N loss ranging from 8% for liquid manure (TS = 1% to 4%) to 58% for thick slurry (TS = 15% to 20%). It can also be seen in the table that all the ammonium-N conserving application methods increased in effectiveness as the TS content of swine manure increased.
Table 2. Variation in ammonium nitrogen availability factors, Af, for swine manure and treatment lagoon surface water based on application method. (AL = (1 – Af) x 100)
Description
Broadcast or Large Bore Irrigation
Broadcast followed by incorporation within 6 hours
Comparison of the Use of New Ammonium-N Availability Factors and Current Clemson Extension Recommendations for Broadcast Application of Swine Manure
Selection of the ammonium-N availability factor (Af) and mineralization factor (mf) for a manure type and application method has a large effect on the accuracy of the estimate of nitrogen that can be used to fertilize a crop as well as the estimate of ammonia-N lost to the air. The PAN estimate determines the amount of manure applied per acre (gal/ac) and the amount of P2O5 and K2O that are applied (lb/ac). The impact of using constant values of Afand mf that are different from values that more closely match the data was studied by comparing the results for spreading lagoon water (TS = 0.5%) and slurry (TS = 7.5%) to meet a target application rate of 100 lb PAN/ac. The results are provided in Table 3. The impact of settling and biological treatment in the lagoon was indicated by the low TS content (TS=0.5%) and the fact that the lagoon water contained two pounds of TAN for every pound of organic-N. Swine slurry (TS = 7.5%) contained 1.2 pounds of TAN per pound of organic-N.
Comparison of the estimates using Clemson Extensions current recommendations with the results provided in this paper led to the following observations.
Using the new Af and mf values that varied by manure type (lagoon water vs slurry) provided higher PAN estimates than the Clemson Extension recommendations.
The higher PAN estimates resulted in reductions in the amount of manure needed to provide 100 lb PAN/ac.
The amount of ammonia-N lost per acre per 100 lb PAN applied was much lower using the new factors for estimating PAN as compared to using Clemson Extension values for lagoon water and swine slurry. Using Clemson Extension values over-estimated the ammonia-N loss/ac by 133% to 1133%.
The inaccuracies in PAN estimates for lagoon water and slurry manure also impacted plant nutrient application rates. Using the PAN estimates based on Clemson Extension recommendations to determine manure application rates resulted in over application of nitrogen by 17% to 21%. Similar over-applications were observed for P2O5 and K2 Therefore, better estimates of PAN can help to reduce excessive applications of phosphorous and provide better estimates of potash (K2O) application rates.
Comparison of the estimates of the ammonia-N lost per acre following broadcast of manure for the examples shown in Table 4 demonstrates the need to consider using values of Af and mf that more closely agree with the available data.
It must be emphasized that slurry manure with a higher TS content than 7.5% and heavily bedded manure were not included in the examples in this paper. The ammonia-N loss values will be higher and must be calculated using the Afvalues provided in this paper along with the corresponding manure analysis to yield valid conclusions.
Impact of Selected Ammonium-N Conserving Application Methods on Ammonia-N Loss per Acre, and P2O5 Application Rate
The impact of application method on the estimates of PAN, ammonia-N loss, and phosphorous application rates was calculated for swine slurry using the tabulated values for the ammonium-N availability factors given in Table 2. Lagoon water was not included because irrigation is the most common and cost-effective method of application, and the amount of ammonia-N lost to the air was the least. The application methods that were compared were broadcast, broadcast followed by incorporation within 6 hours, band spreading, band spreading with shallow soil cover, and shallow injection. Results for deep injection were not included because the improvements were very small compared with shallow injection (see Table 2). Furthermore, the horsepower and fuel costs of deep injection are higher than for shallow injection. The results are given in Table 4.
The results indicated that broadcast with incorporation within 6 hours provided a reduction in ammonia-N loss per acre of 65% and a reduction in the P2O5 application rate of 11%. Band spreading provided almost the same benefits (57% reduction in ammonia-N loss and 10% reduction in lb P2O5/ac) but would be achieved with only one pass across a field. Adding a method to immediately cover a band of manure with soil provided reductions in ammonia-N loss of 90% and reduction of the P2O5 application rate by 16%. Shallow injection provided a modest improvement in ammonia-N emissions (93%) as compared to band spreading with shallow cover. Shallow injection also provided about the same benefit in reduction of phosphorous application rate as band spreading with shallow cover.
Table 3. Comparison of land application rate and ammonia-N loss estimates using tabulated model results and current Clemson University Extension recommendations for broadcast application of swine lagoon surface water and slurry manure. Target nutrient application rate = 100 lb PAN/ac.
Swine
Lagoon Water
Slurry
TS, %
0.5
7.5
TAN, lb/1000 gal
4.3
23.0
Org-N, lb/1000 gal
2.0
19.0
P2O5, lb/1000 gal
3.6
33.0
K2O, lb/1000 gal
7.9
28.0
Land Application Rates and Ammonia-N Loss Estimates Using Clemson Extension Recommendations
Mineralization factor, mf
0.60
0.60
Ammonium-N availability factor, Af
0.80
0.50
PAN estimate, lb PAN/1000 gal
4.6
22.9
Application rate to provide 100 lb PAN/ac, gal/ac
21,552
4,367
Resulting application rate for P2O5, lb/ac
78
144
Resulting application rate for K2O
170
122
Ammonia-N Loss, lb per acre / 100 lb PAN
18.5
50.2
Land Application Rates and Ammonia-N Loss Estimates Using New Recommendations
Mineralization factor, mf
0.70
0.50
Ammonium-N availability factor, Af
0.98
0.75
PAN estimate, lb PAN/1000 gal
5.6
26.8
Application rate to provide 100 lb PAN/ac, gal/ac
17,813
3,738
Resulting application rate for P2O5, lb/ac
64
123
Resulting application rate for K2O
141
105
Ammonia-N Loss, lb per acre / 100 lb PAN
1.5
21.5
Key Impacts of Inaccurate Estimates of Af, and PAN
Over-estimation of Ammonia-N Loss/ac
1133%
133%
Actual PAN Application Rates Using Clemson Extension Recommendations to Determine Manure Application Rate, lb PAN/ac and percent over-application of PAN (%)
121
(21%)
117
(17%)
Difference in Application of P2O5, lb/ac (%)
14
(22%)
21
(17%)
Difference in Application of K2O, lb/ac (%)
29
(21%)
17
(14%)
Table 4. Impact of Application Method on Ammonia-N Loss and P2O5 Application Rate for Swine Slurry. The total solids and plant nutrient contents were given previously in Table 3 and the mineralization factor was 0.50 for all application methods.
Swine
Slurry, TS = 7.5%
Broadcast – no incorporation
Mineralization factor, mf
0.50
Ammonium-N availability factor, Af
0.75
PAN estimate, lb PAN/1000 gal
26.8
Application rate to provide 100 lb PAN/ac, gal /ac
3,738
Resulting application rate for P2O5, lb/ac
123
Ammonia-N Loss, lb per acre / 100 lb PAN
21.5
Broadcast – incorporation within 6 hours
Ammonium-N availability factor, Af
0.90
PAN estimate, lb PAN/1000 gal
30.2
Application rate to provide 100 lb PAN/ac, gal /ac
3,311
Resulting application rate for P2O5, lb/ac
109
Ammonia-N Loss, lb per acre / 100 lb PAN
7.6
Reduction in Ammonia-N loss Compared to Broadcast
65%
Reduction in P2O5 Application Rate
11%
Band Spreading
Ammonium-N availability factor, Af
0.88
PAN estimate, lb PAN/1000 gal
29.7
Application rate to provide 100 lb PAN/ac, gal /ac
3,362
Resulting application rate for P2O5, lb/ac
111
Ammonia-N Loss, lb per acre / 100 lb PAN
9.3
Reduction in Ammonia-N loss Compared to Broadcast
57%
Reduction in P2O5 Application Rate
10%
Band Spreading with Shallow Cover
Ammonium-N availability factor, Af
0.97
PAN estimate, lb PAN/1000 gal
31.8
Application rate to provide 100 lb PAN/ac, gal /ac
3,144
Resulting application rate for P2O5, lb/ac
104
Ammonia-N Loss, lb per acre / 100 lb PAN
2.2
Reduction in Ammonia-N loss Compared to Broadcast
90%
Reduction in P2O5 Application Rate
16%
Shallow Injection
Ammonium-N availability factor, Af
0.98
PAN estimate, lb PAN/1000 gal
32.0
Application rate to provide 100 lb PAN/ac, gal /ac
3,121
Resulting application rate for P2O5, lb/ac
103
Ammonia-N Loss, lb per acre / 100 lb PAN
1.4
Reduction in Ammonia-N loss Compared to Broadcast
93%
Reduction in P2O5 Application Rate
17%
Future Plans
The model results provided in this paper are currently being used to develop extension programs and will be used to update extension publications and recommendations for producers. It is hoped that these tabulated ammonium-N availability factors will be used to increase the precision of using swine manure as a fertilizer substitute and making better estimates of ammonia-N emissions.
Author
John P. Chastain, Professor and Extension Agricultural Engineer, Agricultural Sciences Department, Clemson University
Chastain, J.P. 2006. A Model to Estimate Ammonia Loss Following Application of Animal Manure, ASABE Paper No. 064053. St. Joseph, Mich.: ASABE.
Chastain, J. P., J. J. Camberato, and J. E. Albrecht. 2001. Nutrient Content of Livestock and Poultry Manure. Clemson, SC.: Clemson University.
Montes, F. 2002. Ammonia volatilization resulting from application of liquid swine manure and turkey litter in commercial pine plantations. MS Thesis, Clemson, SC.: Clemson University.
Montes, F., and J.P. Chastain. 2003. Ammonia Volatilization Losses Following Irrigation of Liquid Swine Manure in Commercial Pine Plantations. In Animal, Agricultural and Food Processing Wastes IX: Proceedings of the Nineth International Symposium, 620-628. R.T. Burnes, ed. St. Joseph, Mich.: ASABE.
USEPA. 1995. Control and Pollution Prevention Options for Ammonia Emissions (EPA-456/R-95-002), report prepared by J. Phillips, U.S. Environmental Protection Agency, Control Technology Center. Research Triangle Park, NC. Available at https://www.epa.gov/sites/default/files/2020-08/documents/ammoniaemissions.pdf.
The authors are solely responsible for the content of these proceedings. The technical information does not necessarily reflect the official position of the sponsoring agencies or institutions represented by planning committee members, and inclusion and distribution herein does not constitute an endorsement of views expressed by the same. Printed materials included herein are not refereed publications. Citations should appear as follows. EXAMPLE: Authors. 2022. Title of presentation. Waste to Worth. Oregon, OH. April 18-22, 2022. URL of this page. Accessed on: today’s date.
Co-digestion of organic material with dairy manure represents an opportunity to provide both a revenue stream to anaerobic digester operations, through the collection of a tipping fee and/or increased biogas/electricity production, as well as a means for waste generators to dispose of their product in a beneficial way.
However, there are many factors for an operator to consider when deciding on whether to accept organic waste. A major consideration is the volume of biogas that the material will generate when co-digested. This can be used both to assign a value to the waste through increased biogas production and/or electricity sales, as well as to size equipment for producing, treating and potentially selling/using the biogas. Estimating the biogas produced is a complicated process, encompassing many different factors of digester design, waste characteristics, and environmental factors.
To assist in this estimation, we have developed software that allows a user to predict the biogas production from mixed wastes and dairy manure based on changing herd sizes, as well as providing the ability to vary the timing and volume of addition of multiple organic wastes, throughout the course of a simulated year. With this user-friendly tool, we hope to enable producers to better explore the opportunities that co-digestion offers.
What Did We Do?
The originally developed Cornell Anaerobic Digester Simulations software allowed the user to input a herd size and to select how much (if any) of seven wastes would be co-digested with the dairy manure. This rudimentary method of simulation assumed that the same volume/mass would be applied to the digester in a steady-state constant fashion for the entire year that the simulations were run for. However, that is unlikely to be the case in a real-world production environment.
In the new version of the software, we have incorporated the characteristics of over 200 wastes into a user selectable interface. Once a waste type is selected, the user has the option to select when the waste is placed into the digester, whether that be on an everyday, weekly, monthly or custom basis with the option to select to which months of the year the additions occur. When selecting a weekly or monthly basis, the user can select which day(s) of the week or month wastes are added, and in the custom basis, the user can select which days of the year additions occur.
Once the timing of addition is completed, the user can select how much of the waste is applied during each addition. Whether that be a constant volume for each addition, or a custom volume for each addition.
The data for the specific wastes includes the dry matter and organic matter content as well as the biogas and methane yields. Based on the type of waste we have also assigned a “digestibility” curve to the particular waste which when assuming a first order kinetic model of gas production, can provide the production of gas a function of time. The production of biogas from all added wastes and the added manure is then summed for each day of the year to provide an estimate of the biogas production, on a daily basis, that can be summarized with a minimum/maximum/average on a monthly and annual basis.
What Have We Learned?
During the process of developing the software, we examined a few different techniques for estimating the timing of biogas production from co-digested wastes. There are more complicated models available such as Anaerobic Digestion Model #1 (ADM1), however many more parameters must be known/estimated for each waste type, (not to mention requiring a much more complicated user interface). We felt that using a simplified first order kinetic model provides a good way to add the necessary complexity to model biogas production over time without overly complicated calculations. The simplification allowed us to include a more complicated and yet more real world means of modeling the addition of wastes to a digester that wouldn’t be possible with more complicated digestion/biogas production models.
Future Plans
Currently, the Cornell Dairy Anaerobic Digestion Simulation Software is capable of predicting the amount of heat necessary to maintain digester temperatures, as well as the parasitic electrical load. Future additions will include modeling the energy usage (and effects on biogas) of treatment processes to produce Renewable Natural Gas (RNG) from biogas.
We would also like to include the ability to track nutrients through the process of digestion. Nutrient additions from the co-digestion of wastes also represent an important consideration for farm as they may or may not have the land base/crop requirements to use all of the imported nutrients. The cost of treatment of the effluent from the digester to remove nutrients, or the shipment of effluent off site may have to be added into the determination of how much of a “tipping fee” a farmer would need to charge for taking an organic waste for co-digestion.
We hope to make the program freely available to the public to use. Currently, the software is written in MATLAB which ordinarily requires a license to operate, however it is possible to create an executable standalone program that can be shared and run without the need to purchase MATLAB.
Authors
Timothy Shelford, Extension Associate, School of Integrated Plant Science, Cornell University
Corresponding author email address
tjs47@cornell.edu
Additional authors
Curt Gooch, Senior Extension Associate Emeritus, Department of Biological and Environmental Engineering, Cornell University
Peter Wright, Agricultural Engineer, Department of Animal Science, Cornell University
Lauren Ray, Agricultural Energy Systems Engineer, Cornell University
The authors are solely responsible for the content of these proceedings. The technical information does not necessarily reflect the official position of the sponsoring agencies or institutions represented by planning committee members, and inclusion and distribution herein does not constitute an endorsement of views expressed by the same. Printed materials included herein are not refereed publications. Citations should appear as follows. EXAMPLE: Authors. 2022. Title of presentation. Waste to Worth. Oregon, OH. April 18-22, 2022. URL of this page. Accessed on: today’s date.
Improvements in manure treatment/nutrient management are an important need for dairy farms to move substantively towards sustainability. This project quantifies several individual manure treatment components and component assemblies targeted to address farm/environment needs. Project outcomes should help dairy farms to make better-informed decisions about manure/nutrient management systems.
Societal demand for farms to reduce their environmental impact is driving the need for improved and cost-effective manure/nutrient management options. Dairy farms may need advanced manure treatment systems to be economically, environmentally, and societally sustainable.
What Did We Do?
Specific treatments being evaluated include anaerobic digestion, active composting, sequencing batch reactors, solid-liquid separation systems including, screw press separation, dissolved air floatation, centrifuging, and solid treatment systems including bedding recovery units and pelletization. We are working with a farm that has an anaerobic digester and screw press separators. They have been planning to install a Dissolved Air Flotation (DAF) system. The farm was approached with an in-vessel composting technology “active composting” to determine if it could effectively convert portions of the digested separated liquid flow to a stabilized solid that could be pelletized and exported, while the liquids could be further treated to become dilute enough to be spray irrigated on a limited acreage.
What Have We Learned?
We learned that although the active composting process was able to quickly produce stabilized high solid content material from a variety of mixes of digested separated liquid and dried shavings, the energy needed ranged from $9 to $14 per cow per day. Through volume/time calculations, the pumping system from the reception pit to the digester and the post digestion pit to the separators varied although the % solids were consistent. Doppler flow meters purported to be able to measure manure did not give consistent volume results. Screw press solid liquid separation can result in a bedding product with relatively low moisture (60%) from anaerobically digested dairy manure. Determining an optimum manure treatment system for dairy manure will be difficult given the variability from farm to farm.
Future Plans
Specific treatments yet to be evaluated include: anaerobic sequencing batch reactors, solid liquid separation systems including dissolved air floatation (DAF), centrifuging, and solid treatment systems including bedding recovery units (BRU) and pelletization. Covid supply chain issues and travel restrictions have slowed progress. The DAF system can be directly analyzed as it is installed on the dairy. A neighboring farm has a BRU that will be sampled and analyzed. Data from a centrifuge and pelletizer will be obtained from the literature. Putting the process in a treatment train will be explored on a spreadsheet.
Authors
Peter Wright, Agricultural Engineer, PRO-DAIRY, Cornell University
Publications: Peter Wright, Karl Czymmek, and Tim Terry “Food waste coming to your farm? Consider where the nutrients go and manure processing for nutrient export” PRO-DAIRY The Manager, contained in Progressive Dairy Vol. 35 No. 5 March 12, 2021
Acknowledgements
This work was supported by a joint research and extension program funded by the Cornell University Agricultural Experiment Station (Hatch funds) and Cornell Cooperative Extension (Smith Lever funds) received from the National Institutes for Food and Agriculture (NIFA,) U.S. Department of Agriculture. Any opinions, findings, conclusions, or recommendations expressed in this publication are those of the author(s) and do not necessarily reflect the view of the U.S. Department of Agriculture. New York State Pollution Prevention Institute (NYSP2I) at the Golisano Institute for Sustainability (GIS) paid for the sampling that was funded by a grant to RIT from by the Environmental Protection Fund as administered by the NYS Department of Environmental Conservation.
The authors are solely responsible for the content of these proceedings. The technical information does not necessarily reflect the official position of the sponsoring agencies or institutions represented by planning committee members, and inclusion and distribution herein does not constitute an endorsement of views expressed by the same. Printed materials included herein are not refereed publications. Citations should appear as follows. EXAMPLE: Authors. 2022. Title of presentation. Waste to Worth. Oregon, OH. April 18-22, 2022. URL of this page. Accessed on: today’s date.
With high input costs in 2022, many farmers are looking for affordable sources of nutrients. Poultry litter is in high abundance in areas of intense poultry production, such as North Carolina. However, a common concern for farmers is whether poultry litter will carry weed seed onto their farms. With the need to better distribute nutrients throughout these areas, the transport of poultry litter is necessary. Overcoming the concern about weed seeds is critical to improve these nutrient imbalances. Therefore, a germination study was conducted on 61 random poultry litters collected across North Carolina to determine the presence of viable weed seeds.
What Did We Do?
A series of 61 poultry litters were submitted to NC State University for testing, collected from industry representatives and Extension Agents across the state. Poultry litters were diluted with potting media to allow for germination of any existing weed seeds at a 9:1 (potting media:litter) ratio on a dry weight basis. Germination studies were then conducted using 20 g of the potting media-litter mix, replicated 5 times. Positive controls included potting media alone, and potting media mixed with poultry litter to verify there was no inhibitory effect of the poultry litter on germination. Both positive controls were spiked with one of three weed species at varying rates: 50 mustard, 50 rye, or 30 sicklepod. Additionally, three subsamples (20 g) of 10 of the poultry litters were wet sieved using three sieves with 2.8-, 1.0-, and 0.4-mm mesh sizes and dried at 35 °C. Seeds were counted under a dissecting microscope, and when located, seeds were removed and tested for viability using the imbibed seed crush test as described by Borza et al. (2007).
What Have We Learned?
Germination studies suggest small numbers of viable weed seeds, as only one seed germinated from unspiked samples. However, total weed counts suggest there can be high total seed numbers in the litters, with an average seed content of 1.17 seeds/100-g. Additionally, approximately 15% of the seeds collected were viable.
Future Plans
We intend to continue researching this topic and hope to further understand the impact of stockpiling, litter management, and handling on viable weed seeds in litter sources.
Authors
Stephanie B. Kulesza, Nutrient Management and Animal Waste Specialist, NC State University
Corresponding author email address
Sbkulesz@ncsu.edu
Additional authors
Ramon Leon, Weed Biology and Ecology Specialist, NC State University
Miguel Castillo, Forage Specialist, NC State University
Stephanie Sosinski, Forage Lab Technician, NC State University
The authors are solely responsible for the content of these proceedings. The technical information does not necessarily reflect the official position of the sponsoring agencies or institutions represented by planning committee members, and inclusion and distribution herein does not constitute an endorsement of views expressed by the same. Printed materials included herein are not refereed publications. Citations should appear as follows. EXAMPLE: Authors. 2022. Title of presentation. Waste to Worth. Oregon, OH. April 18-22, 2022. URL of this page. Accessed on: today’s date.
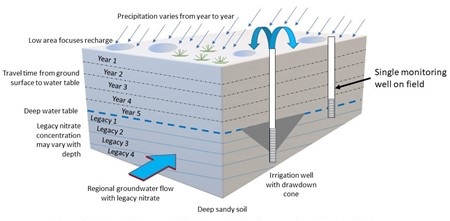
Typical groundwater monitoring for nitrate concentrations in single monitoring wells and monitoring- well networks cannot always correctly explain the nitrate distribution in groundwater at the field level. Nitrate can originate from various sources (e.g., chemical fertilizers, manure, etc.) and at various times (e.g., current practice versus legacy nitrate). Nitrate in groundwater can also vary spatially, temporally, and with groundwater flow direction. Figure 1 illustrates some of the causes of spatial and temporal nitrate variations at the field level related to water and dissolved nitrate movement. Figure 2 is one example of how complex geology (e.g., stream meanders) can affect, and complicate, groundwater and nitrate movement.
Figure 1. Factors that can contribute to spatial and temporal variations in nitrate in groundwater at the field level (with permission from the Journal of Nutrient Management).Figure 2. Common example of a complex hydrogeology that can affect groundwater flow and nitrate concentrations at the field level.
This presentation discusses a case study where we used high resolution and advanced methods to help identify the source(s) of nitrate in groundwater at the field level. These approaches can help in permitting and other issues that center around the reporting of elevated nitrate concentrations in groundwater.
What Did We Do?
This case study involves the “upgradient” monitoring well (MW-D) in a “simple,” sandy, water table aquifer at a commercial dairy. The regulators initially considered the nitrate concentration observed at the upgradient monitoring well, MW-D in Figure 3, which was well below the drinking water criterion of 10 milligrams per liter (mg/L) to be representative of the regional groundwater (background) entering the site. However, the literature indicated the regional groundwater already contained very high nitrate concentrations that originated over many decades of chemical fertilizer applications (“legacy nitrate”). We used both high resolution and advanced approaches to unravel the cause of the anomalous nitrate concentration in groundwater at “upgradient” monitoring well MW-D so we could help negotiate an appropriate and reasonable background nitrate concentration for the dairy’s permit.
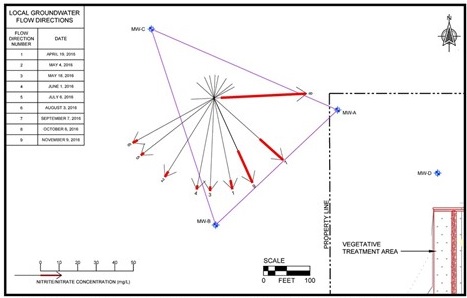
Figure 3. Case study – unraveling changes in local groundwater flow directions and nitrate concentrations using continuous groundwater level monitoring.
First, we suspected that MW-D, which is located close to the vegetative treatment area (VTA), was not a representative well for groundwater quality due to large, episodic recharge events caused by ponding on the VTA. To test this hypothesis, we installed three monitoring wells just upgradient from MW-D (MW-A, -B, and -C in Figure 3), equipped all four monitoring wells with water-level data loggers, and used these data to calculate continuous groundwater flow direction changes with time. Monitoring wells MW-A, -B, -C, and –D are screened between 28-38, 28-38, 26-36, and 22-32 feet below ground level, respectively, to monitor the water table. The groundwater elevation data and monthly nitrate monitoring (Figure 3) indicated (1) the water table fluctuated significantly and episodically in response to precipitation and ponding on the VTA, (2) the groundwater flow direction changed significantly when ponding occurred (so what is “upgradient”?), and (3) the nitrate concentration changed at upgradient monitoring well MW-A from more than 40 mg/L when regional groundwater flowed onto the site to about 2 mg/L when ponding caused an episodic reversal of the groundwater flow direction.
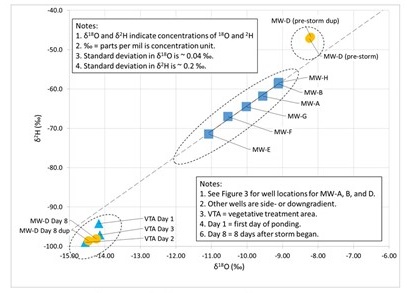
Second, we tested groundwater from selected monitoring wells and ponded water on the VTA for natural isotopes in water molecules (18O and 2H). The water table monitoring wells were screened across the water table with top of screen tops ranging between 22 and 50 feet below ground level, depending on ground elevation. Two of the monitoring wells were deep wells with screen depths of 80 to 85 and 52 to 57 feet below ground level. The 18O and 2H concentrations in precipitation vary with temperature and therefore can vary from storm to storm and season to season. Groundwater acquires a “uniform” 18O and 2H signature which approximates the weighted average of the precipitation over the year(s) and therefore, can be different from that of an individual storm. Figure 4 shows that the 18O and 2H signature of groundwater at the presumptive background well (MW-D) changed from its groundwater signature before the storm to the signature of the ponded water in the VTA, due to a large spring storm that caused flooding on the VTA. The changes in 18O and 2H in groundwater at MW-D are consistent with the rapid groundwater mounding at MW-D. Furthermore, the low nitrate concentration in groundwater at MW-D was consistent with the low nitrate concentration observed in the ponded water on the VTA; the ponded water on the VTA diluted the legacy nitrate from the regional groundwater.
Figure 4. Case study – unraveling changes in groundwater nitrate concentrations due to episodic groundwater mounding using water isotopes.
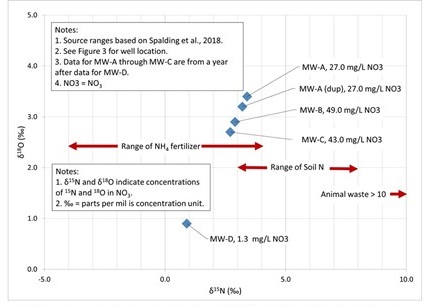
Finally, we tested nitrate (NO3) ions in the groundwater for their 15N and 18O signatures. Nitrate isotopes have been used to distinguish between nitrate sources, such as chemical fertilizer and manure, for more than 20 years. Figure 5 shows the chemical and manure nitrate source fields based on nitrate isotopes. The groundwater at monitoring wells MW-A through MW-C had both isotopic signatures indicative of chemical fertilizer (legacy nitrate) and elevated nitrate concentrations consistent with those reported for the regional groundwater.
Figure 5. Case study – unraveling the source of legacy nitrate using nitrate isotopes.
What Have We Learned?
For this case study, we needed to demonstrate that the presumptive background monitoring well nitrate was not truly representative of background groundwater nitrate and explain why. Otherwise, the dairy would have been encumbered by an unfairly low background concentration in its permit. Data from typical groundwater monitoring well networks and monitoring plans may not be sufficient for either of these requirements.
High resolution and advanced monitoring approaches, such as using data loggers for continuous water level monitoring and groundwater flow maps and isotopic tracers for sourcing water and nitrate, have been around for decades. Using these approaches to unravel puzzling agricultural problems can be very helpful.
Future Plans
We will continue to use these and other high resolution and advanced investigative techniques, honed in the field of contaminant hydrogeology, to solve agricultural surface water and groundwater issues.
Authors
Michael Sklash, Ph.D., Senior Hydrogeologist, Dragun Corporation, Farmington Hills, MI. Msklash@dragun.com
Additional author
Fatemeh Vakili, Ph.D., Hydrogeologist, Dragun Corporation, Windsor, ON
Additional Information
See Journal of Nutrient Management, 2020 and 2021
The authors are solely responsible for the content of these proceedings. The technical information does not necessarily reflect the official position of the sponsoring agencies or institutions represented by planning committee members, and inclusion and distribution herein does not constitute an endorsement of views expressed by the same. Printed materials included herein are not refereed publications. Citations should appear as follows. EXAMPLE: Authors. 2022. Title of presentation. Waste to Worth. Oregon, OH. April 18-22, 2022. URL of this page. Accessed on: today’s date.
Feed costs are typically one of the largest costs of dairy and beef cattle production. Grazing is an option that can greatly reduce the need for, and cost of, hay production. The addition of legumes into the pasture can reduce the need for additional fertilizer.Unfortunately, grazing can also accelerate nutrient cycling and increase nitrogen (N) leaching. This study examines the effect of adding birdsfoot trefoil (Lotus corniculatus L.), a legume with condensed tannins (CT), to the grazing system. Condensed tannins are noted for their ability to improve nutrient utilization and shift N excretion from the urine to the feces. Nutrient cycling under the grass-legume mixtures and grass monocultures were evaluated. The nitrogen content in urine and feces of cattle grazing forages with, and without CT, was also examined and compared to a traditional total mixed ration (TMR) diet.
What Did We Do?
Four grasses, tall fescue (Schedonorus arundinaceus Schreb.), meadow bromegrass (Bromus biebersteinii Roem. & Schult.), orchardgrass (Dactylis glomerata L.), and perennial ryegrass (Lolium perenne L.) in monocultures, and in binary mixtures with birdsfoot trefoil (Lotus corniculatus L.) were evaluated. The study was conducted at the Utah State University Intermountain Irrigated Pasture facility in Lewiston, Utah. Jersey dairy heifers (~450 lbs) were used to rotationally graze the paddocks with heifers being moved to a new paddock every seven days for a 35-day rotation cycle. Pastures were irrigated every two weeks. All pastures were fertilized with Chilean nitrate (25 lbs N/acre) in April. Grass monocultures also received Feathermeal (31 lbs N/acre) in the late spring/early summer, and an additional dose of Chilean nitrate (25 lbs N/acre) in July. Body weight, and urine and fecal (grab) samples were collected before each grazing event, and at the end of the grazing season. Urine samples were analyzed for urea-N on a Lachat FIA analyzer. Fecal samples were analyzed for total N and total carbon by combustion analysis using an Elementar varioMAX CN elemental analyzer, and ammonia-N on a FIAlab 2500 instrument. Soil samples were collected at the beginning and end of each grazing season, and analyzed for available N (nitrate and ammonia) on a Lachat FIA analyzer. Soil water (leachate) N was monitored by means of zero-tension lysimeters bi-weekly during the growing season, and as much as possible in the spring and fall. Leachate samples were analyzed for nitrate-nitrite concentration on a Lachat FIA analyzer. The amount of leachate produced from each lysimeter was measured, and total Leachate N determined. Forage protein levels were determined using NIR. Nutrient cycling in the urine and feces were analyzed and compared to the overall protein levels in the forage.
What Have We Learned?
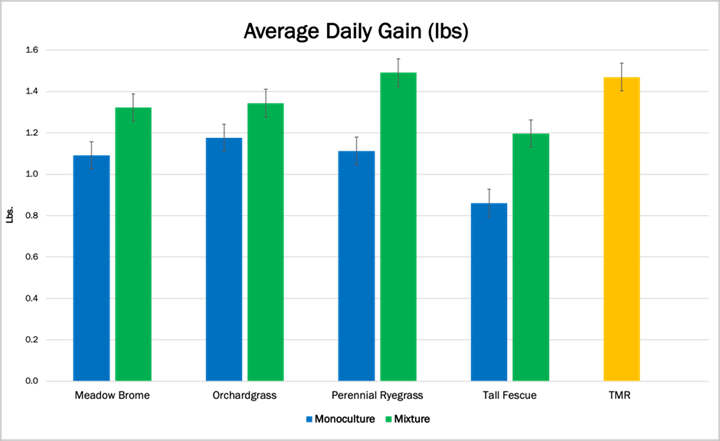
Average daily gains were greater with the grass-legume mixtures than the monocultures (Figure 1). This is most likely due to the higher protein content of the grass-legume mixtures versus the grass monocultures (data not shown).
Figure 1. Average Daily Gain under grass-legume mixtures versus grass monocultures versus a total mixed ration in a feedlot setting
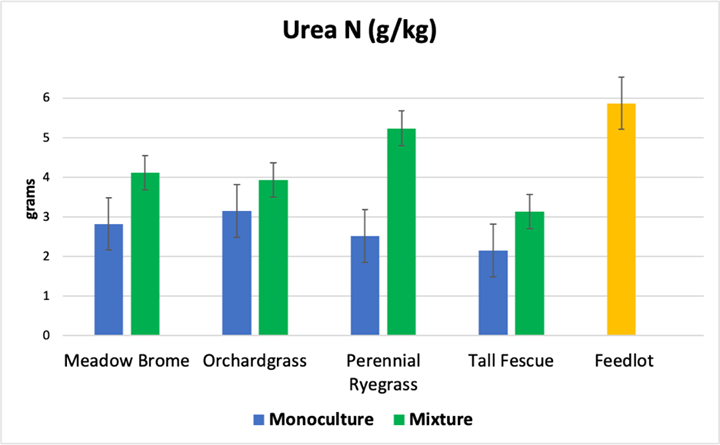
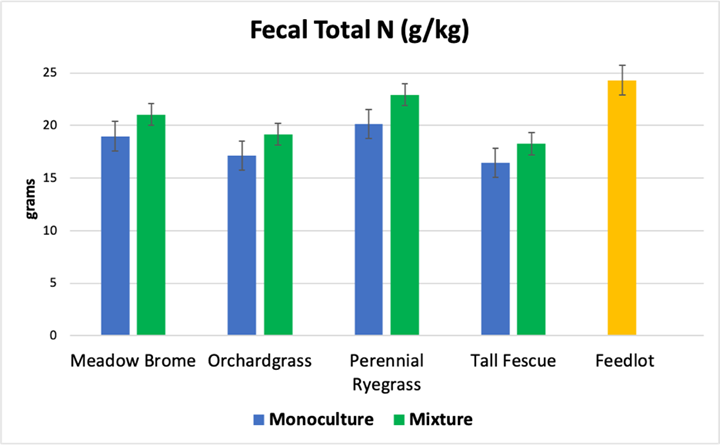
Both the urea-N concentration in the urine (Figure 2), and the fecal N content (Figure 3) were higher in the grass-legume mixtures than the grass monocultures. This is most likely the result of being fed a higher protein content diet in the grass-legume mixtures.
Figure 2. Urea-N content in urine when grazing grass-legume mixtures versus grass monocultures versus a total mixed ration in a feedlot settingFigure 3. Fecal Total N content when grazing grass-legume mixtures versus grass monocultures versus a total mixed ration in a feedlot setting
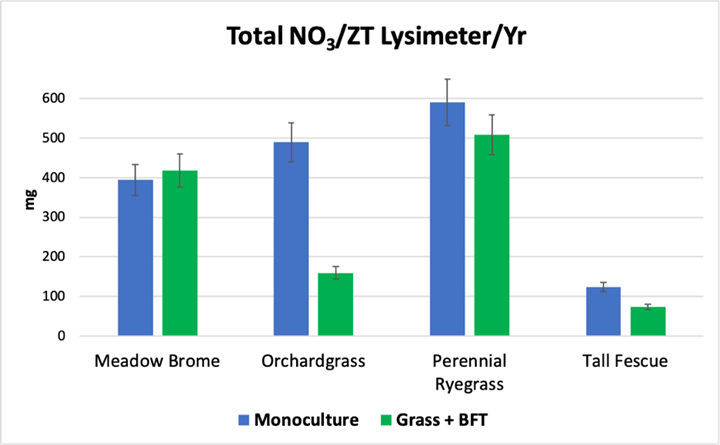
Although the grass monocultures were not heavily fertilized, and the protein content of the monocultures was lower than that of the grass-legume mixtures, nitrogen leaching observed in the leachate was generally higher under the grass monocultures.
Figure 4. Total NO3 lost in leachate per zero-tension lysimeter per year
Grass-legume mixtures may be able to more effectively capture nitrogen due to the differences in the rooting structure and the microbial populations. The grass-legume mixtures were also better economically.
Future Plans
The forage type explains approximately 40% of the variability. We plan to examine the impact of breed on the rates of gain and nutrient cycling next.
Authors
Rhonda Miller, Ph.D., Agricultural Environmental Quality Extension Specialist, Utah State University
Corresponding author email address
rhonda.miller@usu.edu
Additional authors
Blair Waldron, ARS Forage & Range Research Lab; Clay Isom, Utah State University; Kara Thornton – Kurth, Utah State University; Kerry Rood, Utah State University; Earl Creech, Utah State University; Mike Peel, ARS Forage & Range Research Lab; Jacob Hadfield, Utah State University; Ryan Larson, Utah State University, and Marcus Rose, Bureau Land Management
Additional Information
Hadfield, J., B. Waldron, S. Isom, R. Feuz, R. Larsen, J. Creech, M. Rose, J. Long, M. Peel, R. Miller, K. Rood, A. Young, R. Stott, A. Sweat, and K. Thornton. 2021. The effects of organic grass and grass-birdsfoot trefoil pastures on Jersey heifer development: Heifer growth, performance, and economic impact. J. Dairy Sci. 104(10): 10863-10878. DOI: 10.3168/jds.2020-19524.
Rose, M., B. Waldron, S. Isom, M. Peel, K. Thornton, R. Miller, K. Rood, J. Hadfield, J. Long, B. Henderson, and J. Creech. 2021. The effects of organic grass and grass-birdsfoot trefoil pastures on Jersey heifer development: Herbage characteristics affecting intake. J. Dairy Sci. 104(10): 10879-10895. DOI: 10.3168/jds.2020-19563.
Acknowledgements
Funding for this project was provided by OREI, Western SARE, and Utah State University Experiment Station.
The authors are solely responsible for the content of these proceedings. The technical information does not necessarily reflect the official position of the sponsoring agencies or institutions represented by planning committee members, and inclusion and distribution herein does not constitute an endorsement of views expressed by the same. Printed materials included herein are not refereed publications. Citations should appear as follows. EXAMPLE: Authors. 2022. Title of presentation. Waste to Worth. Oregon, OH. April 18-22, 2022. URL of this page. Accessed on: today’s date.
Manage Cookie Consent
To provide the best experiences, we use technologies like cookies to store and/or access device information. Consenting to these technologies will allow us to process data such as browsing behavior or unique IDs on this site. Not consenting or withdrawing consent, may adversely affect certain features and functions.
Functional
Always active
The technical storage or access is strictly necessary for the legitimate purpose of enabling the use of a specific service explicitly requested by the subscriber or user, or for the sole purpose of carrying out the transmission of a communication over an electronic communications network.
Preferences
The technical storage or access is necessary for the legitimate purpose of storing preferences that are not requested by the subscriber or user.
Statistics
The technical storage or access that is used exclusively for statistical purposes.The technical storage or access that is used exclusively for anonymous statistical purposes. Without a subpoena, voluntary compliance on the part of your Internet Service Provider, or additional records from a third party, information stored or retrieved for this purpose alone cannot usually be used to identify you.
Marketing
The technical storage or access is required to create user profiles to send advertising, or to track the user on a website or across several websites for similar marketing purposes.

 Germination studies suggest small numbers of viable weed seeds, as only one seed germinated from unspiked samples. However, total weed counts suggest there can be high total seed numbers in the litters, with an average seed content of 1.17 seeds/100-g. Additionally, approximately 15% of the seeds collected were viable.