Purpose
Distillers grains (DGs) have been heavily researched as a diet additive for cattle since the early 2000s. Research has considered the nutritional value, optimization, and even how it impacts odors and greenhouse gases emitted from the surface of the pens that house cattle fed these diets. However, no work has been conducted to determine if there are changes in pen surface material properties after exposure to manure from diets containing DGs. Recent conversations with producers highlighted changes in pen surface characteristics such as significant loss in material and inability to maintain mounds in the pen. after DGs were fed for prolonged periods. Research has shown that manure from distillers diets contain excess proteins which we hypothesized could cause interruptions in soil particle interactions thus leading to a loss in integrity of the pen surface. The purpose of this work was to investigate if excess excreted protein in urine was the cause of changes in the properties of pen surface material.
What Did We Do?
This work was comprised of a large-scale study at a feedlot and a lab-scale study. In the feedlot study, cattle were fed either control (no DGs), wet DGs (40%) or dry DGs (40%) for 180 days. Once cattle were finished and removed from their pens, pen surface material (PSM) was collected from 4 general locations within each pen: behind the apron, on top of the mound, the side of the mound and the bottom of the pen. Samples from each pen with the same treatment were pooled into one single composite to represent each of the treatments. Samples were divided into two sets and analyzed by a commercial laboratory as either soil or manure. Soil analysis included pH, soluble salts, organic matter, nitrate nitrogen, potassium, sulfate, zinc, copper, calcium, sum of cations, % saturation of calcium and magnesium, and Mehlich-III phosphorus. Manure analysis included organic nitrogen, ammonium nitrogen, nitrate, phosphorus, potassium, sulfur, calcium, magnesium, sodium, zinc, iron, manganese, copper, boron, soluble salts pH, and moisture
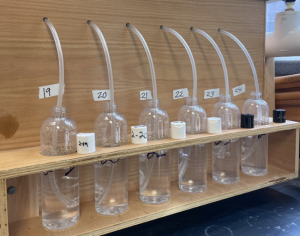
For the lab-scale study, PSM was collected from a feedlot that does not feed DGs. Material was dried, ground, and sieved. Synthetic urine was added daily to bottles containing 300 g of PSM for 3 weeks to simulate prolonged addition of urine to feedlot pen surface. Samples were then shaken for 30 minutes and left at room temperature unsealed overnight. Synthetic urine contained either 0, 8, 16, or 32% additional protein. At the end of the study, samples were dried and sent to a commercial lab to be tested as soil in which the same properties listed above were again reported.
What Have We Learned?
In the feedlot study, differences (p < 0.05) in soluble salts were observed between all three treatments. Differences (p<0.05) were observed between the control and DGs diets for soluble salts, organic matter, potassium, sulfate, magnesium saturation, Mehlich P, pH, ammonium nitrogen, organic N, total N, phosphate, total phosphorus, and sulfur.
For the lab-scale study, properties in which differences (p<0.05) were measured between the control and treatments include: nitrate N, cation exchange capacity, magnesium, sodium, zinc, calcium saturation and magnesium saturation. Analysis which resulted in differences (p < 0.05) between control and all three added protein treatments include Mehlich P, potassium, calcium, and copper. No significant differences were determined between the control and the treatments for zeta potential and conductivity. Results of the feedlot study compared to the lab scale study suggest that changes in PSM are not solely caused by excess soluble protein excretion.
Future Plans
The lab scale study will be used to determine if fiber has any contribution to the observed changes in PSM properties. The results of this study will help us determine how best to manage feedlot pens when varying forms and concentrations of DGs are fed to the cattle. It may also provide insight into potential pen surface amendments that may be used to mitigate the negative effects of feeding DGs to cattle.
Authors
Corresponding author
Bobbi Stromer, Research Chemist, US Meat Animal Research Center, Bobbi.stromer@usda.gov
Additional authors
Mindy Spiehs, Research Nutritionist, US Meat Animal Research Center
Bryan Woodbury, Research Engineer, US Meat Animal Research Center
Additional Information
USDA is an equal opportunity provider and employer
Acknowledgements
The authors wish to thank Victor Gaunt for assistance with data collection.
The authors are solely responsible for the content of these proceedings. The technical information does not necessarily reflect the official position of the sponsoring agencies or institutions represented by planning committee members, and inclusion and distribution herein does not constitute an endorsement of views expressed by the same. Printed materials included herein are not refereed publications. Citations should appear as follows. EXAMPLE: Authors. 2025. Title of presentation. Waste to Worth. Boise, ID. April 7–11, 2025. URL of this page. Accessed on: today’s date.
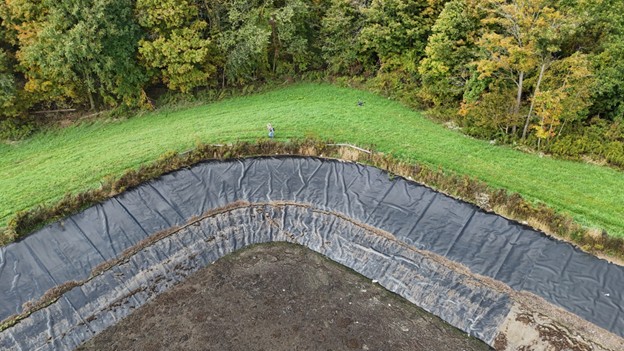
 We are developing a ground-based, mobile measurement approach where manure storage systems are circled with a backpack methane gas analyzer and measurements are integrated with on-site wind measurements to calculate emission flux rates. Twelve commercial dairy farm manure storage systems, representing a range of herd sizes and pre-storage manure treatments are collaborating on the research. Once per month, each manure storage structure at each site is circled 10 consecutive times with a methane gas analyzer. A drone equipped with a separate methane analyzer is also used to verify ground-based measurements amidst the methane plumes. Divergence (Gauss’s) theorem is then applied to concentration measurements and anemometer wind data to estimate the net rate of methane flux. These observed methane emission fluxes are compared to International Panel of Climate Change (IPCC) modeled emissions as well as state inventories.
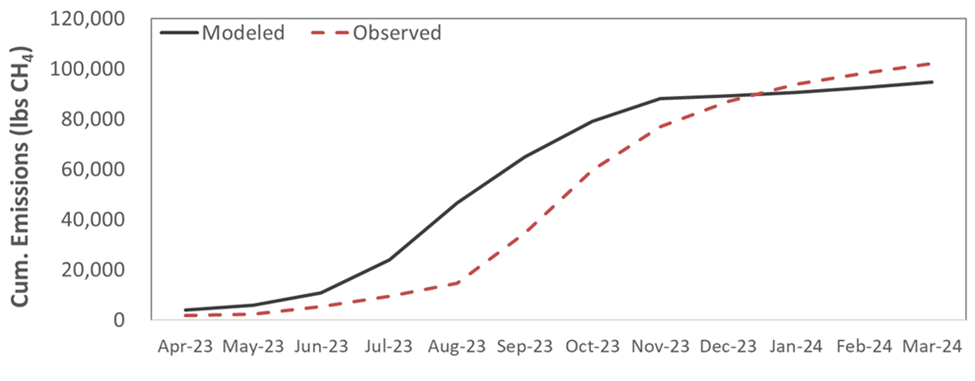
 We find that this methodology provides a reliable, cost-effective way to estimate methane emissions from manure storages. Observed emissions track modeled emissions with similar magnitudes, though models may be overestimating emissions during the growing season and underestimating during the winter months in this region (Figure 1). While emissions patterns are generally similar for each of the farm sites, with some farms and some individual monthly observational estimates there can be substantial deviation from predicted emission rates.