
Environmental Footprints of Beef Production in the Kansas, Oklahoma and Texas Region

Why Look at the Environmental Footprint of Livestock?

Both producers and consumers of animal products have concern for the environmental sustainability of production systems. Added to these concerns is the need to increase production to meet the demand of a growing population worldwide with an increasing desire for high quality protein. A procedure has been developed (Rotz et al., 2013) that is now being implemented by the U.S. beef industry in a comprehensive national assessment of the sustainability of beef. The first of seven regions to be analyzed consisted of Kansas, Oklahoma and Texas.

What did we do? 

A survey and visits of ranch and feedyard operations throughout the three state region provided data on common production practices. From these data, representative ranch and feedyard operations were defined and simulated for the climate and soil conditions throughout the region using the Integrated Farm System Model (USDA-ARS, 2014). These simulations predicted environmental impacts of each operation including farm-gate carbon, energy, water and reactive nitrogen footprints. Individual ranch and feedyard operations were linked to form 28 representative cattle production systems. A weighted average of the production systems was used to determine the environmental footprints for the region where weighting factors were determined based upon animal numbers obtained from national agricultural statistics and survey data. Along with the traditional beef production systems, Holstein steers and cull animals from the dairy industry in the region were a lso included.

What have we learned?             

The carbon footprint of beef produced was 18.4 ± 1.7 kg CO2e/kg carcass weight (CW) with the range in individual production systems being 13.0 to 25.4 kg CO2e/kg CW. Footprints for fossil energy use, non precipitation water use, and reactive nitrogen loss were 51 ± 4.8 MJ/kg CW, 2450 ± 450 liters/kg CW and 138 ± 12 g N/kg CW, respectively. The major portion of the carbon, energy and reactive nitrogen footprints was associated with the cow-calf phase of production (Figure 1).

Beef footprints

Beef footprints

Future Plans   

Further analyses are planned for the remaining six regions of the U.S. which will be combined to provide a national assessment. Cattle production data will be combined with processing, marketing and consumer data to complete a comprehensive life cycle assessment of beef production and use.

Authors       

C. Alan Rotz, Agricultural Engineer, USDA-ARS al.rotz@ars.usda.gov

Senorpe Asem-Hiablie and Kim Stackhouse-Lawson

Additional information                

Rotz, C. A., B. J. Isenberg, K. R. Stackhouse-Lawson, and J. Pollak. 2013. A simulation-based approach for evaluating and comparing the environmental footprints of beef production systems. J. Anim. Sci. 91:5427-5437.

USDA-ARS. 2014. Integrated Farm System Model. Pasture Systems and Watershed Mgt. Res. Unit, University Park, PA. Available at: http://www.ars.usda.gov/Main/docs.htm?docid=8519. Accessed 5 January, 2015.

Acknowledgements    

This work was partially supported by the Beef Checkoff.

The authors are solely responsible for the content of these proceedings. The technical information does not necessarily reflect the official position of the sponsoring agencies or institutions represented by planning committee members, and inclusion and distribution herein does not constitute an endorsement of views expressed by the same. Printed materials included herein are not refereed publications. Citations should appear as follows. EXAMPLE: Authors. 2015. Title of presentation. Waste to Worth: Spreading Science and Solutions. Seattle, WA. March 31-April 3, 2015. URL of this page. Accessed on: today’s date.


Ammonia and Nitrous Oxide Model for Open Lot Cattle Production Systems

Purpose 

Air emissions, such as ammonia (NH3) and nitrous oxide (N2O), vary considerably among beef and dairy open lot operations as influenced by the climate and manure pack conditions. Because of the challenges with direct measurements, process-based modeling is a recommended approach for estimating air emissions from animal feeding operations. The Integrated Farm Systems Model (IFSM; USDA-ARS, 2014), a whole-farm simulation model for crop, dairy and beef operations, was previously expanded (version 4.0) to simulate NH3 emissions from open lots. The model performed well in representing emissions for two beef cattle feedyards in Texas (Waldrip et al., 2014) but performed poorly in predicting NH3 emissions measured at an open lot dairy in Idaho.

What did we do? 

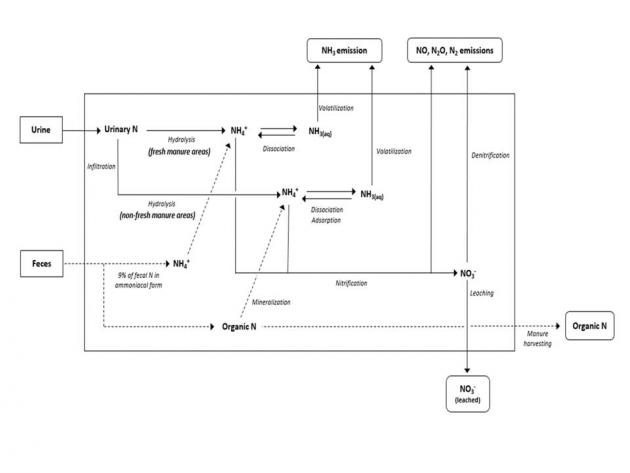
The open lot nitrogen routine of IFSM was revised to better represent the effects of climate on lot and manure pack conditions. Processes affecting the formation and emission of NH3 and N2O from open lots were revised and better integrated. These processes included urea hydrolysis, surface infiltration, ammonium-ammonia association/dissociation, ammonium sorption, NH3 volatilization, nitrification, denitrification, and nitrate leaching (Figure 1). The soil water model in IFSM was also modified and used to represent an open lot. The accuracy of the revised model (version 4.1) was evaluated using measurements from two beef cattle feedyards in Texas (Todd et al., 2011; Waldrip et al., 2014) and an open lot dairy in Idaho (Leytem et al., 2011). Comparing the two regions, Idaho typically has much drier conditions in summer and wetter conditions in winter.

Lot model

Figure 1. The revised Integrated Farm Systems Model (IFSM)

What have we learned? 

The revised model predicted NH3 emissions for the Texas beef cattle feedyards similar to the previous version with model predictions having 59 to 81% agreement with measured daily emissions. Simulated NH3 emissions for the Idaho open lot dairy improved substantially with 56% agreement between predicted and measured daily NH3 emissions. For the Idaho open lot dairy, IFSM also predicted daily N2O emissions with 80% agreement to those measured. These results support that IFSM can predict NH3 and N2O emissions from open lots as influenced by climate and lot conditions. Therefore, IFSM provides a useful tool for estimating open lot emissions of NH3 and N2O along with other aspects of performance, environmental impact and economics of cattle feeding operations in different climate regions, and for evaluating management strategies to mitigate emissions.

Future Plans    

The revised IFSM is being used to study nitrogen losses and whole farm nutrient balances of open lot feed yards and dairies. The environmental benefits and economic costs of mitigation strategies will be evaluated to determine best management practices for these production systems.

Authors      

C. Alan Rotz, Agricultural Engineer, USDA-ARS al.rotz@ars.usda.gov

Henry F. Bonifacio, April B. Leytem, Heidi M. Waldrip, Richard W. Todd

Additional information 

Leytem, A.B., R.S. Dungan, D.L. Bjorneberg, and A.C. Koehn. 2011. Emissions of ammonia, methane, carbon dioxide, and nitrous oxide from dairy cattle housing and manure management systems. J. Environ. Qual. 40:1383-1394.

Todd, R.W., N.A. Cole, M.B. Rhoades, D.B. Parker, and K.D. Casey. 2011. Daily, monthly, seasonal and annual ammonia emissions from Southern High Plains cattle feedyards. J. Environ. Qual. 40:1-6.

USDA-ARS. 2014. Integrated Farm System Model. Pasture Systems and Watershed Mgt. Res. Unit, University Park, PA. Available at: http://www.ars.usda.gov/Main/docs.htm?docid=8519. Accessed 5 January, 2015.

Waldrip, H.M., C.A. Rotz, S.D. Hafner, R.W. Todd, and N.A. Cole. 2014. Process-based modeling of ammonia emissions from beef cattle feedyards with the Integrated Farm System Model. J. Environ. Qual. 43:1159-1168.

Acknowledgements      

This research was funded in part by the United Dairymen of Idaho. Cooperation of the dairy and beef producers is also acknowledged and appreciated.

The authors are solely responsible for the content of these proceedings. The technical information does not necessarily reflect the official position of the sponsoring agencies or institutions represented by planning committee members, and inclusion and distribution herein does not constitute an endorsement of views expressed by the same. Printed materials included herein are not refereed publications. Citations should appear as follows. EXAMPLE: Authors. 2015. Title of presentation. Waste to Worth: Spreading Science and Solutions. Seattle, WA. March 31-April 3, 2015. URL of this page. Accessed on: today’s date.
 

Improving Estimation of Enteric Methane Emissions from Dairy and Beef Cattle: A Meta-Analysis


Purpose

The enteric methane emissions from dairy and beef cattle are considered as a major contributor of greenhouse gases emissions in U.S. Since enteric methane emission represents an unproductive loss of dietary energy, one of the predominant methane emission estimation procedures are driven by first estimating daily gross energy intake (GEI) by individual animals and then multiplying it by an estimate of “methane conversion factor (Ym)”, which is in the range of 4–10% of GEI. The IPCC Tier 2 enteric methane emission estimation procedures are driven by first estimating daily and annual gross energy consumption by individual animals within an inventory class which are then multiplied by an estimate of CH4 loss per unit of feed (Ym). The extent to which feed energy is converted to CH4 depends on several interacting feed and animal factors. It is important to examine the influences of feed properties and animal attributes on Ym. Such influences are important to better understand the microbiological mechanisms involved in methanogenesis with a view to designing emission abatement strategies, as well as to identify different values for Ym according to animal husbandry practices. The search for influences of feed properties and animal attributes on Ym is not sufficiently documented and sometimes equivocal. There is considerable room for improvement in the IPCC Tier 2 prediction in Ym. As more data are collected, a meta-analysis may better determine the influential variables. The objective of this study was to conduct a systematic literature review and meta-analysis in order to identify and quantify the sources of the variability and uncertainty in reported Ym values, and in particular the influence of feed and animal properties upon Y

What did we do?

Multiple strategies were undertaken to identify potentially eligible studies to be included in the meta-analysis. The inclusion criteria were: the study must have reported measured CH4 emission data which can be expressed in the form of Ym; and the study must be published in a peer reviewed journal in English. The selected studies were distributed to a group of trained analysts for data extraction. Standard data extraction sheets were developed for consistency. As a result of the data review and extraction processes, a meta-analysis dataset was created. The dataset for the meta-analysis included all control treatment means at various common feed and animal combinations. Some studies provided treatment means at different conditions; in these cases, more than one treatment means (data points) were extracted from one study. Treatment means for special feed additive treatments were not included. Data across studies were analyzed statistically using the MIXED procedures of SAS (SAS for Windows, Version 9.3, SAS Institute, Cary, NC). Model development was conducted in a meta-analytical manner by treating study effect as random. The numbers of animals contributing to each treatment mean were used as a weighting variable. Various processes were used to test for confounding terms. Significant effects were declared at P < 0.05.

What have we learned?

The literature search efforts yielded a total of 75 peer reviewed studies that provided measured enteric CH4 emissions from beef or dairy cattle operations, which were expressed as Ym. These studies included 184 treatment means at various animal and feed combinations.The CH4 emission rates expressed in g/animal/day were positively related with weight of animal (P<0.01), and they showed a bimodal distribution, which could be due to the weight difference between dairy and beef cattle. The CH4 emission rates expressed in Ym, or g/kg DMI were more close to have a normal distribution, and they have much less variation compared with CH4 emission rates expressed in g/animal/day. The Ym values were significantly affected by feeding style (grazing vs. housed, P<0.01) and cattle type (dairy vs. beef, P<0.01), and an interaction of feeding style and cattle type was observed (P<0.01). The Ym for beef had large variation than the Ym for dairy cattle. Grazing beef had the largest mean value of Ym. For housed cattle, no significant difference was observed between beef and dairy (P=0.54).Forage content in diet significantly affect the Ym values (P<0.01), while effect of geography region was not significant at 0.05 level (P=0.06). For grazing cattle, significant higher Ym was observed for beef cattle as compared to dairy cattle (7.9% vs. 6.1%, P=0.02). The effect of diet forage content on Ym could be explained by the feed digestibility. It was found Ym was negatively related with the general energy intake (GEI) of cattle per kg of body weight (P<0.01), or the OM digestibility of feed (P=0.01). The higher the OM digestibility of feed, the higher GEI per kg of body weight, and the lower the Ym value. The OM digestibility of feed and the GEI per kg of body weight were positively related with each other and may not be independent. When both of them were included in the model of Ym, only the OM digestibility of feed was significant. A model was obtained for estimating Ym from the OM digestibility of feed. The reported fat content in diet ranged from 18 to 64 g per kg of dry matter. The Ym value was negatively related with the fat content in diet. Although the effect was not statistically significant in this meta-analysis (P=0.31), it confirmed the hypothesis that increasing fat content in diet can potentially result in reduced CH4 emission. The effect of lactation status on Ym was examined for dairy cattle, including both grazing and housed animals. Lactating dairy cattle tend to have lower Ym than dry one (6.5% vs. 7.0%). However, the effect was not statistically significant (P=0.32). The days in milk for lactating dairy cattle showed no significant effect on Ym values (P=0.39).

Future Plans

  1. Identify research gaps in estimation of Ym values in literature. Quantify the uncertainties and highlight the main source of variation.
  2. Refine the Ym estimation model.
  3. Based on the results, develop suggestions or guidelines to improve feed efficiency and to reduce carbon footprint per unit of product

Authors

Zifei Liu, Assistant professor, Kansas State University zifeiliu@ksu.edu

Yang Liu, Xiuhuan Shi

Additional information

http://www.bae.ksu.edu/~zifeiliu/

The authors are solely responsible for the content of these proceedings. The technical information does not necessarily reflect the official position of the sponsoring agencies or institutions represented by planning committee members, and inclusion and distribution herein does not constitute an endorsement of views expressed by the same. Printed materials included herein are not refereed publications. Citations should appear as follows. EXAMPLE: Authors. 2015. Title of presentation. Waste to Worth: Spreading Science and Solutions. Seattle, WA. March 31-April 3, 2015. URL of this page. Accessed on: today’s date.
Case Study: A Solid-Liquid Manure Separation Swine Operation for Resource Conservation


*Why Examine Solid – Liquid Manure Separation at Pig Farms?

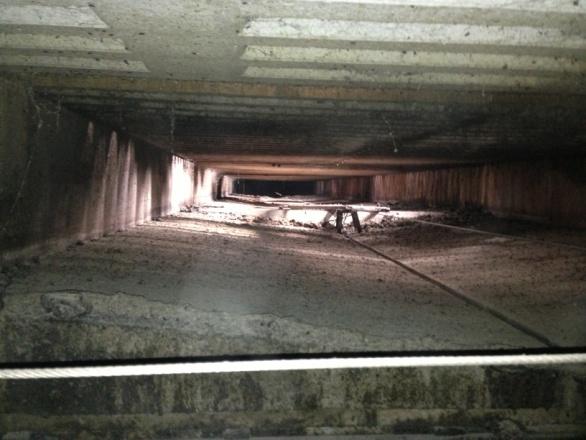
v-shape pit with automated manure scraper and trough

V-shape pit with automated manure scraper and trough

Many US pork production operations have become large in size and more geographically concentrated, and use very similar production facilities and manure management. With the potential extreme climates and diminishing water and land base, the industry needs to further improve the production systems and conservation effort. A Missouri swine finishing barn was designed to separate manure into solid and liquid portions, reduce odor and air emissions, and provide options for nutrient and water management. There is potential to reduce overall water use, and more importantly, to more efficiently export nutrients from the farm, or conserving nutrients in either the solid or liquid portions using additional practices.

What did we do?

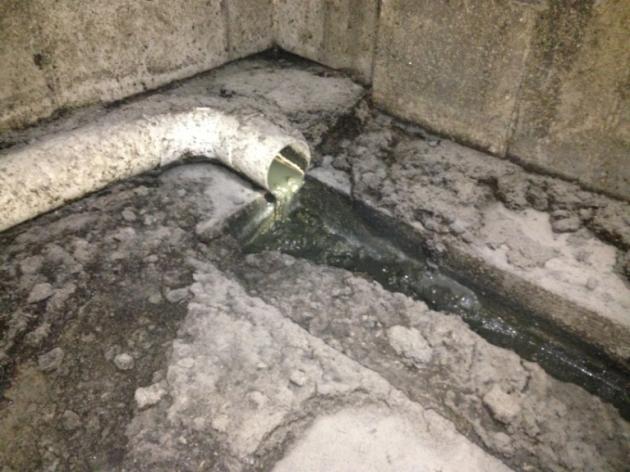
Gravity draining of liquid manure

Gravity draining of liquid manure

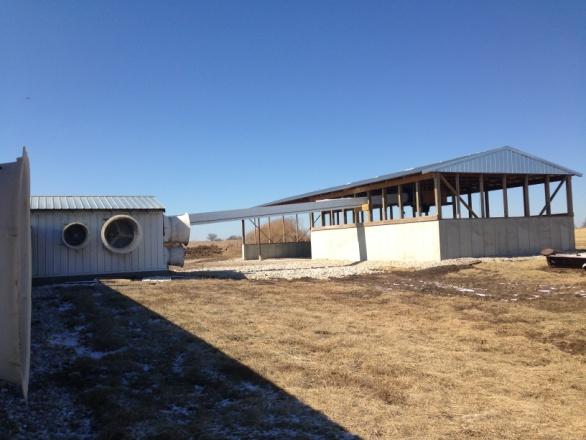
The solid/liquid separation barn has a capacity of 1200-hd. Manure management consists of a V-shaped gutter with mechanical scrapers installed beneath slatted floor, and a central pipe that collects the liquid manure fraction. The scraped manure is mechanically conveyed out to a nearby storage shed. Liquid manure portion is gravity drained into a temporary sump pit, and pumped into a nearby anaerobic lagoon automatically. Four monthly solid portion and liquid portion samples were collected and analyzed for moisture content, total nitrogen, phosphorous, potassium, pH, total carbon, and volatile solid content. The collected samples were kept on ice during transport and then frozen until analyzed by the University of Missouri Soil and Plant Testing Laboratory. Ammonia and hydrogen sulfide concentrations of the exhaust air streams were also measured using gas detection tubes during three of the four sampling events.

What have we learned?


storage shed for solid manure

Storage shed for solid manure

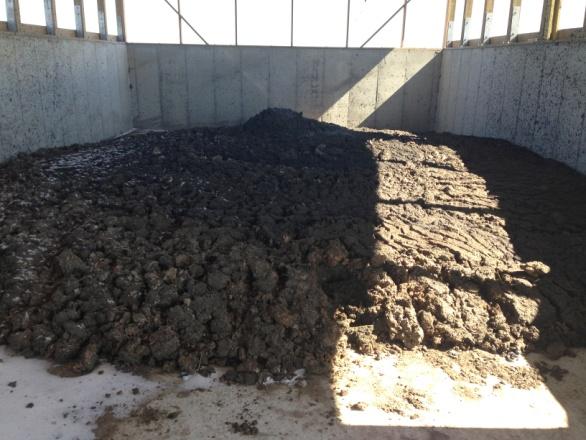
The solid manure portions have relatively low moisture content (MC, 57.9% to 63.4%, averaged 60.7%), and the liquid portion still have considerable amount of solids (MC = 93.3% to 98.3%, averaged 96.1%). The average nitrogen, phosphorus, potassium were 1.72%, 0.65%, 0.75% for the solid manure samples, and were 0.40%, 0.10%, and 0.29% for the liquid manure samples, respectively.

Ammonia concentration of the center exhaust fans averaged 7.7, 7.0, and 1.8 ppm for the February (n=3), March (n=2), and May (n=2) sampling visits respectively, and only one room fan was operating during the March visit, which measured 5.0 ppm (n=1). For all the sampling visits, hydrogen sulfide never reached the minimum detection limit of 0.5 ppm.

stored solid manure

Stored solid manure

The new facility design and reported findings have the potential to be adapted by new and existing production facilities, to develop new business models and management that are more flexible in nutrient management, and to improve resource conservation and reduce pollutions. It has been noted that the liquid stream can have relatively low solids from the well maintained scraper systems. If the farm continues to use the lagoon, there will be significantly less solid to be agitated and pumped. Assuming the untreated manure has a solid content of 6%, and the solid contents of the separated liquid and solid portions average about 3% and 39% respectively, the estimated contents in the solid manure are 28% and 47% of the total nitrogen and phosphorus in untreated manure, respectively. This is promising for exporting nutrients from the farm, or conserving nutrients in either the solid or liquid portions using additional practices.


Future Plans

More research is needed to systematically analyze the costs and management of the facilities, implications of water/nutrient conservations, potential byproduct production, and long-term sustainability improvement. The immediate next steps are to characterize the liquid and solid manure portions (in terms of volume and nutrient values) and barn air quality and emissions during different seasons. Effort should also include identification of the minimal and different levels of pre-treatment and reverse osmosis onto the liquid manure, for potential fertilizer concentrate, improved manure management, and potential water recycling. The long-term goals are to improve such solid/liquid separation barn, to provide partial manure treatment and water recycling potential that can be tailored for different cases and production sites.

Authors

Teng Lim, Associate Professor, University of Missouri limt@missouri.edu

Joseph M. Zulovich, University of Missouri.

Additional information

The collaboration of the farm owner and managers are greatly appreciated.

The authors are solely responsible for the content of these proceedings. The technical information does not necessarily reflect the official position of the sponsoring agencies or institutions represented by planning committee members, and inclusion and distribution herein does not constitute an endorsement of views expressed by the same. Printed materials included herein are not refereed publications. Citations should appear as follows. EXAMPLE: Authors. 2015. Title of presentation. Waste to Worth: Spreading Science and Solutions. Seattle, WA. March 31-April 3, 2015. URL of this page. Accessed on: today’s date.
Effects of Subsurface Litter Application Technology on Odor


Purpose         

Manure handling and application to agricultural land from animal facilities creates odor nuisances where population sprawl encroaches into once rural areas. The University of Maryland Eastern Shores (UMES) and The Pennsylvania State University (PSU) collaborated on data collection to quantify the odor reduction benefit of a novel technology called the Subsurfer which places poultry litter of ≤ 25% moisture content beneath the soil surface as opposed to traditional broadcast application.

What did we do?

Two 80-foot square locations were chosen at PSU’s Ag Progress site having similar grassy vegetation. For three separate trials, turkey litter was used, a slight departure from the usual use of poultry litter. This litter was chosen because it was available, and had a favorable moisture content of less than 25%. Three treatments were applied; subsurface application for location one , broadcasting for location two using the Subsurfer at the rate of two tons per acre, and no litter as a background. . Field-applied litter was evaluated using Nasal Ranger Field Olfactometer (NRO) instruments measuring dilutions-to-threshold (D/T) during field application employing the Multiple-Assessor Repeat Observation (MARO) method (Brandt et at., 2011a and 2011b). Odor assessment teams made observations at each location prior to litter application (background measurement) and at 1, 4, and 24 hr after the litter was applied at each location. Whole air samples were collected in 10-liter Tedlar® bags 4 hr after litter application using surface isolation flux chambers and the vacuum suitcases. A team of five qualified odor panelists quantified odor detection threshold (DT) using Dynamic Triangular Forced-Choice Olfactometry (DTFCO) on an Ac’ScentTM International Dynamic Olfactometer (St. Croix Sensory, Lake Elmo, MN) the same day of sample collection.

What have we learned?

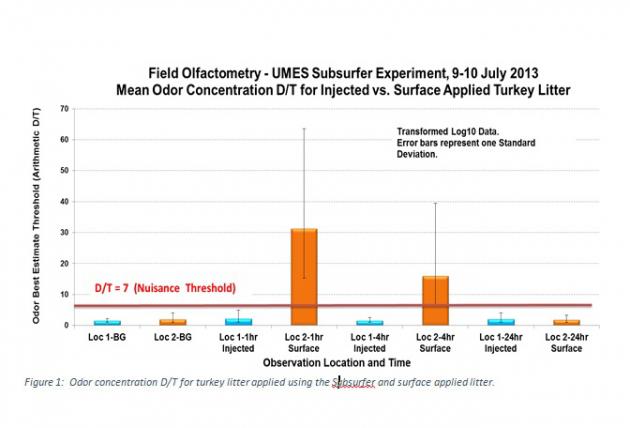
Results show greater than 75% reduction in mean odor concentration by DTFCO and NRO-MARO methods when the Subsurfer is used. Figure 1 shows the odor concentration D/T reduction of 92% (97% less background) for the 9 July 2013 data collection event when applying litter using the Subsurfer. Figure 1. odor concentration for turkey litter applied using the subsurfer and surface applied litter

Results from subsequent events (23 and 25 July 2013) showed significant reduction as well not below 75% when litter was applied using the Subsurfer. Figure 2 exhibits the same trend of 86% reduction (92% less background) in odor concentration DT using the DTFCO method. Again, measurements from subsequent data collection events yield similar results (minimum 75% reduction of odor concentration when the Subsurfer is used).

Figure 2. odor concentration for turkey litter applied using the subsurfer and surface applied litter

Future Plans

No future work is planned at this time.

Authors

Hile, Michael, Ph. D. Candidate in Agricultural and Biological Engineering (ABE) at Penn State (PSU) mlh144@psu.edu

Dr. Robin Brandt, Senior Lecturer in ABE at PSU, Ms. Nancy Chepketer, Graduate Assistant at UMES, Dr. Eileen E. Fabian, Professor in ABE at PSU and Dr. Herschel A. Elliott, professor in ABE at PSU, Dr. Arthur Allen, Associate Professor and Associate Resea

References              

Brandt, R.C., H.A. Elliott, M.A.A. Adviento-Borbe, E.F. Wheeler, P.J.A. Kleinman, and D.B. Beegle. 2011a. Field Olfactometry Assessment of Dairy Manure Land Application Methods. J. Environ. Qual. 40: 431-437.

Brandt, R.C., M.A.A. Adviento-Borbe, H.A. Elliott, E.F. Wheeler. 2011. Protocols for Reliable Field Olfactometry Odor Evaluations. J. Appl. Engr Agr. Vol. 27(3): 457-466.

The authors are solely responsible for the content of these proceedings. The technical information does not necessarily reflect the official position of the sponsoring agencies or institutions represented by planning committee members, and inclusion and distribution herein does not constitute an endorsement of views expressed by the same. Printed materials included herein are not refereed publications. Citations should appear as follows. EXAMPLE: Authors. 2015. Title of presentation. Waste to Worth: Spreading Science and Solutions. Seattle, WA. March 31-April 3, 2015. URL of this page. Accessed on: today’s date.
Hydrogen Sulfide Release from Dairy Manure Storages Containing Gypsum Bedding


Why Look at Potential Connections Between Gypsum and Hydrogen Sulfide?

Gypsum, a recycled product from the waste streams of the manufacturing and construction industries, provides ideal bedding for livestock because it absorbs moisture keeping the animals dry, is non-abrasive, and discourages bacterial growth as it is inert and non-organic. Gypsum is calcium sulfate (CaSO4•2H2O) and provides a sulfur source material that potentially increases H2S production from the manure storage due to the high generation of H2S levels. The goal of this research project is to compare H2S concentrations among Pennsylvania dairy farms that use traditional bedding, gypsum bedding and gypsum bedding with an amendment. Related: Manure Storage Safety | 2013 Waste to Worth conference proceedings by these authors “Gypsum Bedding – Risks & Recommendations for Manure Handling

Information from this gypsum bedding project was recently featured on a pre-conference webcast More…


What did we do?

Ten farms were observed during 19 fall and spring agitation events. Portable multi-gas meters (models MX6, M40 and Tango, Industrial Scientific, Pittsburgh, PA) were place around the perimeter of each manure storage, 10 meters downwind of the storage perimeter and attached to the operator for the duration of the event to monitor exposure. Each meter recorded gas measurements every minute during the first hour of manure agitation. Wind speed, wind direction and air temperature were recorded every minute during these events using a weather station (Kestral Communicator model 4500, Nielsen-Kellerman, Birmingham, MI). Manure storage design and manure handling practices were characterized. Manure was characterized according to general chemistry (temperature, pH and oxidation-reduction potential) as well as submitted for a full nutrient analysis content including total nitrogen, sulfur, calcium, percent solids and phosphorus source coefficient.

What have we learned?

Figure 1 shows cumulative H2S concentrations versus gypsum application rate. Gypsum and non-gypsum farms represented by the diamonds show a significant increase in cumulative H2S concentrations with increasing gypsum application rate. The observations depicted by the squares represent farms that use Vital™ Breakdown (manufactured for Homestead Nutrition, New Holland, PA), a treatment reported to reduce H2S emissions. One of the farms observed, also pointed out in Figure 1 by the triangles, uses OK-1000 (manufactured by Pro-soil Ag Solutions, Hawkins, TX) as a manure additive. Though it appears that these manure additives reduce cumulative H2S concentrations, the reduction was not statistically significant because not enough observations were recorded to provide statistical power.

Movement of manure prior to the storage location appears to allow H2S to escape before entering long term storage (shown in Figure 1 as prior agitation), lowering H2S concentrations released during agitation of the manure storage. Wind flowing into proximate buildings inhibited the dissipation of H2S thereby increasing cumulative H2S concentrations as shown by the observation pointed out by the image of wind direction in Figure 1. Four observations of operator exposure (out of 19 observations including non-gypsum, gypsum and gypsum with additive) yielded H2S concentrations above 20 ppm (above the Occupational Health and Safety Administration’s (OSHA) recommended exposure limit. Of the four operators above 20 ppm H2S, three were working over the rim of the storage, which increased risk of exposure. Downwind H2S concentrations above 20 ppm ten meters from storage occurred for eight out of the fourteen observations from farms that use gypsum, showing that children and animals within ten meters of the storage are at risk.

Figure 1. cumulative hydrogen sulfide concentrations for first 60 minutes of agitations versus gypsum application rate

Future Plans  

Bench scale work will be performed in hopes of finding a manure additive that reduces H2S production from farms that use gypsum. A new product (Dri Mat) formulated from its precursor, VitalTM Breakdown, will be mixed with manure and analyzed to determine the efficacy to reduced H2S emissions. Iron oxide, a by-product of acid mine drainage passive treatment lagoons will be one of the treatments for this work as well.

Authors  

Hile, Michael, Ph. D. Candidate in Agricultural and Biological Engineering (ABE) at Penn State (PSU) mlh144@psu.edu

Dr. Eileen E. Fabian, Professor in ABE at PSU, Dr. Herschel A. Elliott, professor in ABE at PSU, Dr. Robin Brandt, Senior Lecturer in ABE at PSU, Dr. C. Alan Rotz, Agricultural Engineer at USDA-ARS and Dr. Ray Bryant, Soil Scientist at USDA-ARS.

Acknowledgements      

This project would not have been possible without the support from Natural Resources Conservation Service’ (NRCS) Conservation Innovation Grant (CIG) program, USA Gypsum and Industrial Scientific.

The authors are solely responsible for the content of these proceedings. The technical information does not necessarily reflect the official position of the sponsoring agencies or institutions represented by planning committee members, and inclusion and distribution herein does not constitute an endorsement of views expressed by the same. Printed materials included herein are not refereed publications. Citations should appear as follows. EXAMPLE: Authors. 2015. Title of presentation. Waste to Worth: Spreading Science and Solutions. Seattle, WA. March 31-April 3, 2015. URL of this page. Accessed on: today’s date.

Swine Manure Odor Reduction Using a Humic Amendment: On-Farm Demonstration


Why Study Odors from Pig Farms?

Odor-related nuisance complaints associated with animal production facilities are on the rise as residential sprawl encroaches on once rural areas. The efficacy of odor control additives is highly variable and most have limited success. This project demonstrated the efficacy of a commercial humic-material product (ManureMaxTM, Manufactured by JDMV Holding, LLC; Huston, TX) for limited control of liquid swine manure odors.

What did we do?

Two similarly-operated, 2,250-pig, tunnel-ventilated finishing barns on one farm were used for the demonstration. Barns were widely-separated by 1,800 feet of woodland and fields and were occupied by pigs of similar age. The underfloor manure storage pit (5-ft deep) of one barn received monthly additions with the additive while the other barn received no additive. After 20 weeks when hogs were finished for market and barns cleaned for restocking, treatments were switched so the previously untreated barn received the amendment. Odors at the barn ventilation exhaust were evaluated monthly by direct sensory methods (olfactometry) using human subjects. Field-applied manure was evaluated at the end of each 20-week grow-out period. Nasal Ranger Field Olfactometer (NRO) units were used to evaluate barn exhaust odor dilutions-to-threshold (D/T) and odors during field application, employing the Multiple-Assessor Repeat Observation (MARO) method (B randt et at., 2011a and 2011b). Barn ventilation exhaust was normalized against fan velocity and compared as odor flux (odor units min-1) among treatments. Whole air samples were collected in 10-liter TedlarTM® bags during each field visit and brought back to the Penn State Odor Assessmnt Laboratory (PSOAL) for evaluation. A team of five qualified odor panelists quantified odor detection threshold (DT) using Dynamic Triangular Forced-Choice Olfactometry (DTFCO) on an Ac’ScentTM International Dynamic Olfactometer (St. Croix Sensory, Lake Elmo, MN) within 10 hours of sample collection.

What have we learned?

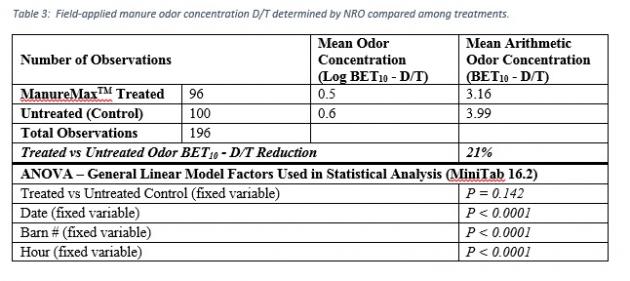
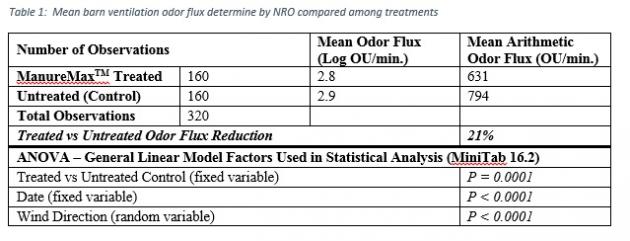
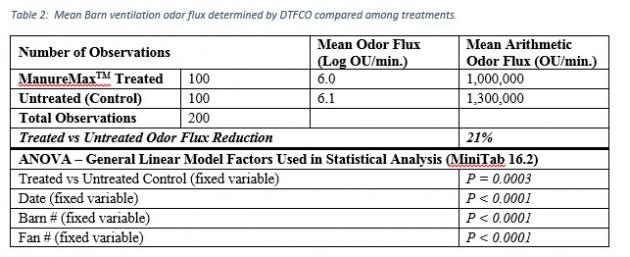
Results show a 21% reduction in mean barn odor exhaust as shown in Table 1 and Table 2. The humic amendment significantly decreased barn ventilation odor flux by 21% in both field NRO and laboratory DTFCO evaluations. Evaluation of field applied manure yield a 21% and 60% decrease in odor concentrations for NRO and DTFCO, respectively.mean barn ventilation odor flux

mean barn ventilation odor flux

field-applied manure odor concentration

field-applied manure odor concentration DT

Authors

Hile, Michael, Ph. D. Candidate in Agricultural and Biological Engineering (ABE) at Penn State (PSU) mlh144@psu.edu

Brandt, Robin, Senior Lecturer in ABE at PSU, Eileen E. Fabian, Professor in ABE at PSU and Herschel A. Elliott, professor in ABE at PSU. Robert E. Mikesell, Program Coordinator and Senior Lecturer, Department of Animal Science at PSU.

Additional information

Brandt, R.C., H.A. Elliott, M.A.A. Adviento-Borbe, E.F. Wheeler, P.J.A. Kleinman, and D.B. Beegle. 2011a. Field Olfactometry Assessment of Dairy Manure Land Application Methods. J. Environ. Qual. 40: 431-437.

Brandt, R.C., M.A.A. Adviento-Borbe, H.A. Elliott, E.F. Wheeler. 2011. Protocols for Reliable Field Olfactometry Odor Evaluations. J. Appl. Engr Agr. Vol. 27(3): 457-466.

Brandt, R. C., H. A. Elliott, E. E. Fabian, M. L. Hile, R. E. Mikesell, Jr., 2014. Manure Additive Shows Swine Odor Reduction. Fact Sheet. Penn State University, Department of Agricultural and Biological Engineering.

Acknowledgements

Thanks to JDMV Holding, LLC Houston, TX) for providing funding and product for this project. This project would not have been possible without the support from Natural Resources Conservation Service’ (NRCS) Conservation Innovation Grant (CIG) program.

The authors are solely responsible for the content of these proceedings. The technical information does not necessarily reflect the official position of the sponsoring agencies or institutions represented by planning committee members, and inclusion and distribution herein does not constitute an endorsement of views expressed by the same. Printed materials included herein are not refereed publications. Citations should appear as follows. EXAMPLE: Authors. 2015. Title of presentation. Waste to Worth: Spreading Science and Solutions. Seattle, WA. March 31-April 3, 2015. URL of this page. Accessed on: today’s date.

Reducing Emissions of Carbonyl Compounds with Waste-Cooking-Oil Biodiesel/Butanol/Diesel Blends Fuelled on the Diesel Engine


What Factors Should We Consider with Biodiesel?*

In recent years, the increasing depletion of petroleum resources from environment and the worsening pollution problems have led to concerns regarding alternatives to petroleum fuels. It is by now well known that the EU has set a target of replacing 10% of conventional fuels with biofuels by 2020. As renewable, biodegradable, and nontoxic fuel research has continued to the present, biodiesel has attracted considerable attention over the past decade.To the best of our knowledge, relatively little is known about CBCs produced by burning butanol and waste cooking oil (WCO) biodiesel blends in diesel engines. In this study, we use butanol and waste cooking oil biodiesel blended with diesel to evaluate the fuel potential to decrease CBC emissions from diesel engines. Emission factors are compared and discussed. Additionally, the feasibility of biodiesel blends and optimum percentage of biodiesel in fuel blends are assessed.

What did we do?  

In this study, six fuels are tested during the experiments. The base fuel is a premium diesel fuel (D100, 98%fossil diesel and 2% biodiesel) produced by Chinese Petroleum Corporation (CPC). In addition, the biodiesel (made by waste cooking oil) used for testing is produced by Greatec Green Energy Corporation in Taiwan. n-butanol is obtained from J. T. Baker (>99.5% purity). The diesel blend fuels used in this study are: B10 (10 vol% butanol), B10W10 (10 vol% butanol and 10 vol% biodiesel), B10W20 (10 vol% butanol and 20 vol% biodiesel), and B10W30 (10 vol% butanol and 30 vol% biodiesel), and B10W40 (10 vol% butanol and 40 vol% biodiesel), respectively.

The pollutant emissions from a diesel-fueled engine generator are examined. This diesel engine, made by Subaru (DY23-2D), is a four-cycle, air-cooled, overhead valve, single-cylinder. Moreover, the combustion system is direct injection and no further modification is needed. The bore and stroke are 70 mm and 60 mm, respectively. The displacement volume is 230 cc and the maximum output power is 2.8 kW at 3000 rpm. The torque is 10.5 Nm at 2200 rpm. Tests are performed at steady state condition with the engine running at 2200 rpm with torque and power outputs of 10.4 Nm (75% of the max load) and 2.1 kW, respectively, for the six test fuels.

What have we learned?

Biodiesel, a renewable and degradable fuel, is widely used due to its low emissions and toxicity. Biodiesel can be produced from animal fats or vegetable oils with methanol or ethanol as the catalyst via transesterification. Although blends of biodiesel/diesel/alcohols are well known in emission reduction, butanol has been recently found to have economic and sustainable potential as a substitute for ethanol in diesel blends. This study investigates the emissions of carbonyl compounds (CBCs) and regulated traditional pollutants that are produced from diesel engine combustion in steady-state conditions. Experimental results indicate that formaldehyde and acetaldehyde are the major and secondary carbonyls in the exhaust, which account for 84.6–69.7% of total CBC concentrations for all test fuels. It is also found out that using B10W40 instead of D100 is able to reduce PM and NOx by 46.5% and 31.8%, respectively. There is a decrease of form aldehyde concentrations in proportion to butanol-biodiesel content among the blends.

Future Plans      

The outcome of using biodiesel-butanol-diesel blends as alternative fuels is encouraging. In general, the variation of carbonyl emissions of biodiesel in engines can be affected by several factors, such as engine load, biodiesel components, and driving cycle. Further research is necessary for a better understanding of formation of carbonyl from esters. More careful attention must be paid to non-regulated emissions from biodiesel blends.

Authors         

Yuan-Chung Lin, Prof. at Inst. Environ. Eng., National Sun Yat-Sen University. Taiwan Deputy Executive Officer at Environ. Protec. & Safety Center yuanchung.lin@gmail.com

Kang-Shin Chen, Po-Ming Yang, Yuan-Chung Lin*, Kuang C. Lin, Syu-Ruei Jhang, I-Wei Wang

Additional information

Yuan-Chung (Oliver) Lin Ph.D.

Prof. at Inst. Environ. Eng., National Sun Yat-Sen University. Taiwan

Deputy Executive Officer at Environ. Protec. & Safety Center

TEL: +886-7-5252000 ext 4412

+886-7-5254412

FAX: +886-7-5254412

Cell: +886-935795228

yclin@faculty.nsysu.edu.tw

yuanchung.lin@gmail.com

The authors are solely responsible for the content of these proceedings. The technical information does not necessarily reflect the official position of the sponsoring agencies or institutions represented by planning committee members, and inclusion and distribution herein does not constitute an endorsement of views expressed by the same. Printed materials included herein are not refereed publications. Citations should appear as follows. EXAMPLE: Authors. 2015. Title of presentation. Waste to Worth: Spreading Science and Solutions. Seattle, WA. March 31-April 3, 2015. URL of this page. Accessed on: today’s date.
The Dairy Manure Biorefinery


Why Consider Additional Technologies with Anaerobic Digestion?

Some dairy farms have experimented with “add-on” technologies to enhance the value of the products generated from anaerobic digesters to improve economics and address other environmental and management concerns. This effort has intensified in recent years, as prices paid for electricity continue to fall. This trend is making it more difficult to justify the installation of new digesters or maintain active anaerobic digestion (AD) projects based on electricity sales alone. 

What did we do?

Based on ten years of research and extension within the field of dairy digesters, we are proposing that the concept of a dairy manure biorefinery can be useful to focus ongoing research and commercialization efforts (Figure 1). A biorefinery integrates a core biomass conversion process (in this case, AD, converting manure and in many cases other organic substrates) with additional downstream technologies. These combined technologies generate multiple value-added products including fuels, electricity, chemicals, and other products (NREL, 2009). Most add-on technologies relevant to dairy facilities have been modified from technologies used in the wastewater treatment and oil and gas industries. 

What have we learned?

Ongoing research and commercialization efforts by our team and others aim to:

  • Adapt technologies to fit the economic and other constraints of dairy digesters.
  • Increase efficiency and reduce costs by maximizing the complimentary nature of technologies (e.g. waste heat from one process is used in another process).

Specific add-on technologies that are continuing to evolve within the biorefinery context include:

Biogas Upgrading to remove impurities from biogas (primarily carbon dioxide, hydrogen sulfide, and water vapor).

Output: Purified biogas that can be used as a transportation fuel (e.g. liquefied natural gas) or injected directly into natural gas piplelines.

Additional social and economic benefits: Renewable fuel can reduce demand for fossil fuels, and can often receive economic credits (e.g. renewable identification numbers, low carbon fuel standard)

Fiber Upgrading to process the fiber that is removed from AD effluent.

Output: Upgraded fiber can be sold as a higher-value soil amendment in the horticultural industry

Additional social and economic benefits: Fiber can replace use of non-renewable resource (peat moss) by horticultural industry

Nutrient Recovery to strip nitrogen (N) and phosphorus (P) from anaerobic digester effluent.

Outputs: Soil amendment products that can be sold offsite where nutrients are needed

Additional social and economic benefits: Reductions in N and P applied to nearby fields, and reduced effluent hauling distances/costs for land application due to lower nutrient concentration in effluent

Water Recovery to generate “recycled” water using advanced technologies

Output: Water that can be used for animal drinking, or as dilution water for the AD facility

Additional social and economic benefits: Reduces consumption of fresh water, a limited resource, and reduces costs for land-application of AD effluent

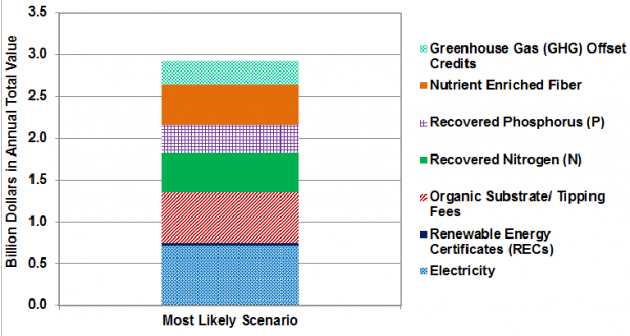
Overall Potential Impact. Improving economics and addressing other critical issues for dairy producers (e.g. nutrient issues) has the potential to advance farm-based AD adoption significantly beyond its current 244 farms. It has been estimated that a mature bio-refinery industry based on AD on large U.S. dairy farms could create an estimated bio-economy of nearly $3 billion that complements the production of milk and dairy products (ICUSD, 2013).

Figure 1. Stepwise depiction of the process

Figure 2. Total likely value added by most likely scenario

Authors

Georgine Yorgey (presenting author)a, Craig Frearb, Nick Kennedya, Chad Krugera, Jingwei Mab, and Tara Zimmermana

a Center for Sustaining Agriculture and Natural Resources, Washington State University

b Department of Biological Systems Engineering, Washington State University

Future Plans

An extension document describing this concept and the add-on technologies in additional detail is being prepared. This document is part of a series of extension documents on Dairy AD Systems, being prepared by the authors and other colleagues at Washington State University. In addition, ongoing work and collaborations by our team are seeking to investigate, evaluate, and improve individual technologies and the linkages amongst them.

Additional Information

ICUSD, 2013. National market value for anaerobic digestion products. Report to Innovation Center for US Dairy, August 2013.

Acknowledgements

This research was supported by USDA National Institute of Food and Agriculture, contract #2012-6800219814; and Biomass Research Funds from the Washington State University Agricultural Research Center.

The authors are solely responsible for the content of these proceedings. The technical information does not necessarily reflect the official position of the sponsoring agencies or institutions represented by planning committee members, and inclusion and distribution herein does not constitute an endorsement of views expressed by the same. Printed materials included herein are not refereed publications. Citations should appear as follows. EXAMPLE: Authors. 2015. Title of presentation. Waste to Worth: Spreading Science and Solutions. Seattle, WA. March 31-April 3, 2015. URL of this page. Accessed on: today’s date.
Economical Anaerobic Digestion of CAFO Animal Waste


Purpose

The application of manure on croplands is increasingly under regulatory scrutiny, especially from impaired watersheds. The challenge facing many small farms is to find cost-effective and innovative solutions for manure reuse whilst responding to environmental, regulatory and public concerns. One option is to install an anaerobic digester (AD) in which microorganisms break down biodegradable material in the absence of oxygen. However, not all farmers are financially able to install an AD but do need the AD’s benefits to keep their livestock operation sustainable. This paper discusses a novel, cost effective and patented manure treatment system which can reduce the volume of manure for field application (see Figure 1).Earthmentor N2RTS Schematic

What did we do?

The EarthMentor® Natural Nutrient Reclamation and Treatment System (EMS), uses a combination of innovative sand separation technology (if necessary) and anaerobic treatment to concentrate manure nutrients into solid phases and treat approximately 70% of manure liquids into a product which can be applied to active cropland as low-nutrient liquid using irrigation methods. The primary economic advantage of using an EMS to treat livestock manure prior to land application is lower total manure disposal costs. The total manure handling costs are reduced because up to 75 % of the original manure volume can be handled as low-nutrient value irrigation quality liquid in bulk instead of hauling it by tanker for land application. This fact alone reduces total manure handling costs by over 50 %. Other tangible benefits of using an EMS include low odor, minimized environmental risks, and greater flexibility in proper land application of the treated manure. It can be installed at farms with as few as 250 cows. Depending on farm size, operators can realize a return on investment in as little as three years. Compared to a traditional AD installed to generate biogas the EMS is simple to operate, requires less energy, requires no chemicals or substrates to treat the waste, and reduces manure disposal costs.

The EMS involves six major steps: 1) collection of raw manure and transport to the processing center, 2) sand bedding is separated from the manure stream, 3) coarse manure components are removed from the liquid manure stream, 4) additional settling of the fine manure solids and sand particles occurs in a settling basin to a concentration of 8 to 10 percent solids, 5) AD treatment of the liquid manure and dissolved solids occurs in anaerobic treatment lagoon (ATL), and 6) The ATL effluent is stored in a Storage Pond for eventual discharge to active growing crops; additional natural treatment of the liquid manure occurs while in the Storage Pond.

All settling basins and ATL lagoon must meet state guidelines, such as Natural Resource Conservation Service technical guidelines or state requirements for waste storage facilities.

The ALT of the EMS system has a smaller footprint compared to traditional ALTs (primarily use in the south and western United States) because the majority of the nutrient-rich semi-solids are removed from the manure before discharge to the ATL. Due to this major operational change the EMS is economical to install and operate even in the northern climates of the United States where many of the top producing dairy states are located. While many facilities separate solids before land application, the EMS is different because is adds the AD step which converts the manure into a low-nutrient liquid capable of irrigation-style land disposal.  The method of solid separation can be as simple as a sloped screen followed by additional gravity separation as described in Step 4 above. The EMS ATL must be sized to account for reduced biodegradation during the colder weather. The EMS has successfully operated at multiple swine facilities and several Midwestern dairy farms.

If there is sufficient land near the farmstead, the EMS can be installed at existing dairies with minimum difficulty since the treatment system works equally well with multiple bedding materials and varying manure collection methods. Another benefit of the EMS is that is allows application on fields that may be high in phosphorus since much of the phosphorus will be stored in the accumulating ATL sludge. For dairies bedding with sand, a patented sand removal system can be provided that relies on a decanting method of sand separation. Once the sand is removed, it can be reused in the barn. 

What have we learned?

Typical Cost Savings for Manure Application Using EMS
Component
Disposal Method
Conventional Manure Handling
EarthMentor® Treatment System Handling
Liquid Manure


Land Application 100% $0.02/gallon 0% $0
Separated Solids Land Application 0% $0 10% $0.016/gallon
($4/ton equiv.)
Heavy Slurry Land Application 0% $0 20% $0.02/gallon
Treated Wastewater Center Pivot over Crop 0% $0 70% $0.002/gallon
Combined Cost   100% $0.02/gallon 100% $0.007/gallon
(weighted average of all components)

Using financial data from 2010 for a 2,000-cow Michigan dairy, it was estimated that the cost to handle manure using an EMS is reduced from $0.02/gallon to $0.007/gallon. The cost saving using the EMS is based on the assumption that the average dairy cow produces nearly 25 gallons/day of manure, including wastewater but excludes bedding since farms used different types and volumes of bedding for their dry and lactating cows. Based on the financial analysis, installation of an EMS benefits the farm’s economic sustainability while providing other benefits including reduced environment risk associated with manure land application.

Far beyond the obvious cost savings associated with the EMS installation, a livestock producer will realize many other benefits. A partial list is provided below:

  • This practical and manageable manure treatment system requires little or no additional farm labor commitments yet greatly reduces overhead expenditures to keep the farm sustainable and competitive,
  • All manure is treated prior to land application (environmentally sound),
  • The more consistent high solids slurry can be precisely applied to fields with the greatest need as opposed to the highly variable manure nutrient concentrations recovered from a traditional manure pond,
  • Minimizes the environmental risks (ecologically viable) and farm nuisance potential,
  • The window of opportunity for manure application is extended to over 200 days instead of being limited to spring and fall applications for typical liquid manure,
  • Can provide a safe unlimited recycled bedding source for cattle, if so desired, by the dairy owner,
  • Permits farmer to follow BMPs for soil conservation,
  • Permits farmer to follow timing, rate, source, and place for fertilizer/crop nutrient applications,
  • Benefits the non-farm neighbors and community through reduced nuisance odors, and
  • Continues using the farm’s manure as a soil amendment for crop production, the most efficient use known.

Future Plans

The immediate future plans for EMS is to target small livestock producers, especially those within impaired watersheds.  Since many ADs need a substrate material imported from outside the farm to be economically sustainable, the EMS is ideal for those farms that want to be good neighbors with reduced farm air emissions, need greater convenience in manure management, and desire to maximize the real cash value of their manure.

As the EMS adapts well to any bedding material, by investing time and dedicating property for the ATL any size operation can begin to treat their manure prior to land application and reduce their overall cost for manure management.

In addition to small farms we envision four possible adaptations of EMS; these examples are provided to show the transferability of this technology to farms desiring various outcomes from an EMS:

  1. Installation of an Energy-Generating AD – if a farm wishes to generate energy using a traditional AD, it would be installed prior to the EMS system whereby the AD digestate discharges into the settling ponds. Since the residence time of a traditional AD is measured in days, there is a great deal of additional treatment that can occur so that the cost savings for land application can still be realized.
  2. Use manure solids for other uses besides land application – if the livestock producer decides to bed their cattle on manure solids or to compost the manure solids for sale off-farm to landscapers or bag and sell direction from the farm then the solids from the SS can be further treated with a screw press or roller then composting by various means.
  3. Greenhouse gas capture and sale of carbon credits – a geosynthetic liner cover can be added to the ATL and all captured gases burned through a flare. However, it should be noted that by removing a significant amount of high organic solids during the initial fiber solids separation step, much less organic material is subject to organic degradation into methane gas.
  4. Greenhouse gas capture and burning of the gases – to generate electricity or heat water (typically for on-farm use or export to an adjoining business, such as a greenhouse).

One future issue to resolve includes educating state governments on the benefits of installing an EMS, especially for those farms that may be under a Consent Order or other regulatory actions or those farms that may need to implement a manure treatment system to mitigate odors from the livestock operation.  The duration to install an EMS and get it operational is much shorter than the lead time to design and install a traditional AD so the EMS can help when farms need to implement changes quickly.  A second issue to overcome is to properly educate producers on the benefits of EMS and differences between traditional ADs.  Swine, beef, and dairy producers who already have a farm irrigation system will have a lower capital investment to begin achieving the reduced manure management costs referenced above.

Author

Matthew J. Germane, P.E., President at Germane Environmental Consulting, LLC MGermane@GECEnvironmental.net

Additional information

https://www.gecenvironmental.com, Envirolytic Technologies, LLC

Acknowledgements

Acknowledgements to Envirolytic Technologies, LLC, Greenville, OH manufacturer of the Earthmentor® N2RTS system and RAM Technologies, LLC, manufacturer of the sand separation equipment used in the EMS for their assistance in providing the laboratory data used in this paper.

The authors are solely responsible for the content of these proceedings. The technical information does not necessarily reflect the official position of the sponsoring agencies or institutions represented by planning committee members, and inclusion and distribution herein does not constitute an endorsement of views expressed by the same. Printed materials included herein are not refereed publications. Citations should appear as follows. EXAMPLE: Authors. 2015. Title of presentation. Waste to Worth: Spreading Science and Solutions. Seattle, WA. March 31-April 3, 2015. URL of this page. Accessed on: today’s date.