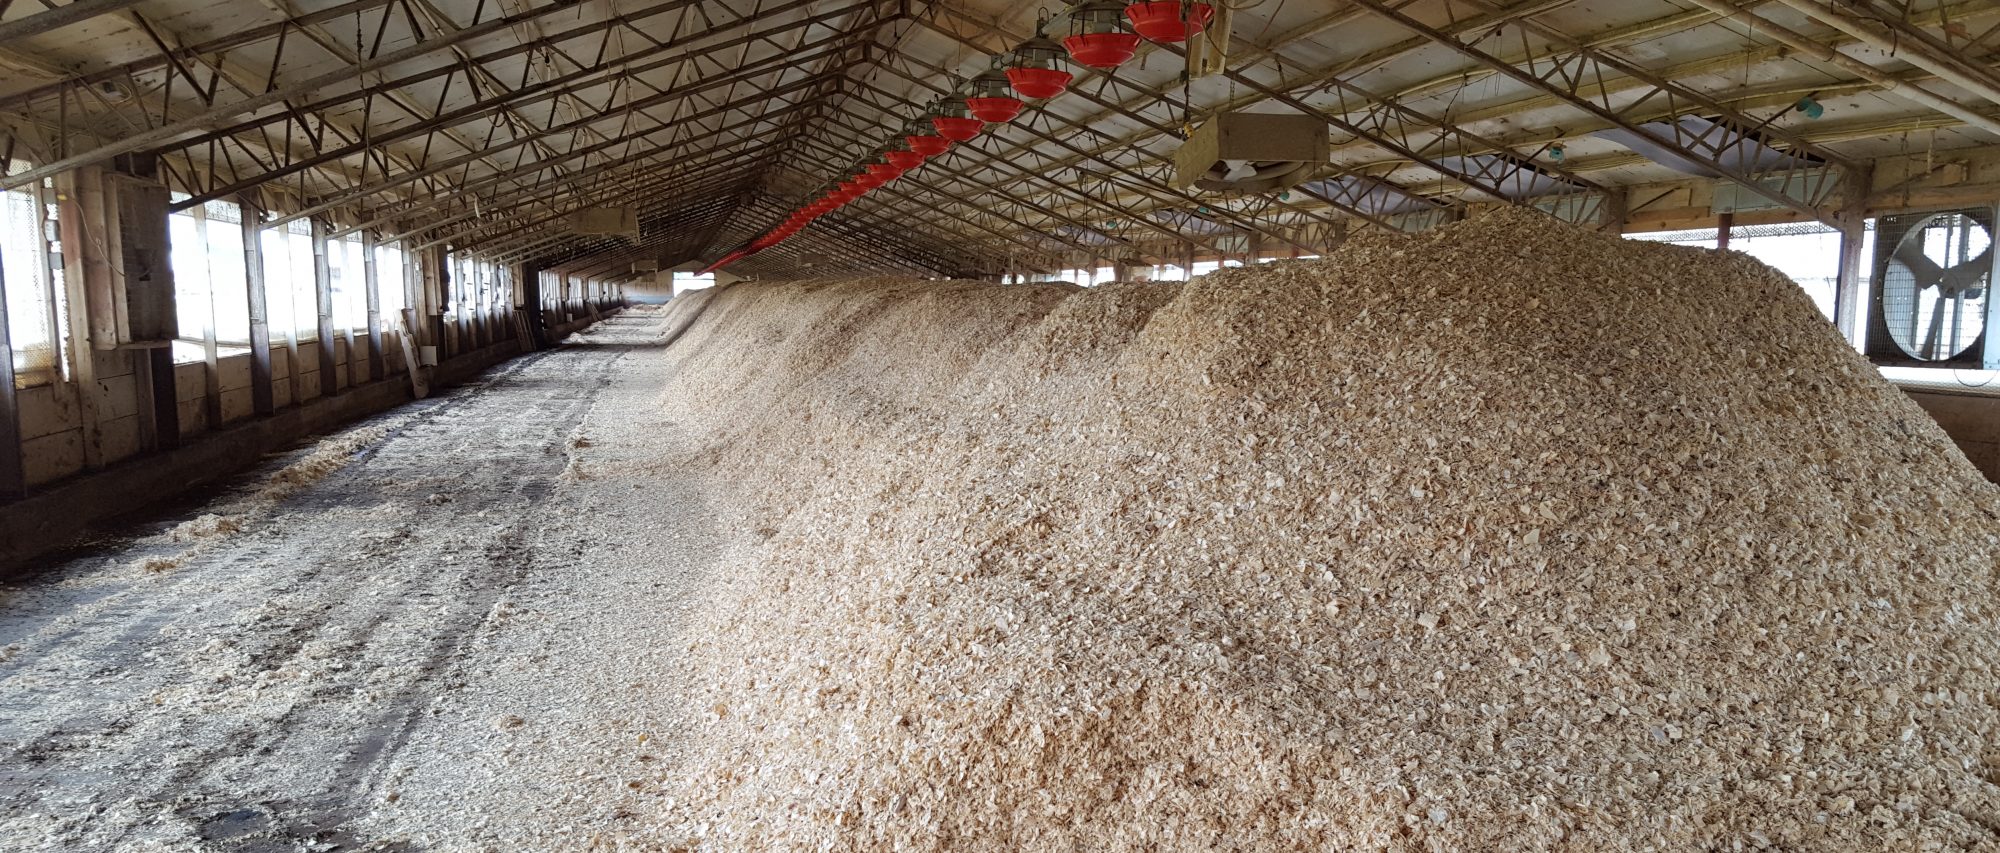

University of Idaho Sustainable Agriculture project seeks to create a bioeconomy from dairy byproducts to increase nutrient recycling

Purpose

This Sustainable Agriculture Systems project is called “Idaho Sustainable Agriculture Initiative for Dairy (ISAID).” Its main purpose is to create a bioeconomy around dairy manure and its byproducts, generating a circular use and economy of nutrients (Figure 1). Idaho is currently the third largest milk-producing state in the USA (USDA-NASS, 2021). Idaho dairy farms typically operate as confined operations that concentrate a significant amount of manure and nutrients in relatively small areas. Over the years, this situation has increased the concentration of nutrients in farms surrounding dairies. Meanwhile, distant farms may not benefit from using those nutrients (Leytem, et al. 2021). Except for its exceptional fertilizer and soil amendment value (USEPA, 2015), dairy manure is seen as a nuisance that needs to be managed well. Manure handling and use generate expenses for the producers and may be a nuisance for the neighboring communities and a potential environmental risk for the areas surrounding dairy production (Berg, et al. 2017; Moore and Ippolito, 2009; Sheffield, et al. 2008). This multidisciplinary project aims to create bioproducts from manure to significantly change the nutrient balance and the economic impact for producers in the region. Implementing the various strategies included in the project will help export nutrients to in-need areas within the region or outside the watershed altogether. In addition, increased income from manure processing would allow for better management and reduction of overall costs associated with nutrient management in the region.  The ISAID project includes three main areas that are integrated to generate the highest impact possible. Research, Extension, and Education are the distinctive areas of work. Still, these areas don’t work as silos, having a lot of integration to get the most of everybody’s work in the project.

What Did We Do?

Figure 1. Dairy bioeconomy

A group of 25 researchers in diverse areas of expertise obtained a USDA-NIFA Sustainable Agricultural Systems grant to conduct long-term (five years or more) projects. On the research side, the multifaceted studies that are under development include: use of amendments in manure composting to increase compost quality and value, reducing air emissions; nutrients’ extraction from various fractions of manure treatment to concentrate specific nutrients for individual commercialization (including nitrogen, phosphorous, and carbon); generation of hydrochar and biochar from dairy manure; bio-plastics production; cover crops use to increase nutrient extraction and soil health; fine-tuning fertilizer guides for crops using manure, compost, and other bioproducts. Analysis of each product’s economic and social impact separately and as a multi-prong approach. The extension component includes outreach to livestock and crop producers, local authorities, and communities to communicate the applicability of researched technologies and techniques, their impacts, benefits and challenges. The development of programs to train producers, allied industry, their workforce government employees on the diverse applications resulting from the project. The education component includes the participation of graduate and undergraduate students in all facets of the project and the development of educational programs for undergraduate and graduate students on topics associated with manure and nutrient management, bioeconomy, and on-farm application and management of these technologies and techniques.

What Have We Learned?

This project just finished the first of its five years; most of the projects are in the inception phase. We are generating baseline data and linking together diverse processes to determine possible interactions and needed extension and instructional needs. The corresponding poster includes a detailed list of projects associated with the grant, their corresponding principal investigators, and any recent advances. Some examples of project outcomes include the Water Machine that extracts phosphorous from waters with high nutrient content. Ammonia extraction from dairy wastewater. Enhanced composting using zeolites, pumice, biochar, and balanced carbon. Cover crops and corn silage as dual and double cropping. Hydrochar production from dairy manure and bioplastics. We are working on obtaining stakeholders’ input through diverse methods to help assess the needs of the industry and communities and guide the evolution of the research, extension, and education processes.

Future Plans

The project will continue to gather data and evolve. Collaborations and graduate student inquiries about inclusion in some projects are welcomed. We will offer updates at various conferences, including the next Waste to Worth.

Authors

Mario E. de Haro Martí, Extension Educator, University of Idaho Extension, Central District

Corresponding author email address

mdeharo@uidaho.edu

Additional authors

Mireille Chahine, Extension Dairy Specialist, Department of Animal, Veterinary and Food Science, University of Idaho

Linda Schott, Extension Nutrient and Waste Management Specialist,  Department of Soil and Water Systems, University of Idaho

Additional Information

ISAID Website: https://www.uidaho.edu/extension/nutrient-management/isaid

Facebook: https://www.facebook.com/uofiisaid

Instagram: https://www.instagram.com/uofiisaid/

Acknowledgements

This ISAID project is supported by USDA-NIFA SAS award #2020-69012-31

References

Berg, M., Meehan, M., and Scherer T. 2017. Environmental Implications of Excess Fertilizer and Manure on Water Quality. NM1281. https://www.ag.ndsu.edu/publications/environment-natural-resources/environmental-implications-of-excess-fertilizer-and-manure-on-water-quality

Leytem, A. B., Williams, P., Zuidema, S., Martinez, A., Chong, Y. L., Vincent, A., Vincent, A., et al. 2021. Cycling Phosphorus and Nitrogen through Cropping Systems in an Intensive Dairy Production Region. Agronomy, 11(5), 1005. MDPI AG. http://dx.doi.org/10.3390/agronomy11051005

Moore, A. and Ippolito, J. 2009. Dairy Manure Field Applications—How Much is Too Much? CIS1156. http://www.extension.uidaho.edu/publishing/pdf/CIS/CIS1156.pdf

Sheffield, R. E., Ndegwa, P., Gamroth, M., and de Haro Martí, M. E. 2008. Odor Control Practices for Northwest Dairies. CIS1148. http://www.extension.uidaho.edu/publishing/pdf/CIS/CIS1148.pdf

USDA-NASS. 2021. Quick Stats. Retrieved 02 27, 2022, from National Agricultural Statistics Service: https://quickstats.nass.usda.gov

USEPA. 2015. Beneficial Uses of Manure and Environmental Protection. Fact Sheet. https://www.epa.gov/sites/default/files/2015-08/documents/beneficial_uses_of_manure_final_aug2015_1.pdf

A mass balance approach to estimate methane and ammonia emissions from non-ruminant livestock barns

Purpose

Producers are under pressure to demonstrate and document environmental sustainability. Responding to these pressures requires measurements to demonstrate greenhouse gas (GHG) emissions and/or changes over time. Stored manure emissions are a critical piece of livestock agriculture’s contribution to GHG production. Manure sample‐based estimates show promise for estimating methane (CH4) production rates from stored manure but deserve more extensive testing and comparison to farm‐level measurements. Understanding the causes for variability offer opportunity for more realistic and farm‐specific GHG emissions. Improved GHG measurements or estimates will more accurately predict current GHG emission levels, identify mitigation techniques, and focus resources where they are needed. This project offers an innovative approach to improvement of air quality and strengthens engagement by the livestock sector in sustainability discussions.

Although CH4 and ammonia (NH3) emissions from non-ruminant livestock production systems are primarily released from stored manure, current emission inventories (models) do not account for all production and management systems. The purpose of this project was to track flows of nitrogen, volatile solids (VS), and ash into and out of several commercial livestock barns to estimate CH4 and NH3 emissions. Using a mass balance approach, volatile components like nitrogen and volatile solids are supported through simultaneous balances with ash (fixed solids). These mass-balance based estimates can be compared to national inventory emission estimates and serve as sustainability metrics, regulatory reporting, and management decisions.

What Did We Do?

In the initial step of this project, experimental data for VS, the precursor to methane, are compared to fixed estimates in methane emission estimation tools, like the EPA State Greenhouse Gas Inventory Tool (US EPA, 2017).

The litter from a commercial turkey finishing barn housing between 13,000 and 18,000 birds was sampled weekly for one month, with one additional sampling day one month later. VS concentrations were analyzed for each sample and used to estimate total VS production per year assuming six 15,000 bird flocks (Soriano et al., 2022). A range of VS percentage values for deep-pit cattle facilities were taken from Cortus et al. (2021) and converted to total VS production per year. A range of VS concentrations for deep-pit swine manure storage were taken from Andersen et al. (2015) and used to find total VS production per year of that system as well. Next, total VS productions per year were estimated for the same three systems using the State Greenhouse Gas Inventory Tool.

What Have We Learned?

Table 1 summarizes all calculated total VS values and CH4 estimates per year for both the estimation tool and the experimental data. For each of the three systems, the state inventory estimated total VS value falls within the ranges calculated with experimental data, however, the estimates cannot account for the variabilities found within each system. As seen in the experimental total VS values, there can be a large range of VS production due to differences within specific operations of each system. Total VS relates directly to CH4 emissions, so accurate estimates are important for determining greenhouse gas emission potential of a specific operation.

Table 1. All calculated total VS values and CH4 emissions estimates for each of the three systems.
Total VS production (kg/yr) Emissions*
State Inventory Experimental Values m3CH4
Feedlot Steer (500 head) 334,990 260,758 – 1,002,675 1,262**
Grower-Finisher Swine (1,200 head 160,408 107,514  – 216,669 19,050
Turkey (15,000 head) 314,594 206,838 – 359,245 1,699
*Emissions estimates found through the State Greenhouse Gas Inventory Tool
**Feedlot steer emission estimate assumes an open feedlot manure management system

Future Plans

Next steps for this study will include manure sampling at additional commercial turkey barns, deep-pit grower-finisher swine barns, and dairy cattle systems. Similar mass balances will be performed to determine total VS and nitrogen content to calculate CH4 and NH3 emissions from each system. These calculated values will again be compared to outputs of emission estimating tools.

Authors

Anna Warmka, Undergraduate Student, University of Minnesota – Twin Cities, Department of Bioproducts and Biosystems Engineering

Corresponding author email address

warmk011@umn.edu

Additional authors

Erin Cortus, Associate Professor, University of Minnesota – Twin Cities, Department of Bioproducts and Biosystems Engineering

Noelle Soriano, MS Student, University of Minnesota – Twin Cities, Department of Bioproducts and Biosystems Engineering

Melissa Wilson, Assistant Professor, University of Minnesota – Twin Cities, Department of Soil, Water, and Climate

Bo Hu, Professor, University of Minnesota – Twin Cities, Department of Bioproducts and Biosystems Engineering

Additional Information

Andersen, D.S., M.B. Van Weelden, S.L. Trabue, and L.M. Pepple. “Lab-Assay for Estimating Methane Emissions from Deep-Pit Swine Manure Storages.” Journal of Environmental Management 159 (August 2015): 18–26. https://doi.org/10.1016/j.jenvman.2015.05.003.

Cortus, E.L., B.P. Hetchler, M.J. Spiehs, and W.C. Rusche. “Environmental Conditions and Gas Concentrations in Deep-Pit Finishing Cattle Facilities: A Descriptive Study.” Transactions of the ASABE 64, no. 1 (2021): 31–48. https://doi.org/10.13031/trans.14040.

US EPA, OAR. “State Inventory and Projection Tool.” Data and Tools, June 30, 2017. https://www.epa.gov/statelocalenergy/state-inventory-and-projection-tool.

Soriano, N.C., A.M. Warmka, E.L. Cortus, M.L. Wilson, B. Hu, K.A. Janni. “A mass balance approach to estimate ammonia and methane emissions from a commercial turkey barn.” unpublished (2022).

Acknowledgements

This research was supported by the Rapid Agricultural Response Fund. We also express appreciation to farmer cooperators who allowed us to collect data on their farms and shared their observations with us.

Nutrient and Water Quality Outcomes from In-Crop Manure Application to Corn

Purpose

Sidedressing corn with liquid manure is a better application timing to utilize manure nitrogen efficiently. A percentage of fall-applied nitrogen is converted to nitrate-N. The amount converted depends upon soil temperatures and days to incorporation after land application. This nitrate is environmentally lost through leaching or denitrification before corn planting and nutrient uptake. While the total corn nitrogen application rate is reduced by an N credit or measure of soil nitrate through a pre-sidedress nitrogen test, commercial fertilizer will often be applied at corn sidedress time. The combined fall manure and fertilizer N applied results in increased total nitrogen, increasing environmental N loss potential. In-crop manure application has the advantage that any ammonium N applied can offset the total N requirement of the corn crop.

The experimental objectives were to determine the economic, agronomic, and environmental outcomes of in-crop manure application versus a traditional fall manure application.

What Did We Do?

A trial comparing fall to in-crop liquid manure application to corn was established in the fall of 2019 at a USDA-ARS paired Edge-of-Field monitoring site in the Western Lake Erie Watershed. The trial used a before/after impact experimental design. Field one had fall-applied manure, then used UAN at corn sidedress time. The second field had only swine manure applied at corn sidedress timing. Data collected included corn yield, soil test, tissue test, imagery, and nutrient loss through tile and surface runoff. Aerial imagery utilized Normalized Differential Red Edge (NDRE) imagery measure on a 0-1 scale to quantify plant heath.

What Have We Learned?

The total applied nitrogen with fall manure/UAN application was 516 pounds per acre compared to 341 pounds per acre for in-crop manure application. Corn yield was improved by 17 bushels per acre with the in-crop manure application despite a dryer than normal production year where the treatment total yield was 136 bushels per acre. Tissue tests taken at R1 were similar between the two treatments with %N and %P lower than desired ranges. In-crop manure application resulted in a 0.63 NDRE index compared to a 0.60 NDRE index for fall manure/UAN application, indicating better plant health. The in-crop manure application had higher equipment and labor costs that were offset by reduced nutrient cost, plus higher yields improving net return by $95 per acre.

The applied nitrogen not recovered in the grain was 437 and 250 pounds per acre for the fall manure/UAN and in-crop manure application, respectively. Soil samples using a 0-12 core depth were taken after application (June), after harvest (November), and spring of the following year (March and May). Nitrate and phosphorous levels were higher for the in-crop application for all sampling periods prior to the May sampling. By May soil test levels were equal for both nutrients. Both nitrate and phosphorous levels in the 0-12 zone were within expected ranges. The estimated in-crop manure application effects had mixed results for tile and surface water quality outcomes measured in pounds per acre. For tile water DRP (-5%), Nitrates (-35%) were reduced while Total P (7%) increased. The surface water had lower nitrate (73%) but higher DRP (148%) and Total P (43%). Tile water is a greater pathway for offsite water movement.

Future Plans

Wheat was planted after soybean in fall 2021. The anticipated comparison is in-crop manure application compared to fall-applied manure/topdress fertilizer to supply needed N. A second corn in-crop to fall-applied manure/commercial fertilizer comparison is planned for the 2023 crop year. These projects are cooperation with USDA-ARS Soil Drainage Unit and Blanchard Valley Demo Farms.

An Ohio State University Extension initiative is looking at fall applied versus in-crop manure application at 10 paired field sites in 2022 and 2023. A second set of field trials are N rate trials 0-250 pounds of N in manured fields with 5 sites in 2022 and 2023.

Authors

Greg LaBarge, Field Specialist, Agronomic Systems, Professor, Ohio State University Extension

Corresponding author email address

labarge.1@osu.edu

Additional authors

Kevin King, Research Leader and Agricultural Engineer, USDA-ARS Soil Drainage Unit, and Jed Stinner, Hydrologic Technician, USDA-ARS Soil Drainage Unit

Acknowledgements

Blanchard Valley Demonstration Farms

Manure Treatment Technology Adoption by Swine and Dairy Producers: Survey Feedback

Purpose

Sound management of manure is essential to optimize its benefits for soil health and crop production, and to minimize costs and environmental risks. Along with changes in farm scale and practices, modern farms are increasingly looking to process or treat manure to address problem areas and to take advantage of market opportunities on their operations. A variety of manure treatment technologies are available and new technologies continue to be developed for managing nutrients, solids, energy, water, and other components of manure. But, while these new treatment technologies hold potential to improve the environmental, economic, and social sustainability of livestock and poultry production, questions remain regarding producer adoption of treatment systems on their operations. To improve our understanding of decision-making processes employed when producers evaluate and adopt manure treatment technologies, the authors conducted a survey aimed at dairy and swine producers in the Midwest.

What did we do?

Two surveys were developed, one tailored to dairy producers and one for swine producers. All operation sizes and production systems were included. The surveys were administered using Qualtrics, an online survey platform. Questions asked covered manure-related practices in animal facilities, manure handling, and land application. Additional questions asked producers to prioritize their needs for manure treatment, factors influencing technology selection, current technologies being utilized, and principal barriers for adoption. Respondents were asked to select up to three critical outcomes for their farms’ manure treatment technologies, the most influential factors (or technology characteristics) for manure treatment adoption, and the main barriers for technology adoption. The authors collaborated with Nebraska Extension and with state producer associations to reach swine and dairy producers in Nebraska and other Midwest states, with the survey first launched in the fall of 2021. Magazine articles, radio programs, listservs, and social media were used to promote the surveys.

Responses were analyzed using descriptive methods. Eighteen respondents provided information to characterize seven swine farms and ten dairy operations. Swine respondents had farms in Nebraska (7), Iowa (2), and Ohio (1). For dairy, 7 of the farms were in Nebraska and 1 was in Minnesota. Swine farm systems were divided between the ones that had farrowing (farrow-to-finish and farrow-to-wean systems) and the ones without it (grow-to-finish and wean-to-finish systems) (Table 1). Respondents were asked to provide insights for their farms’ primary manure management systems. A dairy operation’s primary manure management system was defined as the one receiving manure from the lactating cows. For swine, the primary manure management system received manure from the gestation sows or the finishing herd. For both swine and dairy, secondary systems were defined as utilizing separate storage and handling facilities.

Table 1. Herd size information of dairy and swine farms represented in the survey responses.
Species and herd type Number of farms Herd size – average Herd size – range
Dairy – lactating cow herd 8 933 30 to 2,150
Swine (farrowing) – sow herd 4 2,762 250 to 7,500
Swine (finishing) – finisher herd 5* 23,600 1,200 to 70,000
Note: *One finishing farm did not share its herd size information.

What have we learned?

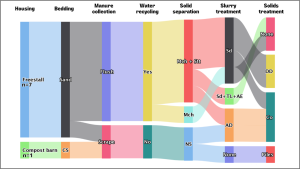
The dairy and swine farms demonstrated differences in manure treatment needs and consequently adopted different treatment technologies (Figures 1 and 2).

Figure 1. Farm characterization and manure management of ten swine farms.
FTF = farrow-to-finish
PSOP = partially slotted open pens
PP = pull-plugs
FTW = farrow-to-wean
ISWPSF = individual stalls w/partial slotted floor
DP = deep pits
GF-F = grow-finish or finishing
ASFB = all slotted-floor building
FL = flushing
WTF = wean-to-finish
CH = chemicals
AE = aeration
LA = lagoons
AD = anaerobic digestion
CO = composting
Figure 2. Farm characterization and manure management of eight dairy farms.
CS = corn stalks
Sd = sedimentation
DD = direct drying
Mch = mechanical
TL = treatment lagoon
Co = composting
Stt = sand settling lane or basin
AE = aeration
NS = no separation
AD = anaerobic digestion

The most-used technologies in the primary manure management system for each industry were: mechanical separation, sand settling lanes, and sedimentation basins for dairy farms; and addition of chemicals, treatment lagoons, and composting for swine operations (Figure 3).

Figure 3. Manure treatment technologies being used in primary manure management systems.

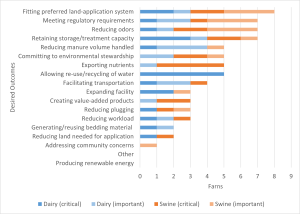
Allowing water to be reused and exporting nutrients were the primary desired outcomes of implementing manure treatment technologies for dairy and swine farms, respectively (Figure 4). Accordingly, 6 of 7 dairy farms were recycling water in their operations, while only 1 out of 10 was doing so on the swine side.

Figure 4. Primary desired outcomes of the implementation of manure treatment technologies in swine and dairy farms.

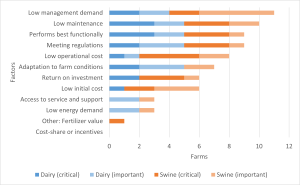
Diverse factors influenced the selection of the implemented technologies in both livestock operations. Low management demand, low maintenance, “performs best functionally” (best performance achieving the desired goals of manure treatment), and low initial cost are among the most-mentioned factors (Figure 5).

Figure 5. Factors that most influenced the selection of implemented manure treatment technologies.

Swine and dairy farmers identified initial cost, operational cost, and return on investment as the primary barriers to future technology adoption (Figure 6). Management demand was another important barrier among swine producers.

Figure 6. Barriers of highest concern when upgrading manure management systems on farms, especially through the adoption of manure treatment technology.

None of the survey respondents used membranes, electrochemical precipitation, or gasification technologies, demonstrating that cutting-edge manure treatment technologies are being more slowly adopted by regional livestock producers. The high cost and potential high management demand of these technologies could be barriers for their adoption.

Future plans

Our research work has moved into qualitative exploration. Focus groups will be held with swine and dairy producers, where they will discuss and share their manure treatment needs and desired outcomes from new treatment options. These activities will be organized online and will allow producers to share their manure management perspectives for the present and future. The results of our surveys and focus groups are being used to inform a decision-support tool being developed as part of the Management of Nutrients for Reuse  (MaNuRe) project. Our findings will also be used to help develop extension programs that meet the needs of producers for manure management in Nebraska and neighboring states.

Authors

Juan Carlos Ramos Tanchez, Graduate Research Assistant, University of Nebraska-Lincoln.

Corresponding author email address

jramostanchez2@huskers.unl.edu

Additional authors

Richard Stowell, Professor of Biological Systems Engineering, University of Nebraska-Lincoln.

Amy Schmidt, Associate Professor of Biological Systems Engineering, University of Nebraska-Lincoln.

Acknowledgements

Funding for this effort came from the USDA NIFA AFRI Water for Food Production Systems program, grant #2018-68011-28691. The authors would like to express gratitude to Dr. Teng Lim and Timothy Canter (University of Missouri), Mara Zelt, and Lindsey Witt-Swanson (University of Nebraska-Lincoln) for their relevant support to this study. We would also like to thank the staff at the Nebraska Pork Producers Association and the Nebraska State Dairy Association for their collaboration on our research.

Can Grazing Systems Affect Plant Available N and P?

Purpose

A large percentage of the carbon (C), nitrogen (N), and phosphorus (P) cattle consume is released or deposited as cattle dung and urine. If we can develop grazing systems that retain these nutrients within the grazing system that is a first step in turning cattle manure into a resource rather than a waste. The second step is distributing the nutrients to the whole of the pasture. The third step is making the complex molecules of N and P plant available. The final step is keeping cattle manure in the grazing system to rebuild soil health.  We explored the impact of two grazing systems we named 1) conventional with hay distribution (CHD) and 2) strategic grazing (STR) on  soil C, N, P, bulk density (soil compaction, BD), and cattle density (CD) with the hypothesis that grazing systems can improve soil health and thereby retain and recycle C, N and P. Said more plainly rather than sacrificing areas of the pasture we hoped to regenerate areas that were less productive (cattle camping areas) and make them more productive.

What Did We Do?

We compared a conventional grazing system, baseline (year 2015) factors: C, N, P, BD, and CD to the same factors after two years of CHD and STR. We took soil samples every 50 m at three soil depths (0-5, 5-10 and 10-20 cm) in 2015 (Baseline) and in 2018 (post treatment). Project design follows:

    • Year 1 – Continuous Grazing in eight ~40 ac (16 ha) pastures
      • Waterers, shade, hay and mineral provided in same location
    • Year 2 and 3 – Improved Grazing systems applied:
      • CHD – 4 of eight in continuous with hay distribution and
      • STR – 4 of eight in strategic grazing
        Mixture of better grazing practices

        1. Manure distribution through Lure management of cattle
          Portable shades, Portable waterers, Portable hay rings
        2. Exclusion of compacted areas vulnerable to nutrient loss
        3. Over seeding of exclusions with forage mix
        4. Flash/Mob grazing of excluded areas for short time
        5. Moderate rotational grazing in the sub-paddocks

What Have We Learned?

We found that both the CHD and the STR significantly increased the amount of N and P in the top 5 cm of soil Figure 1. The increase in plant available N in 2018 (sum of ammonium and nitrate) in the top five cm of soil was 5.6 times more in CHD and 5.8 times more in STR when compared to Baseline (2015) (Dahal et al., 2020). The 2018 increase in plant available P was 6.1 times more in CHD and 4.9 times more in STR compared to 2015. We attribute the greater increase in P in CHD to the greater number of hay bales needed during an extensive drought in 2016 (Subedi et al., 2021).

Figure 1. Plant available P (Mehlich-1, left), plant available N (inorganic N, middle), and carbon (loss-on-ignition, right) during Baseline in black and two years after treatments in red.

The impact of cattle management on bulk density varied greatly depending on where you were in the pasture which depended on improved management system. While there was a slight increase in bulk density in 0-5 cm soil layer from 2015 to 2018 for both CHD and STR the increases were not significant and would not cause any restrictions on forage growth (Figure 2). In the 5-10 cm soil layer, BDs in both the CHD and STR were significantly reduced. The STR did reduce BD slightly more than in the CHD pastures. Percent change in 2018 BD for STR was -10.5 and for CHD was -8.6.

Figure 2 Bulk density (BD) for the 0-5 cm soil layer (left) and the 5-10 cm soil layer (right).

The reduced compaction in the improved pasture management systems is important for several reasons but here we will discuss only the importance on root growth and nitrogen availability. Bulk density or compaction can restrict forage root growth.  During Baseline pastures had median BD values of greater than 1.6 g cm-3 (Hendricks et al., 2019) which can restrict forage growth. After two years of the improved grazing systems BD was reduced to below 1.45 g cm-3 a value which is usually not restrictive to plant growth. We believe that the decrease in compaction allowed rainfall to move manures into the soil and allow for greater microbial activity.  Above we noted the increase in nitrogen and phosphorus but we did not as yet mention the decrease in the Loss-on-ignition (LOI) carbon. The LOI carbon is composed of larger molecules and requires a great amount of microbial activity to break down and release the plant available nutrients within the molecule. We speculate with the reduced bulk density and associated greater ability of rainfall to move nutrients into the soil, the N and P associated with the cattle manure was able to be decomposed into plant available forms of nitrogen and phosphorus. These assumptions are supported with two indicators of soil microbial activity: greater CO2 emissions and an increase in a labile form of carbon (permanganate oxidizable carbon, in 2018 compared to 2015 (Dahal et al., 2020). The labile form of carbon was also found to increase with depth to 20 cm of soil which suggests that the carbon may not be lost to the atmosphere but maybe moving down in the soil profile.

Take-home messages

    • Cattle grazing can increase nitrogen and phosphorus soil content with improved grazing managements practices: hay distribution and strategic grazing practices designed to distribute cattle dung throughout the pasture and away from areas that are vulnerable to erosion.
    • Improved grazing practices can reduce soil compaction when cattle grazing is well distributed throughout the whole pasture.

Future Plans

We were greatly concerned with the decrease in carbon in both improved grazing systems. However, upon greater analysis of our data (in press) we have found additional information to indicate that carbon (LOI and the labile) is moving down the soil profile. We are in process of studying the C, N, P movement to greater depths and the impact this could also have on the grazing system to also capture and retain rainfall.

Authors

Corresponding and first Author

Dr. Dorcas H. Franklin; Professor; Department of Crop and Soil Sciences; University of Georgia; dfrankln@uga.edu or dory.franklin@uga.edu

Presenting Author

Anish Subedi; Department of Crop and Soil Sciences; University of Georgia; as07817@uga.edu

Additional Authors

Dr. Miguel Cabrera; Professor; Department of Crop and Soil Sciences; University of Georgia; mcabrera@uga.edu

Dr. Subash Dahal; Department of Crop and Soil Sciences; University of Georgia; dahal.green@gmail.com

Amanda McPherson; Department of Crop and Soil Sciences; University of Georgia; Amanda.McPherson@uga.edu

Additional Information

Dahal, S., Franklin, D., Subedi, A., Cabrera, M., Hancock, D., Mahmud, K., Ney, L., Park, C., & Mishra, D. (2020). Strategic grazing in beef-pastures for improved soil health and reduced runoff-nitrate-a step towards sustainability. Sustainability, 12(2), 558.

Subedi, A., Franklin, D., Cabrera, M., McPherson, A., & Dahal, S. (2020). Grazing Systems to Retain and redistribute soil phosphorus and to reduce phosphorus losses in runoff. Soil Systems, 4(4), 66.

Hendricks, T., Franklin, D., Dahal, S., Hancock, D., Stewart, L., Cabrera, M., & Hawkins, G. (2019). Soil carbon and bulk density distribution within 10 Southern Piedmont grazing systems. Journal of Soil and Water Conservation, 74(4), 323-333.

Acknowledgements

Funding: This research was funded by NRCS-USDA, Conservation Innovation Grant. Grant number 69-3A75-14-251.

Acknowledgments: The authors are grateful to USDA-NRCS for their assistance with the first-order soil survey, and to the Sustainable Agriculture Laboratory team, John Rema, and Charles T. Trumbo at the University of Georgia for their endless help in the laboratory and the field.

Merits of Manure Content Library

Purpose

The right amount of animal manure in the right location can benefit crops, soil, and water resources.  However, too much manure or manure in the wrong place is an environmental concern.  A recent survey of attitudes from farmers and their advisors on the benefits and barriers for manure use indicates that there is widespread knowledge of manure value for cropping systems, but logistical and community barriers remain. The survey also found that all respondents rated peer-to-peer interactions as the most influential on their decision-making for these topics. Thus, more extension efforts should be focused in assisting AFO managers and advisors to communicate messages on the value of manure and strategies for overcoming barriers, among their specific networks. For example, knowledge of the relationship of manure and soil health benefits is low among some segments. Farmers and their advisors all have very low opinions and understanding of manure’s benefits to environmental quality. Helping farmers, educators, and advisors articulate among themselves and to their rural communities the water quality benefits of organic fertilizers when applied to only meet agronomic needs of the crop may need expanded investments. With these needs in mind a team from the Universities of Nebraska, Minnesota, and Iowa State, and the assistance of the North Central Region Sustainable Agricultural Research and Education program developed a library to provide educators and advisors with access to recommended resources that will assist in the discussion of manure’s benefits and challenges.

What Did We Do?

Consultation among the team identified the following categories of interest for readily accessible educational or outreach materials for manure impacts on:

    1. Soil health and soil quality
    2. Economics of production and yield
    3. Crop fertility
    4. Water quality
    5. On-farm research

And guidance to navigating barriers such as:

    1. Direct costs associated with manure use
    2. Odor and other community issues
    3. Agronomic challenges (such as imbalance nutrients)
    4. Regulations
    5. Logistical issues of application
    6. Using manure in specialty systems (such as organic production)

With the categories for materials established, the team conducted an initial survey of extant educational and outreach materials via general internet searches and review of content available through the Livestock and Poultry Environmental Learning Community. The types of content thus assembled were varied: social media content, video, summaries of research, published extension and scientific journal articles, websites, and other content such as podcasts and decision support tools. All were included since it was intended that these resources be helpful for educators, producers, or others to converse with their own networks easily and confidently on the manure topics identified. The team anticipated that users could use the library to expand their social media activity, and thus their communication networks, or to prepare more confidently to discuss manure via a local radio presentation or discussion with a county board. Or even to add an article to local print media or a blog or personal website. All items included in the library were free to repurpose (with attribution) in local outlets or personal sites.

After consultation, the library was built using Airtable ™, a platform to create low-code databases, tools, or other apps. This platform allows the team to internally build a flexible database of content which can be sorted easily into pre-set categories (for example, topics of specific seasonal relevant), and arrange content into easily perused views to improve the user experience on a platform that could be easily embedded into existing team sites, such as lpelc.org (Figure 1).

Figure 1. The user interface for the merits of manure library, several such sorted views are embedded on the LPELC website for audience exploration by topic, media type, or seasonal relevance. Within each view individual entries can be further searched or sorted to further narrow exploration.

Each entry (Figure 2) in the library has an individual entry card, which includes keywords and text descriptions to improve searchability as well as a downloadable file, or links to the resource where appropriate, and a short example of how this material could be shared in the user’s social media network (recommended twitter text). The team intended to provide library users with not only the educational content, but also the means to improve their own in-network communication on manure topics. Accordingly, when posting to social media, hashtags, mentions and links to other content help (a) reach users who are following a specific topic (e.g., #manure), (b) recognize someone related to the post (e.g., @TheManureLady) and (c) direct users to more content related to the graphic (e.g., URL to online article). For our content library, each item is accompanied by recommended text that can be copied and pasted into the post of a social media engine if desired.

Figure 2. A single-entry page for the library.

What Have We Learned?

Since its launch in 2021 the library has had 343 unique users, average time that each user spends interacting with the library is 129 seconds, a solid interaction time for a website – industry standard is 120-180 seconds. However, we do not have any measure for how time spent on the library page is transformed into use of the library content. It is evident that more work is needed to improve awareness of the tool among audiences of interest. To this end, the team decided to develop a recognizable brand for library materials which might help other potential users to find their way to the site (Figure 3).

Figure 3. Library logo.

Future Plans

Library administrators continue to look for ways to improve the library content, user experience, and awareness of the tool among potential users. An overview of content, accessibility, re-purposing, and submission of relevant material will be shared to publicize the resource, encourage utilization of available materials, and invite submissions of new content relevant to the manure management community.

Authors

Amy Schmidt, Associate Professor, University of Nebraska

Corresponding author email address

aschmidt@unl.edu

Additional authors

Leslie Johnson, Associate Extension Educator, Mara Zelt, Schmidt Lab Project Director, Amber Patterson, Schmidt Lab Media Communications Specialist, and Rick Koelsch, Professor Emeritus, University of Nebraska-Lincoln; Erin Cortus, Associate Professor, and Melissa Wilson, Assistant Professor, University of Minnesota; and Dan Andersen, Associate Professor, Iowa State University

Additional Information

The full library is accessible at https://lpelc.org/value-of-manure-library/.

Acknowledgements

This product was assembled with financial assistance from the North Central Region Sustainable Agricultural Research and Education program.  NCR-SARE is one of four regional offices that run the USDA Sustainable Agriculture Research and Education (SARE) program, a nationwide grants and education program to advance sustainable innovation to American agriculture.

Can we create an accurate manure application map from GPS and manure weight or manure flow data?

Purpose

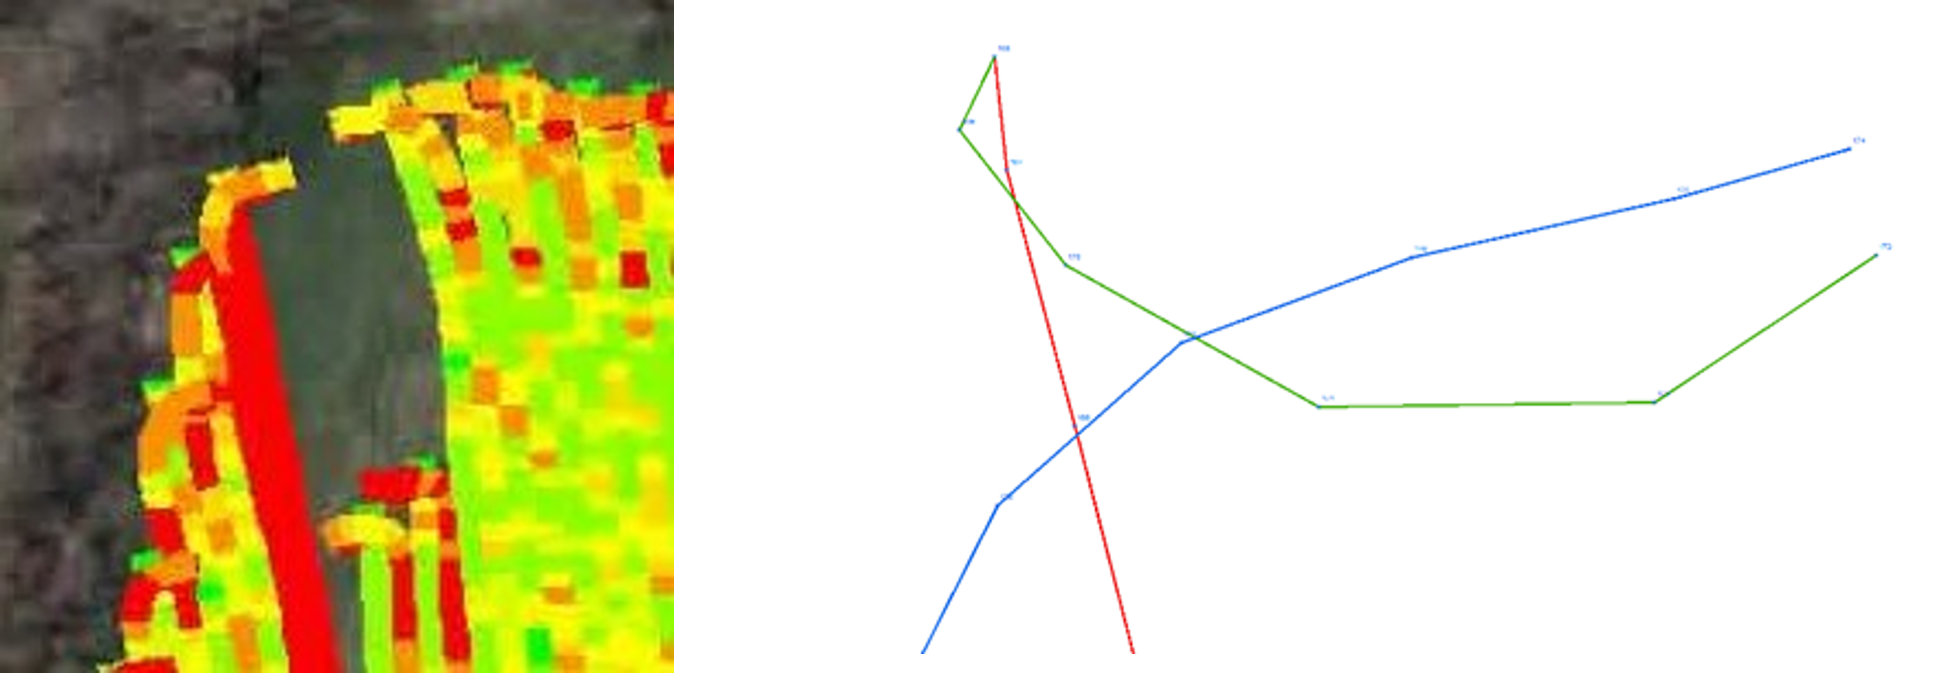
Manure, fertilizer, and other commercially available precision ag maps are not accurately calculating application rates in turns and turnarounds.  This is significant in turn areas, such as field borders or in small fields. In areas where equipment turns or reverses with a k-turn, more product is applied to the inside turn than the outside turn, resulting in more time and application, and significantly changing the application rates in the turn area. The current version of software supplied with GPS equipment UConn Extension purchased in 2020 does not sum material application rates vertically when overlap occurs. The software also does not adjust application rates on the inside and outside of turns to reflect the change in application area covered during a discrete-time interval.  The photo on the left is an example of an as-applied map from the commercial software. The line drawing on the right in the callout box displays the order of the tractor’s movement during the application. The lines represent the path of the tractor using a dragline to apply manure as it performs a K-turn at the end of the pull.  The lines are formed by connecting the GPS coordinates recorded each second. The red line represents the tractor traveling North until it reached the end of the pass. The green line represents the travel path as the tractor backs up to make the K turn.  The blue line is the path of the tractor as it again travels forward to complete the turn and head South again.  The blue and green lines do not connect because a tractor backed up to some point northeast of the end of the green line, stopped and resumed moving forward again, all during the one-second interval between the ends of the green and blue lines.
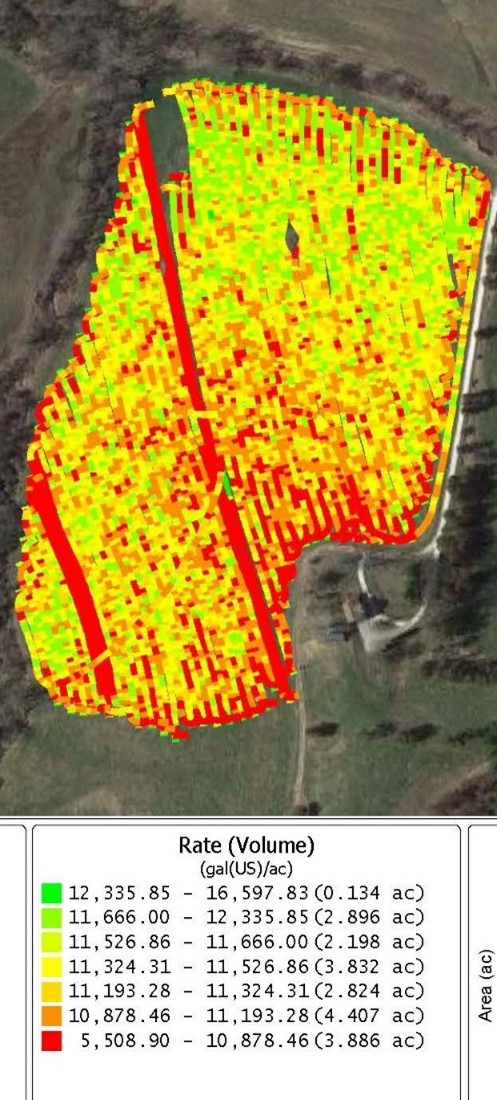
The graphic below is the complete map for the field in the example above. If you look closely, you will see a large number of overlaps where a yellow or orange color passes over a darker red color. This should result in the overlapped region changing to one of the green colors if the rates were being summed vertically by the software.

What Did We Do?

When we realized the maps created by the software were inaccurately representing the results, we began by contacting the company’s tech support center. After exchanging emails and several phone conversations with different individuals, the company indicated that their software was unable to calculate the values we needed. Since the software we had purchased didn’t do what we needed we started asking around to all of the commercial applicators of manure and fertilizer that we knew in the region to see if the software they used provided the functionality we needed in New England. We could find no commercial software package that included the calculations needed to allocate the material correctly in our small fields.

Finding no commercially available software we embarked on what turned out to be a long and arduous process to develop a methodology to create adequate spreading maps ourselves. As faculty members, we have access to ESRI ArcMap which we have used for years to generate field boundary maps, calculate hauling distances between fields and storages, and map farmstead layouts for projects.  We incorrectly assumed that ArcMap would have a ready-made solution for our problem. The process wasn’t as simple as playing connect the dots of the GPS coordinates. The GPS antennas on farm equipment are usually located on the cab of the truck or tractor to protect the antenna and in the case of the tractors to make the GPS available to other pieces of equipment such as planters. The material being applied usually comes out of the back, or side of the spreader some distance from the antenna. Then most application equipment throws the material even further behind the equipment with spinning disks or through pressure pumps, adding even more distance between the antenna and where the material actually hits the ground. To determine these distances accurately we measured numerous pieces of equipment and took a series of measurements between the equipment itself and where the material lands. In the case of manure spreaders, this can be a messy proposition. Once these measurements were completed, it was back to the computer to try to put these on a map. After hand digitizing a couple of hundred data points by drawing reference lines and using measuring tools in ArcMap to generate new points representing the distances behind and to the left and right of the equipment centerline, we finally had polygons to work with. Since we knew the amount of material applied each second, and ArcMap has the necessary tools to calculate the areas of the individual polygons, we could now divide the weight by the area to provide a weight or gallons per square foot of application area. ArcMap also has the tools needed to calculate the cumulative applied material for the overlapped areas by summing vertically through the polygons and summing the rate per square foot value of each layer.

Turns present a different challenge, but the turns cause extreme differences in application rates, so accurate maps require calculating the different application rates on the inside versus the outside of turns. The drawing above illustrates the path of a spreader, in this case a dragline moving North on the right side of the figure, making a 180 degree turn at the end of the row, and heading back south. The numbers in the section of the curve on the upper right reflect the application rates per acre for a fictional piece of equipment with the following characteristics. The descriptive data is real, but it comes from multiple equipment companies. For this example, we used a dragline toolbar that is 60 feet wide with the left and right halves represented by the three arrows on the lines pointing north and south. The dragline has 16 injectors and is fed by a pump capacity of 5,500 gallons per minute. We spent some time watching videos of spreaders at equipment company websites and timing, with a stopwatch, different spreaders as they made turns. This example uses 13 seconds for the toolbar, to make a 180-degree turn. A 5,500 gallon per minute pump pumps 91.7 gallons per second, or a total of 1192 gallons as the vehicle turns around. We divide 1192 in half to separate the left and right sides of the toolbar and you have 596 gallons applied inside and outside the centerline during the turn. Now we need to turn our attention to the area that was covered. The area of a circle is given by the formula Pi times the square of the radius. The area of the 180-degree turn for the inside of a 60-foot toolbar is given by the formula (3.141593 X (30X30))/2 or 1,414 square feet. Using the same formula, the area of the larger 60-foot radius is 5655. To get the actual area covered by the outside half of the toolbar we need to subtract the area of the 30-foot radius half-circle from the 60-foot radius half circle which comes out to 5,655-1,414 = 4,241. Now that we have the areas, we can divide the left and right areas into gallons.
596/1,414 = 0.421 to convert that to gallons per acre multiply by 43,560 = 18,339


596/4,241 = 0.141 X 43,560 = 6,142 or almost exactly 1/3 the amount per acre applied to the inside of the curve.

Given the spreading patterns of modern farm equipment and farmers wanting to ensure complete coverage in a field, overlaps are inevitable. If we are really going to follow the 4R’s of nutrient management, we need better as applied maps that will allow us to know where the manure went, and better more agile fertilizing equipment to only apply fertilizer in the areas of fields that truly need the fertilizer – now that we can identify them on accurate maps. This includes the ability of equipment to lower flow rates on the inside of turns and increase the flow rates on the outside of turns automatically to provide more even spreading rates across the entire field.

What Have We Learned?

Current spreading maps are inadequate for small New England farms. Application overlaps and spreading differentials on the inside and outside of turns result in inaccurate application rates. Current equipment does not account for these differing rates along the turn radii. We have worked out an algorithm and a process to correct for both the turn issue and the overlap issue for straight application such as self-propelled spreaders or toolbars attached to the 3-point hitch of a tractor. The algorithm still needs to be adjusted to connect the polygons representing turns with curved lines rather than the straight lines we currently use. This will improve accuracy incrementally, albeit measurably, since the turn radiuses and the distances involved will only add or remove a few square feet from each polygon which in our hand calculation doesn’t affect the rate per acre more than a few hundred gallons at a time.  We understand the math involved to calculate accurate spreading locations and areas for towed equipment if we have adequate measurements of that equipment and with the caveat that the spreader being towed is always moving forward. In certain cases, such as semi-tractor trailers it is possible for the truck cab, with the GPS attached, to be moving in a circular path – while the rear bogey of the trailer spins in place – which can cause the rear wheels on the trailer to back up during a tight turn.  We haven’t worked out the math on this, and so far, we have found no practical way to calculate this given the state of the equipment.  For semi-trailers we would recommend that GPS antennas be mounted at the front and the rear of the trailers. We need two points to determine the straight line between the points so we can calculate the left and right application distances for where the material hits the ground.

The as-applied map on the next page shows how the current version of our software creates a much more accurate application map from GPS data.  This is the same section of the field shown in the first graphic from the commercial software.  As you can see our solution calculates the areas of overlap and sums the application rates vertically through the layers.  If you look closely at the figure, you will see 3-digit numbers representing the calculated positions of the Left, Right, and Center XY coordinates of the points where the material is hitting the ground each second.  The single-digit numbers reflect the number of times that an individual polygon was applied with manure during the turn maneuver.

<7,500 7,500 – 12,500 12,500 – 25,000 25,000 – 100,000 >100,000 gal/ac
880 2060 6600 2211 1427 ft2
7 16 50 17 11 percent
13,177 Sum ft2 Applied
2350 Total ft2

The table above is calculated using the application rates and the areas of the polygons in the as-applied map.  It basically provides a report card of the application.  The farm intended to apply 10,000 gallons per acre to meet the fertilizer needs of the crop.  We placed an arbitrary interval of 2,500 gallons above or below the target rate as an acceptable variation in the application rate.  This allowed us to calculate that ~15.6% of the area applied received the “correct” rate.  Approximately 6.7% of the area received too little manure and 77.7% of the area received too much manure.  In addition, we calculated that the small area on the inside of the turn that received the most manure per acre received 103,383 gallons per acre, rather than the desired 10,000 gallons per acre.

Future Plans

This year we plan to validate our algorithms for the self-propelled and the farm tractor 3-point hitch mounted spreaders.  We hope to expand the algorithm to tractor towed combinations when we receive data from 2 more farms that installed equipment this winter on their equipment.  We will validate our algorithm’s accuracy by applying manure to fields that have had collection pans pre-located throughout the field.  Once we have the spreading map, we can overlay it onto the data from the collection pans that we will geolocate with handheld RTK GPS equipment before applying the manure.  We would also like to rent a pair of RTK GPS loggers to mount on the front and the rear of a semi tanker to verify the movement of the trailer during extreme turns.

Hopefully, we can develop a mathematical model for the semi turns because the alternative – putting 2 farm equipment type GPS antennas on a trailer, will get expensive.

Authors

Richard A. Meinert, Cooperative Extension Educator, University of Connecticut

Corresponding author email address

Richard.Meinert@uconn.edu

Additional author

Qian Lei-Parent, Research Associate, Department of Extension, University of Connecticut

Acknowledgements

Funding to purchase the GPS equipment provided by a USDA NRCS CT CIG Grant.

Gaseous Emissions from In-house Broiler Litter

Purpose

Broiler litter is a valuable fertilizer but can also be a source of odorous and GHG emissions during production, storage, and land application. Impacts of these emissions are felt by local communities, posing respiratory health impacts and decreased quality of life, as well as increased deposition into soil and water systems. This study seeks to quantify the magnitude of emissions associated with in-house broiler litter and estimate variability across farms. Finally, the study evaluates litter parameters, such as litter age and chemical composition, for gas emission predictors.

What Did We Do?

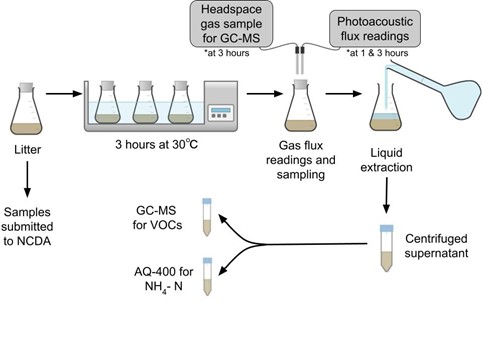
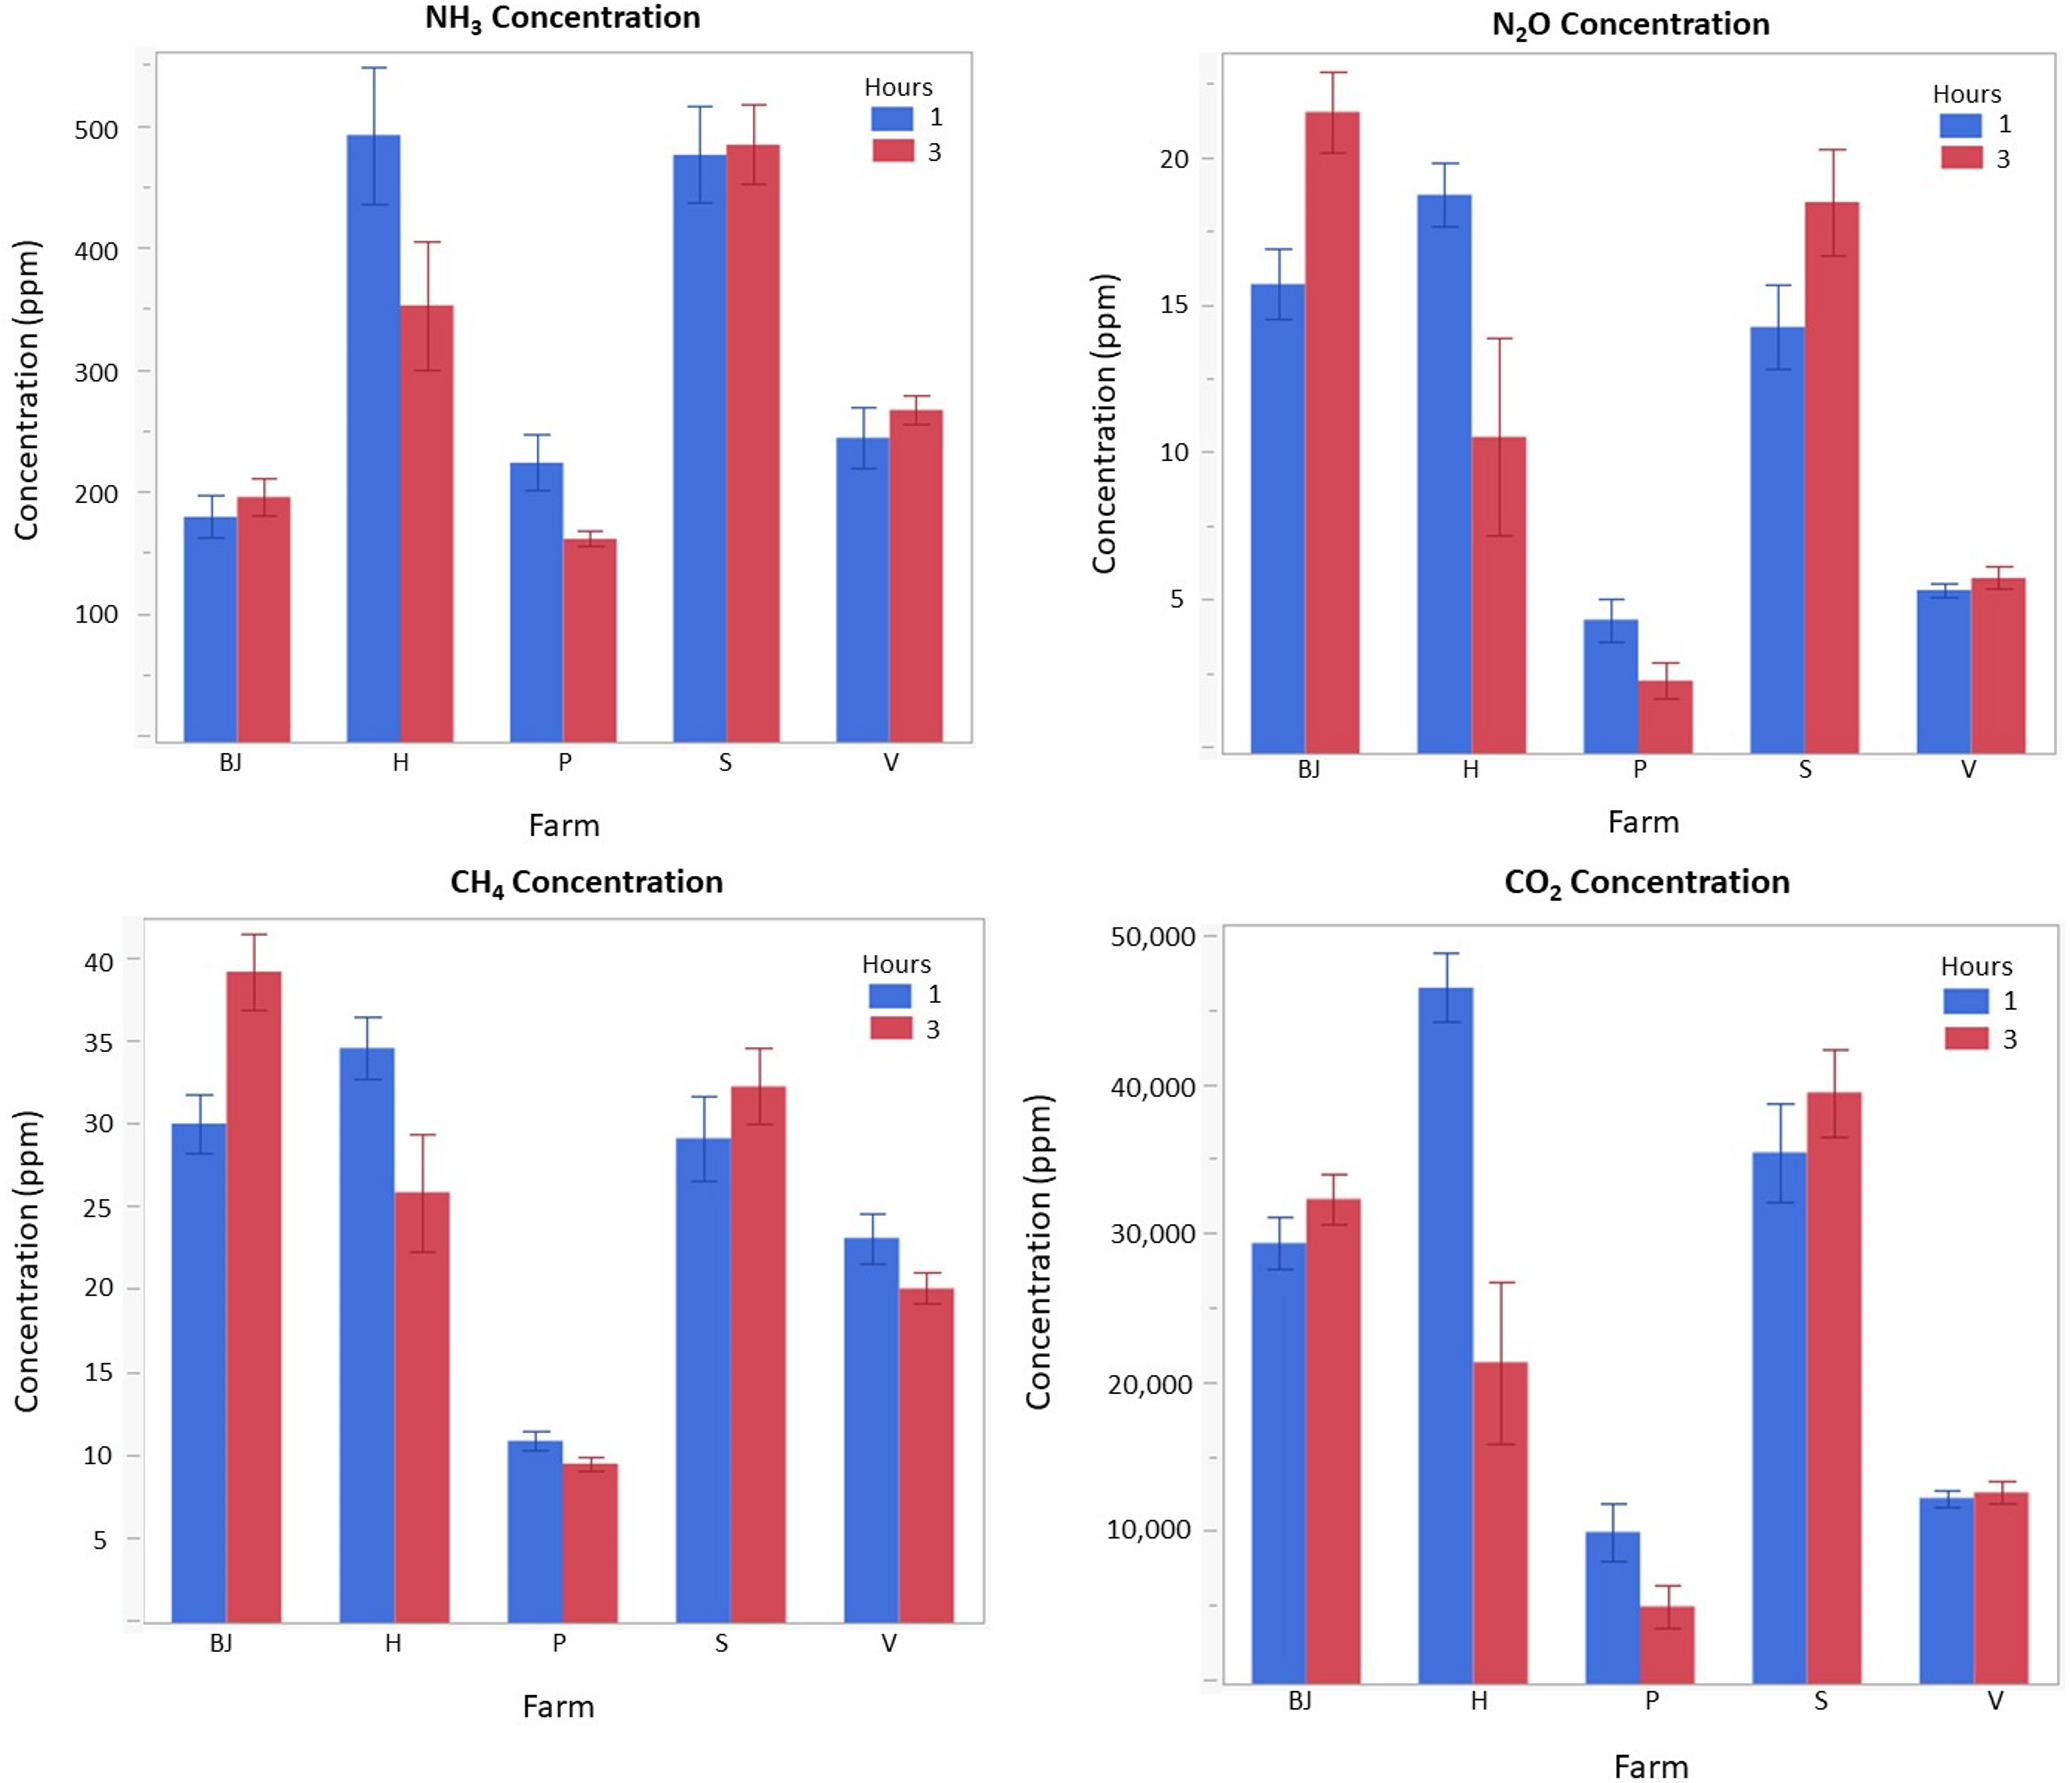
A set of five active broiler houses in North Carolina were sampled to measure gaseous emissions (NH3, H2S, CH4, N2O, CO2, and VOCs) using headspace flux measurement gas samples. Headspace gas concentrations were measured at 1 hour and 3 hours after incubation at 30°C using a photoacoustic analyzer (Innova 1412) for NH3, CH4, N2O, and CO2 and Jerome 631-X was used to measure H2S, concentration. The headspace was also sampled to quantify VOCs associated with odorous emissions. After incubation, water extraction was used to quantify less volatile organic species that are associated with odorous emissions in the litter. Experimental setup is described in Figure 1. Statistical software, JMP, was utilized for analysis of litter composition on NH3, H2S, CH4, N2O, CO2, and VOC gaseous emissions.

Figure 1. Broiler emission experimental setup

What Have We Learned?

H2S emissions were very low (< 0.01 ppm) and did not produce statistically significant observations. There was a wide range of emissions from the litter samples for different gases as shown in Figure 2: 146-555 ppm NH3, 1.5-22 ppm N2O, 4,077-50,835 ppm CO2, and 9.1-43.3 ppm CH4. The differences between farms accounted for 86%, 81%, 76%, and 84% of the variability in NH3, N2O, CO2, CH4 observations, respectively. This could be attributed to differences in integrator and management strategies. Moisture content and age of the litter were the primary contributing factors to increased gaseous emissions from all samples. More specifically, NH3 was largely impacted by pH (p < 0.01), while N2O, CO2, and CH4 were largely impacted by C:N (p < 0.01). Quantitative VOC analysis was difficult due to the number of gases detected by the GC-MS (20+), however the most common species present in the litter samples were a variety of volatile fatty acids, alcohols, phenol, as well as a few amines, ketols, and terpenes.

Figure 2. Photoacoustic flux measurements of litter samples at 1 and 3 hour intervals.

Future Plans

These results will serve as baseline emission readings for odor and emission control strategies. We are currently developing Miscanthus-derived biochar as a poultry litter amendment for emission mitigation in poultry houses. This dataset will inform our decision making to help target gaseous species of top concern in NC broiler litter by methods of physical and chemical biochar modification.

Authors

Presenting author

Carly Graves, Graduate Research Assistant, North Carolina State University

Corresponding author

Dr. Mahmoud Sharara, Assistant Professor & Waste Management Extension Specialist, North Carolina State University

Corresponding author email address

msharar@ncsu.edu

Acknowledgements

Funding for this project is through Bioenergy Research Initiative (BRI)- NC Department of Agriculture and Consumer Services (NCDA&CS): Miscanthus Biochar Potential as A Poultry Litter Amendment

Manuresheds: Pennsylvania Case Study of Strategic Expansion of the Swine and Poultry Industries

Purpose

The manureshed concept considers manure nutrients produced by livestock or poultry and the associated cropland which is needed to assimilate the nitrogen and phosphorus in that manure. An area of surplus manure nutrient production is considered a ‘source’ and the cropland that can accommodate the surplus is termed a ‘sink’. Manuresheds are managed on several scales from farm to county to regional levels. A large group of scientists, led by the USDA-ARS Long-Term Agroecosystem Research Network (LTAR), has explored the manureshed concept for all major animal industries of the US, while considering a wide array of aspects that influence manureshed characteristics and management.

Several manuscripts of the manureshed research team will be consolidated in a special edition of the Journal of Environmental Quality in 2022. Here we present findings from the manuscript focused on the swine industry (Meinen et al., 2022), which evaluates how interactions between manuresheds of different species occur in areas where species inventory overlap occurs. Although in the manuscript we explore dynamics in Iowa, North Carolina, and Pennsylvania, here we focus only on Pennsylvania’s interactions of drivers of expansion of the swine and poultry industries from the years 2000 to 2020. A diversity of factors influenced expansion and therefore the manureshed areas associated with these industries, including social, animal welfare, product quality, and nutrient management forces.

What Did We Do

We explored factors that influenced manureshed shifts for swine and poultry in Pennsylvania over two decades. Historical manureshed source counties for both industries were interconnected and located in the southeastern region of the state.

When siting a new on-farm animal housing facility for swine or poultry, integrators in Pennsylvania often consider the potential impact of odor before contracting with a farm. This places social considerations as a priority, and ahead of nutrient impact considerations in the siting protocol. Since 1999, the Pennsylvania State University has provided a no-cost Odor Site Evaluation Service for any proposed swine or poultry animal farm. The service uses maps, a site visit, and landscape characteristics to predict the potential for odor conflict with neighbors should a proposed animal housing facility be constructed. One swine integrator and one poultry integrator in particular utilized the service before signing contracts with landowners. A favorable Odor Site Evaluation report can assist with local permitting while a negative assessment may lead to site changes or the integrator not signing the contract for public image reasons. Locations of Odor Site Evaluations for swine and poultry were mapped over time at a county level for each industry, to demonstrate differences in locations in which each industry sought to expand (Figure 1). Over time, swine farm locations shifted north and west to where human populations and odor conflict potential were lower, while poultry siting locations remained near historic poultry locations. These north and west locations also coincide with manureshed sink counties where previous commercial swine operations were not historically located. Agricultural survey data (NASS, 2017) demonstrated that swine inventory (Figure 2) mirrored the trends in the Odor Site Evaluation data (Figure 1).

Figure 1. Location of Pennsylvania Odor Site Assessments for swine and poultry by county and over time. Maps show county-level locations of Pennsylvania Odor Site Assessments conducted for swine and poultry farms over five-year periods. The Odor Site Assessment evaluates potential odor conflict risk to neighbors from a proposed farm. From 1999 to 2020 the program assessed 254 swine sites (most for Country View Family Farms) and 275 poultry sites (most for Bell & Evans). Two assessments conducted in 1999 were moved to the year 2000 for graph continuity.


Figure 2: Locations of swine and poultry farms by county in Pennsylvania. Size of circle indicates animal units (1,000 lbs. of animals) of swine plus poultry based on county level inventory (NASS, 2017). Counties with less than 2,000 animal units of swine plus poultry did not receive an animal unit circle. Color represents relative contribution of each species to the total animal units.

What Have We Learned

Evaluation of the expansion of swine and poultry in Pennsylvania over the last 20 years demonstrates that the industries impact manuresheds differently. The swine industry has expanded west and north from historically dense swine manureshed source areas, while poultry industry expansion occurred close to its traditional home.

Contemporary expansion of facilities in the Pennsylvania swine industry is often driven by vertically integrated companies emphasizing animal health as a priority by seeking farm locations that are isolated from other swine facilities, to enhance efficiencies that high herd health status provides to production. Movement of the Pennsylvania swine industry to rural areas with lower densities of human populations assists with the industry’s objective to avoid odor conflict with neighbors, thus suggesting that social forces also shape manuresheds. Swine integrators seek producers that also farm nearby land that can accept manure, since the liquid nature of swine manure inhibits economics of transporting manure nutrients long distances in the current agri-food system. In turn, farmers that desire manure nutrients for cropping operations are expected to be better stewards of manure resources. The resulting impact on swine manuresheds is that expansion favors locally balanced manuresheds associated with each swine operation and shifts new manure sources into sink areas within the state.

Transportation distances to harvest facilities are very different for swine and poultry (Figure 3). A large driver of locating farms of a participating poultry integrator includes the desire to have broilers located within a 90-minute transport distance from the harvest facility to assure animal welfare and product quality. Expansion of the poultry industry has not shifted manure generation away from source counties of the Pennsylvania manureshed. However, poultry’s solid manure is routinely exported from manure nutrient source areas to sink areas through Pennsylvania’s certified manure brokering industry (Meinen et al., 2020).

Figure 3. Transportation distances to harvest for integrators that participated the most in the Pennsylvania Odor Site Assessment Program. Swine travel distances to slaughter are longer than poultry broilers. Blue arrows were arbitrarily placed on the graphic from Figure 2 for illustrative purposes

Future Plans

Smart expansion of animal industries should consider manureshed concepts, which place nutrients in sink areas, but recognize that expansion cannot be influenced by manureshed nutrients alone. Expansion should also consider social forces associated with potential odor conflict, animal health, animal welfare, and animal products. Stakeholders that include producers, integrators, universities, and agencies should work together to strategically influence future manureshed locations and impacts.

On a simple level, and assuming static field-level nutrient use efficiencies, manureshed shifts with expanding industries can occur by 1) relocating animals in nutrient sink areas or 2) transporting manure nutrients out of a source area and to a sink area. The Pennsylvania case study demonstrated that swine industry expansion performed the first strategy and the poultry industry the second strategy. Policies that understand manureshed influences, remove barriers to manure nutrient transport, and facilitate smart expansion can assist with beneficial manureshed management.

Authors

Presenting Author

Robert J. Meinen, Senior Extension Associate, The Pennsylvania State University, University Park, PA.
rjm134@psu.edu

Additional Authors

    • Sheri Spiegal, Range Management Specialist, USDA-ARS, Jornada Experimental Range, Las Cruces, NM.
    • Peter J.A. Kleinman, Research Leader/Soil Scientist, USDA-ARS, Soil Management and Sugar Beet Research Unit, Fort Collins, CO.
    • K. Colton Flynn, Research Soil Scientist, USDA-ARS, Grassland Soil and Water Research Laboratory, Temple, TX.
    • Sarah C. Goslee, Ecologist, USDA-ARS, Pasture Systems and Watershed Management Research Unit, University Park, PA.
    • Robert E. Mikesell, Teaching Professor and Undergraduate Program Coordinator of Animal Science, The Pennsylvania State University, University Park, PA.
    • Clinton Church, Research Chemist, USDA-ARS, Pasture Systems and Watershed Management Research Unit, University Park, PA.
    • Ray B. Bryant, Research Soil Scientist, USDA-ARS, Pasture Systems and Watershed Management Research Unit, University Park, PA.
    • Mark Boggess, Center Director, USDA-ARS, US Meat Animal Research Center, Clay Center, NE.

References

Meinen, R.J., Spiegal, S., Kleinman P.J.A., Flynn K.C., Goslee S.C, Mikesell, R.E., Church, C., Bryant, R.B., and Boggess, M. 2022. Opportunities to Implement Manureshed Management in the Iowa, North Carolina, and Pennsylvania Swine Industry. Journal or Environmental Quality. Published March 2022 for upcoming Special Edition of JEQ. https://doi.org/10.1002/jeq2.20340

Meinen, R.J., D. A. Wijeyakulasuriya, M. Aucoin, and J. E. Berger. 2020. Description and Educational Impact of Pennsylvania’s Manure Hauler and Broker Certification Program. J. Extension 58: 2, v58-2rb4. https://archives.joe.org/joe/2020april/rb4.php

NASS. USDA, National Agricultural Statistics Service. 2017. 2017 United States Census of Agriculture. Census Full Report. National Agriculture and Statistics Service Database. United States Department of Agriculture Agricultural Statistics Board, Washington, DC. Available online: https://www.nass.usda.gov/Publications/AgCensus/2017/index.php

Acknowledgements

This research was a contribution from the Long-Term Agroecosystem Research (LTAR) network. LTAR is supported by the United States Department of Agriculture, which is an equal opportunity provider and employer.


The authors are solely responsible for the content of these proceedings. The technical information does not necessarily reflect the official position of the sponsoring agencies or institutions represented by planning committee members, and inclusion and distribution herein does not constitute an endorsement of views expressed by the same. Printed materials included herein are not refereed publications. Citations should appear as follows. EXAMPLE: Authors. 2022. Title of presentation. Waste to Worth. Oregon, OH. April 18-22, 2022. URL of this page. Accessed on: today’s date.

Evaluating Full-Scale Greenhouse Systems for Lagoon Sludge Drying and Pathogen Reduction

Purpose

This study aims to assess the performance of solar greenhouse drying as a management strategy for swine lagoon sludge. In North Carolina, swine lagoons are heavily concentrated in a small geographic area (Figure 1), which overlaps with a high concentration of poultry operations. This results in a challenge for identifying suitable acres for sludge application, particularly for nursery operations with high concentrations of zinc (Zn) in the sludge. Drying the sludge creates opportunity for long-distance transportation, further processing to produce marketable granules/pellets, as well as co-firing to produce energy and concentrate minerals in ash form. While a useful strategy, drying is an energy-intensive process and often requires significant capital investment and trained operators, both of which are a barrier for on-farm adoption. Solar drying using greenhouses is a low-cost technology that requires minimal oversight and management. While successfully adopted in wastewater treatment applications, solar drying has not been fully evaluated in manure management contexts.

Figure 1. Distribution of swine operations (red dots) in Eastern North Carolina (Source: NC Department of Environmental Quality)

What Did We Do?

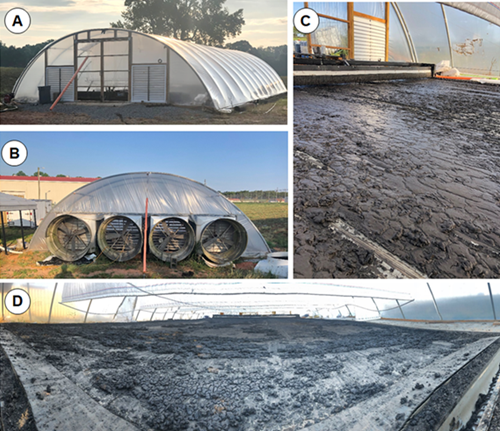
Figure 2. Novel lagoon sludge drying system showing: (A) entrance and air inlet louvers, (B) exhaust fans, (C) sludge layer at beginning of drying test, and (D) panoramic view of drying bed at end of drying test.

We conducted two sludge drying tests in Summer 2021 using a greenhouse structure we built on NC State University campus (Figure 2). The tests utilized freshly dredged sludge with a total solid concentration of 8%. The sludge was in a pumpable state and was applied to the drying bed in a uniform layer. The drying bed consists of a concrete floor (17m long, 6 m wide) with a sweeping mechanism to level the sludge and facilitate removal at the study termination. Two different loading rates were tested in this study: 13.9 kg-m-2 (low loading density test), and 28.3 kg-m-2 (high loading density test). Only the two middle fans for the greenhouse structure were operated continuously during the testing period. Each fan had a nominal flowrate of 20,000 cubic feet per minute. The sweeping mechanism was operated twice daily to mix the material in the drying bed. Temperature and relative humidity were monitored inside the greenhouse structure near the air inlet, at the middle of the building, and near exhaust fans. Ambient conditions were monitored using an on-site weather station. At the completion of each test, the recovered material was analyzed for moisture, nutrient, ash, and energy content.

What Have We Learned?

The daily weather conditions during the two drying tests are summarized in Table 1. Ambient temperature and relative humidity within the greenhouse structure were greater for the high-loading density test than the low-loading density test by around 3℃ and 17% relative humidity points, respectively. This data suggests favorable drying conditions for low loading density. Wide variability in weather conditions during the spring and summer seasons in North Carolina are common and likely to be a significant factor in the performance of similar drying systems.

Table 1. Daily weather conditions during test periods (Source: Lake Wheeler Road Field Laboratory Weather station)

Test Date Temperature (C) Relative Humidity (%) Rain (mm)
Avg. Solar Radiation (W.m-2) ETo* (mm)
Mean Max. Min. Mean Max. Min.
Low Loading Density 5/19 20.2 28.3 11.2 55.5 91.7 25.1 0.0 334.3 5.2
5/20 22.0 29.8 11.4 54.9 91.9 27.5 0.0 318.5 5.5
5/21 20.9 27.8 14.7 47.8 78.2 22.6 0.0 296.4 5.7
High Loading Density 5/25 22.9 29.6 17.6 76.7 92.5 53.0 0.0 211.3 4.2
5/26 26.3 34.3 20.6 65.4 86.4 34.4 0.0 281.4 6.1
5/27 26.5 33.5 18.9 70.4 86.6 42.4 0.0 280.2 5.8
5/28 25.9 33.0 18.7 62.1 91.3 30.5 1.8 267.7 6.4
5/29 20.8 30.3 12.4 76.0 43.0 43.0 1.8 162.8 4.6

*Penman-Monteith Estimated Evapotranspiration at 2-meter height

Cross-greenhouse variability in air temperature and relative humidity was greatest between sunrise and sunset (7AM and 6PM) indicating active drying. Mechanical mixing of the sludge (Figure 3, denoted by vertical yellow lines) appears to have had a positive impact on the drying process as evidenced by the increase in average air temperature and relative humidity after mixing. This effect can be attributed to exposing more water-saturated sludge to drying air, which increases the moisture gradient, thus boosting convective drying. In addition, wet sludge is darker in color, which increases its radiation heat absorption.

Figure 3. Average greenhouse temperature (upper) and relative humidity (lower) during high-loading test. Vertical yellow lines indicate drying bed turning using the mechanical sweeping mechanism.

For the high-loading rate test, observing temperature and relative humidity on Day 4 (Figure 3) during daytime (hours 77 to 80) indicates the drying process has slowed down considerably with average air temperature and relative humidity inside the greenhouse closely matching inlet air. These observations suggest that accessible water in the sludge has been effectively removed.

Moisture content of sludge in the low-loading rate test decreased by 88% over 46 h while the high-loading rate treatment yielded a 91% reduction in moisture over 101 h. Using the starting total solids content of 7.9%, Using the drying bed dimensions and test duration, the average drying rates observed were 0.26 and 0.25 kgH2O.m-2.h-1 for low and high loading density tests, respectively. Over the drying duration, the average evapotranspiration, estimated using Penman-Monteith equation, was 0.23 kgH2O. m-2.h-1 (with a standard deviation of 0.03 kgH2O. m-2.h-1) which is 9% and 13% lower than observed evaporation rates for low and high loading density tests. These observations indicate the depth of material addition had minimal effect on the drying rate. In addition, these observations suggest the combined effect of mechanical ventilation and energy gain due to the greenhouse effect, increased the evaporation rate beyond average evaporation rate estimates. The air use efficiency was estimated as the amount of water removed during the test to the maximum amount of water removable (i.e., resulting in drying air saturation). Air quality at inlet and exhaust were used to estimate moisture ratio at both points. The air use efficiency for low and high sludge loading density were 21.1% and 21.0%, respectively.

Future Plans

These findings suggest opportunities to improve the drying efficiency. We are currently assessing different controllers in terms of their ability to manage mechanical ventilation to minimize energy use in low-drying conditions. Similarly, we are planning a series of tests to capture seasonal weather conditions. Gaseous emissions (ammonia and greenhouse gases (GHG) will be evaluated on full scale operation). Pathogen count for the starting and ending material will be quantified and reported to assess any risk associated with wider distribution of the dewatered material. Currently, a full-scale sludge drying compound (929square meters) has been built and operated on a swine operation in Eastern North Carolina. Our team is collecting data on the system operation and will be reporting system performance and energy use in upcoming meetings.

Authors

Mahmoud Sharara, Assistant Professor and Extension Specialist, North Carolina State University
msharar@ncsu.edu

Christopher Hopkins, Research Associate, Department of Forest Biomaterials, College of Natural Resources, NC State University
Joseph Stuckey, Research Operations Manager, Animal Poultry Waste Management Processing Facility, Prestage Department of Poultry Science, NC State University

Additional Information

https://animalwaste.ces.ncsu.edu/2021/08/drying-sludge-critical-to-improving-nutrient-distribution-and-utilization/

Acknowledgements

  • NC Department of Agriculture and Consumer Services, Bioenergy Research Initiative (BRI) – Contract No #17-072-4015, Potential for Integrating Swine Lagoon Sludge into N.C. Bioenergy Sector
  • Virginia Pork Council, Optimizing Greenhouse Drying of Swine Lagoon Sludge to Support Implementation in NC and VA.


The authors are solely responsible for the content of these proceedings. The technical information does not necessarily reflect the official position of the sponsoring agencies or institutions represented by planning committee members, and inclusion and distribution herein does not constitute an endorsement of views expressed by the same. Printed materials included herein are not refereed publications. Citations should appear as follows. EXAMPLE: Authors. 2022. Title of presentation. Waste to Worth. Oregon, OH. April 18-22, 2022. URL of this page. Accessed on: today’s date.