
Composting Pen Pack Cattle Manure for Improved Nutrient Transport

Purpose

The overall purpose of this research was to demonstrate the volume, weight and moisture reduction from composting pen pack cattle manure so that organic nutrients can be transported farther from the livestock barn. Simultaneously, through laboratory analysis, the goal was to measure the nutrient density of the compost from the start of the process to the finish. The reduction in volume will allow cattle farmers to store more manure in their dry stack (manure) barns to be land-applied at more ideal times, thus avoiding winter application on frozen and/or snow-covered ground.

Due to the overwhelming weight and volume logistics of unprocessed (raw) manure in general, often the manure is land-applied to fields relatively close to the livestock barn. This phenomenon has historically resulted in some fields or areas within fields that have high or luxury levels of soil test phosphorus and potassium. Manure is a great source of nutrients and organic matter for crop production. Avoiding application of manure on fields that are farther from the livestock barn can result in lower soil health and missed economic opportunity for these fields. Once a drier, more nutrient-dense compost is created, a second purpose of the research is to promote transfer of the compost to fields that are farther from the livestock barn or to fields with lower soil test phosphorus or potassium levels.

A final purpose of the research is to utilize compost in corn production systems to evaluate its benefit when applied at the same nutrient rate as its raw manure or commercial fertilizer counterparts. When manure or compost are added to a crop production system, the health and biology of the soil are improved.

What Did We Do

The study began by working with local cooperators who currently raise cattle and manage manure nutrients. This peer learning group included five (5) cooperators. Each cooperator was asked to build at least one windrow of pen pack (solid, dry bedded) manure removed from their cattle barn. The windrow was not to exceed 6 feet in height by 12 feet in width and could be of any length. All manure was weighed at the start of the composting process and then at the end of the process to measure weight reduction. To measure volume, windrows were measured (height x width x length) at the start and finish; cooperating farmers recorded ‘trucks in’ and ‘trucks out’. The five cooperators built eight (n=8) windrows for the purpose of this study.

For baseline data, all cooperators were asked to dedicate one windrow for weekly mechanical compost turning inside a dry stack barn for eight (8) weeks. Any additional windrows composted were to address research questions raised by cooperators. Two ‘additional’ windrows were turned every 2 weeks and a third ‘additional’ windrow was turned weekly, but in an outdoor setting. Mechanical composting was achieved with an HCL Machine Works pull-type compost turner (Figure 1). The compost turner accomplished two key things: consistently mixing compost ingredients (manure, sawdust, wheat straw), and adding oxygen into the composting system. The compost turner was pulled by a Case IH 190 Magnum tractor equipped with a continuously variable transmission (CVT). The CVT allowed for critical ultra-slow speeds (.05-.15 mph) necessary for early mixing passes with the compost turner and raw ingredients.
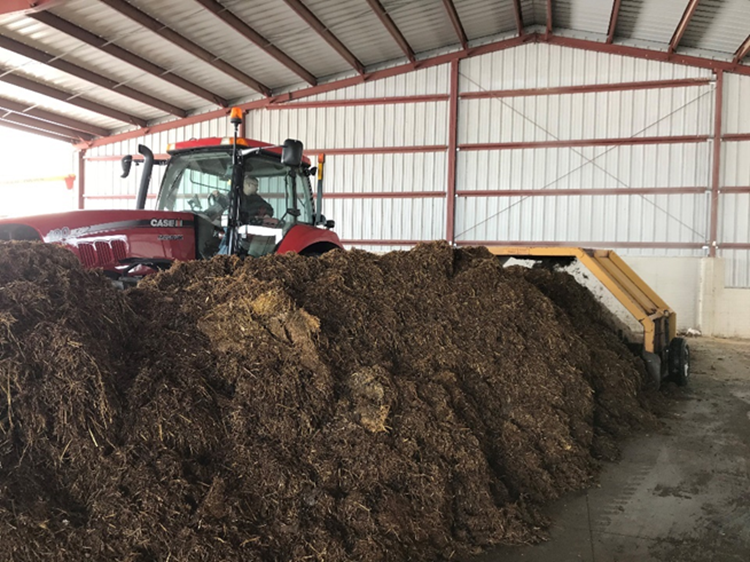
Figure 1. A pull-type compost turner (6 foot x 12 foot) used for this study

Another significant part of the research was manure nutrient analysis. Every windrow site (n=8) had 3 samples pulled for analysis: once at the start of composting, after every compost turn (6-8 turns on average) and when the compost was land applied or at the last turn. Key nutrients analyzed were nitrogen, phosphorus, potassium, sulfur and calcium. Additionally, temperatures were monitored using a 36” dial compost thermometer (Figure 2) prior to every turn to ensure adequate composting temperatures (120-140 deg F ideally) were maintained. Each windrow also had a HOBO temperature logger inserted in the center of the pile for temperature logging every 15 minutes for the duration of the process.

Figure 2. Compost thermometers (36”) were used to double-check pre-turn temperatures each week

Finally, cooperators were asked to work with the researcher to develop a replicated field trial in field corn utilizing the finished compost product from their farm. Generally, the goal of the field trials were to compare a ‘normal’ rate of manure against a half rate of compost (Figure 3). Yield and moisture data from field trials were collected and analyzed.
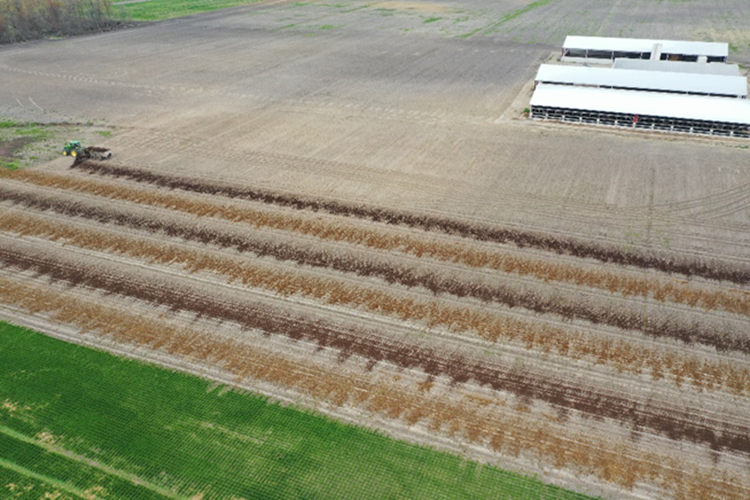
Figure 3. Land application of manure (light in color) and compost (dark in color) for replicated strip trials in corn.

What Have We Learned

This research began with an aggregated 258 tons of unprocessed (raw) pen pack cattle manure among 8 sites (windrows) and yielded 121 tons of finished compost, a 53% reduction in weight. However, the volume reduction was less significant than the reduced weight. The number of ‘trucks in’ versus ‘trucks out’ resulted in 28% reduction in volume. The average initial moisture of raw manure was 66% as compared the average final moisture of 48%.

Cooperators turned compost for a minimum of five weeks with some turning up to eight weeks. The average number of turns was seven weeks for each of the eight windrow sites.

The starting nutrient analysis of the manure on a per ton basis was 8 lbs total nitrogen (TKN), 8 lbs phosphorus (P), 14 lbs potassium (K), 1.5 lbs sulfur (S), and 4.5 lbs Calcium (Ca). The finished compost averaged 7.5 lbs TKN, 20 lbs P, 31 lbs K, 3 lbs S, and 12 lbs Ca per ton. Except for total nitrogen, nutrient density more than doubled for these key nutrients as a result of the composting process (Figure 4). It is assumed that nitrogen was consumed in the composting process resulting in increased organic matter and organic carbon.

Figure 4. Density of key nutrients doubled for phosphorus, potassium, sulfur and calcium from the start of composting to the finished product (n=8 sites)

Temperatures were monitored weekly and temperature data indicated that only one windrow dropped below 100 degrees Fahrenheit during the 8-week process. This windrow was smaller than the others and the compost was happening in below freezing temperatures that occurred in the month of February 2021.
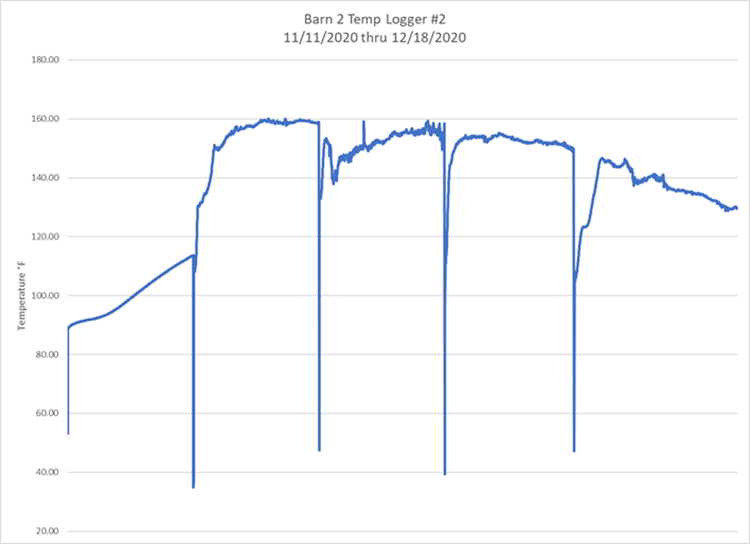
Figure 5. Buried temperature loggers monitored compost temperatures throughout the research. Temperature drops resulted when loggers were removed for compost turning and then replaced

Finally, three replicated field trials were conducted in field corn to compare full rates of manure versus half rates of compost (Tables 1, 2, 3). One more comprehensive trial included a university recommended fertilizer rate as well (Table 4). On average, the compost was hauled 4.5 miles from the livestock barn, thus giving some promise to improved transport of manure/compost to farther field locations. The results below are from one year of data at each respective site and should be interpreted as such.

Table 1: Site 1 – Corn for grain
Treatments Harvest Moisture (%) Yield (bu/acre)
10 tons/ac MANURE 17.5 252 a
5 tons/ac COMPOST 17.8 245 a
LSD: 11.5, CV 2.0
Table 2: Site 2 – Corn for grain
Treatments Harvest Moisture (%) Yield (bu/acre)
Check (no manure or compost) 18.0 258 a
6 tons/ac MANURE 17.9 259 a
3 tons/ac MANURE 18.1 258 a
LSD: 9.7, CV 2.1
Table 3: Site 3 – Corn for silage
Treatments Harvest Moisture (%) Yield (bu/acre)
10 tons/ac MANURE 57.8 23.8 a
5 tons/ac COMPOST 57.8 22.7 a
LSD: 1.7, CV 3.1
Table 4: Site 4 – Corn for grain
Treatments Harvest Moisture (%) Yield (bu/acre)
Fertilizer (22-52-120-12s/ac) 17.6 190 b
10 tons/ac MANURE 17.7 213 a
5 tons/ac MANURE 17.5 202 ab
LSD: 14.9, CV 4.3

Future Plans

Future plans include adding 4-5 more windrow sites before this 2023 grant expires. In 2022 and 2023, the hope is to compare static windrows versus those that are turned mechanically. In the first 8 sites, compost turning was based on time (weekly or bi-weekly turn). In the future, oxygen level or temperatures should be evaluated to help determine timing of turning. From a crop yield perspective, measuring soybean yields in the year following corn where the compost, manure or fertilizer was applied would be informative for growers as they make decisions about improving placement (transport) of manure or compost further from the livestock barn or to fields that have low soil test phosphorus or potassium. Finally, a complete economic analysis of the composting plus further transport needs to be conducted via a case study model.

Authors

Eric A. Richer, Assistant Professor and Extension Educator, Ohio State University Extension
richer.5@osu.edu

Additional Authors

-Jordan Beck, Water Quality Extension Associate, Ohio State University Extension
-Glen Arnold, Field Specialist, Manure Nutrient Management, Ohio State University Extension

Additional Information

Hawkins, E. et al. 2021 eFields Report. Retrieved from https://digitalag.osu.edu/efields

OSU Extension Facebook and Twitter pages: www.fulton.osu.edu

Acknowledgements

This work is supported by a Great Lakes Sediment and Nutrient Reduction Program grant. Thanks to the five cooperating farmers who participated in this research study with Ohio State University Extension. Thanks to Stuckey Brothers Farms for use of compost turner and Redline Equipment for rental of Case IH 190 Magnum tractor.


The authors are solely responsible for the content of these proceedings. The technical information does not necessarily reflect the official position of the sponsoring agencies or institutions represented by planning committee members, and inclusion and distribution herein does not constitute an endorsement of views expressed by the same. Printed materials included herein are not refereed publications. Citations should appear as follows. EXAMPLE: Authors. 2022. Title of presentation. Waste to Worth. Oregon, OH. April 18-22, 2022. URL of this page. Accessed on: today’s date.
Overview of ODA’s Division of Livestock Environmental Permitting

Purpose

The purpose of this presentation is to provide a complete overview of ODA’s Division of Livestock Environmental Permitting (“ODA-DLEP”). ODA-DLEP regulates any livestock facility in Ohio that has the following number of animals or greater:

    • 700 mature dairy cows
    • 1,000 beef cattle or dairy heifers
    • 2,500 swine weighing more than 55 pounds
    • 10,000 swine weighing less than 55 pounds
    • 82,000 layers
    • 125,000 broilers or pullets
    • 500 horses
    • 55,000 turkeys

What Did We Do

Ohio Department of Agriculture’s Division of Livestock Environmental Permitting (“ODA-DLEP”) regulates the siting, construction, and operation of Ohio’s largest livestock facilities, referred to as Concentrated Animal Feeding Facilities (“CAFF”). ODA-DLEP’s primary objective is to minimize any water quality impacts, including both surface and ground waters, associated with the construction of new or expanding CAFFs, as well as implementation of best management practices once a CAFF becomes operational. These best management practices include management of manure, insect and rodent control, mortality management, and emergency response practices. ODA-DLEP issues Permits to Install (for construction) and Permits to Operate (for operations).

In addition, ODA-DLEP conducts routine inspections of each CAFF at least once a year, responds to complaints, and participates in emergency response. Inspections are conducted to review a CAFF’s compliance with Ohio Revised Code 903 and Ohio Administrative Code 901:10, the laws and regulations governing Concentrated Animal Feeding Facilities.

Finally, ODA-DLEP administers the Certified Livestock Manager program. Any individual in the State of Ohio that manages 4,500 dry tons of solid manure or 25 million gallons of liquid manure is required to be a Certified Livestock Manager (“CLM”).

What Have We Learned

Livestock operations continue to get larger and more concentrated and as a result, regulations are necessary to ensure proper handling and management of manure, particularly with land application of manure.

Future Plans

Over the past several years, DLEP has started to see more interest in manure treatment technologies. This could include, but is not limited to, anaerobic digestion, nutrient recovery, solids separation, and wastewater treatment. Technologies like this could greatly alter the landscape of the livestock industry by fundamentally changing the way manure is handled and how nutrients from manure are applied. DLEP does have regulations in place to account for manure treatment technologies. However, regulations, and specifically changes to regulations, cannot maintain the same pace as these technological advancements.

Authors

Samuel Mullins, Chief of ODA-Division Livestock Environmental Permitting
Samuel.mullins@agri.ohio.gov

Additional Information

https://agri.ohio.gov/divisions/livestock-environmental-permitting
https://codes.ohio.gov/ohio-administrative-code/901:10
https://codes.ohio.gov/ohio-revised-code/chapter-903

Videos, Slideshows and Other Media

ODA Division Spotlights – Division of Livestock Environmental Permitting 1

ODA Division Spotlights – Division of Livestock Environmental Permitting 2


The authors are solely responsible for the content of these proceedings. The technical information does not necessarily reflect the official position of the sponsoring agencies or institutions represented by planning committee members, and inclusion and distribution herein does not constitute an endorsement of views expressed by the same. Printed materials included herein are not refereed publications. Citations should appear as follows. EXAMPLE: Authors. 2022. Title of presentation. Waste to Worth. Oregon, OH. April 18-22, 2022. URL of this page. Accessed on: today’s date.
Assessing the implications of chloride from land application of manure for Minnesota waterways

Purpose

Rising chloride contamination in ground and surface waters is a growing concern in Minnesota. Previous studies estimate 87% of the chloride load originated from road salts, fertilizers, and wastewater treatments plants, and 6% from livestock manure. However, these estimates may be outdated as the livestock industry and manure application practices have evolved since these estimates of manure chloride concentrations were calculated in 2004. It also remains unclear how varying soil types affect the movement of chloride leaching following manure application. The aim of this study is to understand the movement of manure-based chloride from liquid and solid manures in Minnesota soils through a series of intact core leaching studies. Specifically, this project examines the magnitude of chloride leaching from swine and turkey manure application and compares it with synthetic potassium chloride fertilizer and a no nutrient control. The soil cores represent fine and medium textured soil.

What Did We Do?

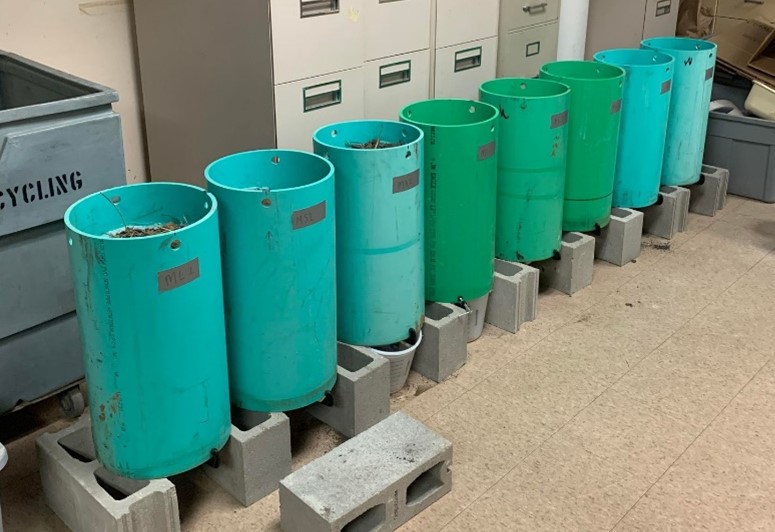
    • Collected 24 12-inch soil columns from medium and fine-textured soils in Minnesota (Figure 1).
    • Collected swine and turkey manure from Minnesota farms
    • Analyzed soil pre- and post-leaching study for nutrient analysis (Cl−, Bray P, NH4+, NO3−, K, Organic Matter, pH, and Exchangeable Ca, Mg, Na, K)
    • Analyzed manure samples for nutrient analysis pre-application (Total N, P2O5, K2O, Cl−)
    • Added water to cores until they reached field capacity
    • Applied manure using N-based application rates, and fertilizer using a K-based rate to 3 replicates
    • Simulated 2-in rainfall events on days 4, 12, and 18 post nutrient application
    • Collected and analyzed leachate for Cl−, NH4+-N, and NO3−-N
Figure 1: Setup of 12-inch PVC soil cores for leaching study

What Have We Learned?

    • How chloride concentration varies based on manure type and species
    • How the total amount of chloride applied via fertilizer application to cores varies by treatment
    • How manure-based chloride moves through soil
    • How fine and medium textured soil influences the movement of manure-based chloride
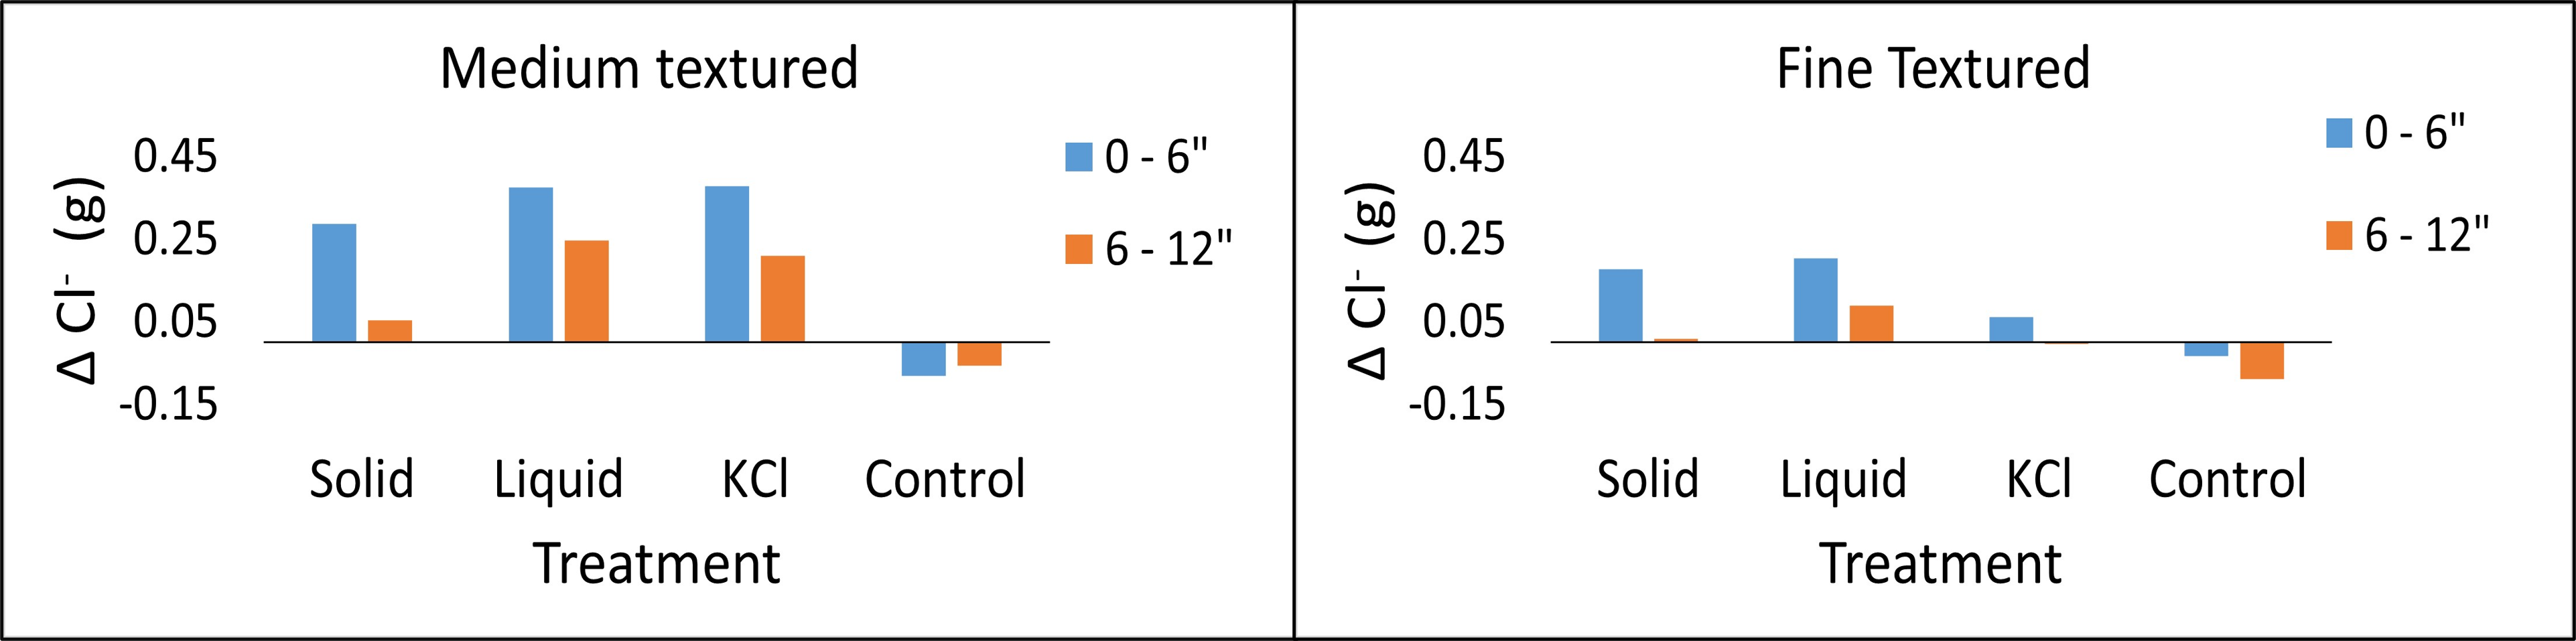
    • How chloride storage changed by soil type following the experiment (Figure 2)
      1. Medium textured soils had a greater change in chloride storage in both top and bottom layers compared to fine textured soils
      2. Manure additions increased chloride storage in both medium and fine textured soils
      3. Control soil cores experienced a loss in chloride storage following leaching
Figure 2: Change in soil chloride storage in each medium textured (left) and fine textured (right) soils by treatment. Positive values indicate a net gain in soil chloride, while negative values indicate a net loss in soil chloride following leaching.
Table 1: Total Cl− concentration of liquid swine manure (lbs/1000 gallons), solid turkey litter, and synthetic KCl (lbs/ton) followed by total weight (g) of Cl− added per core via application.
Treatment

Cl− (lbs/1000 gallons)

Cl− (lbs/ton)

Cl− added per core (g)

Liquid

26

–

1.49

Solid

–

2.7

0.179

KCl

–

940

0.576

Control

–

0

0

Future Plans

Our group would like to complete a second round of this study the following year on newly identified liquid and solid manure and an additional coarse textured soil type. Future attempts in creating chloride-based mass balances for the state of Minnesota will benefit from this study.

Authors

Matthew Belanger, Graduate Research Assistant, Dept of Soil, Water, and Climate, University of Minnesota

Corresponding author email address

belan081@umn.edu

Additional authors

Dr. Erin L. Cortus, Associate Professor and Extension Engineer, Dept of Bioproducts and Biosystems Engineering, University of Minnesota

Dr. Gary W. Feyereisen, Research Agricultural Engineer, USDA-ARS Soil & Water Mgt. Research Unit

Nancy Bohl Bormann, Graduate Research Assistant, Dept of Soil, Water, and Climate University of Minnesota

Dr. Melissa L. Wilson, Assistant Professor and Extension Specialist, Dept of Soil, Water, and Climate, University of Minnesota

Additional Information

Wilson Manure Management and Water Quality Lab Site

Acknowledgements

This project is funded through the University of Minnesota Water Resource Center’s Watershed Innovation Grants Program. We’d also like to thank Scott Cortus, Eddie Alto, Todd Schumacher, Dr. Pedro Urriola, and Thor Sellie for their assistance.

Assessment of method of photo analysis for demonstrating soil quality

Purpose

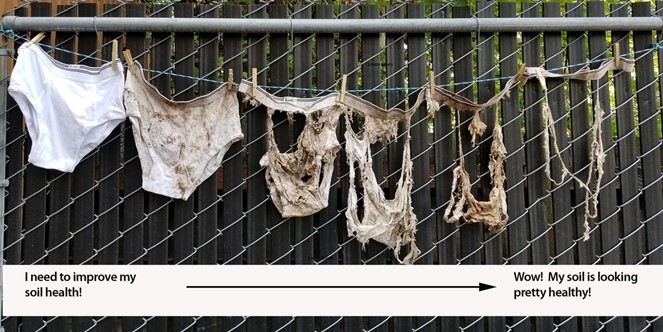
The use of livestock manure as a soil amendment to benefit soil health by improvements to soil physical, chemical, and biological properties, has been documented. However, quantification of the impact of improved soil health metrics on nutrient cycling has lagged. The soil your undies experiment has been implemented in the past to visually demonstrate microbial activity (Figure 1). However, this demonstration is seldom quantified, and does not have the capacity to statistically show that the effects of different management practices are distinct. The goal for this study was to quantify the degradation of fabric on a similar experiment, using cotton fabric on agricultural soils through photographic editing software. This study was designed to assess a visual method for quantifying carbon cycling in soil, observed through the degradation of buried organic materials.

Figure 1. Soil your undies soil health demonstration. Credit Clackamas Soil and Water Conservation District.

What Did We Do?

White, 100% cotton fabric cloths were cut into 29.21 × 29.84 cm (871.62 cm2) (11.5 x 11.75 in, 135 in2) pieces and placed flat inside a non-degradable mesh bag (48 cm × 48 cm, 18.9 in x 18.9 in). Sixty of the mesh bags were buried at 5 cm (2 in) depth in a field planted with corn in May of 2021 (Figure 2). The sixty bags were arranged in 12 plots to which one of three soil treatments (swine slurry, swine slurry + woodchips, and control plots with no amendments) with four replications per treatment were also applied. Swine slurry was applied at a rate of 39,687.06 L-ha-1 (4,242 gal-ac-1) and woody biomass was applied at a rate of 21.52 Mg-ha-1 (9.6 tons-ac-1).

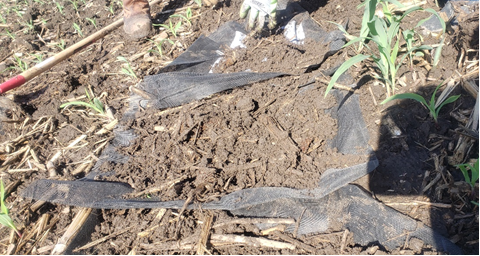
Figure 2. Fabric and mesh bag burial in research plots

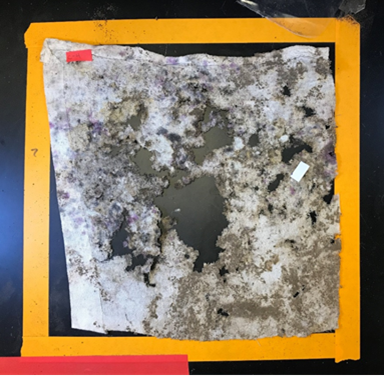
Five times during the growing season (25, 54, 81, 99 and 128 days after establishment), one bag was retrieved from each plot and returned to the lab for analysis. For each bag, soil was gently removed from the surface of the mesh and then the bag was cut open to observe the cotton fabric remaining. All the fabric pieces were photographed after retrieval. Photographs of the fabric were taken with an iPad mounted on a tripod. Fabric samples were photographed in a premeasured area of 29.21 × 29.84 cm (11.5 x 11.75 in) on a black surface (Figure 3).

Figure 3. Fabric sample placement inside pre-measured area (29.21 × 29.84 cm) for photographing

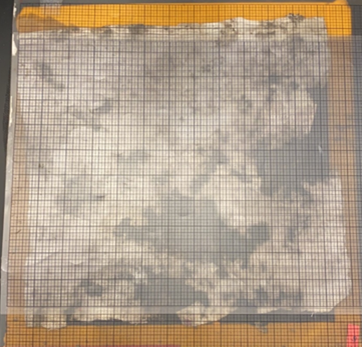
Manual evaluation of percent fabric degradation for each sample was performed by overlaying a clear plastic grid (Figure 4) with primary graduations (darker lines) of 2.54 cm (1 in) and secondary graduations (lighter lines) of 6.4 mm (0.25 in) on fabric samples and counting grid squares that were void of fabric.

Figure 4. Grid overlayed on fabric sample for manual evaluation of percent fabric degradation

Each photograph was assessed using Adobe Photoshop 2020 and the free license program ImageJ. Briefly, each image was opened in the respective program and the initial fabric area (871.62 cm2) (135 in2) was delineated in the program, based on the premeasured area included in the photo to set a scale for the degradation measurement. The image was converted to black and white, and brightness and contrast were adjusted as needed to remove glare on the black background that might be misread by the program as fabric. Then, all the pixels within a specific color range – which was previously defined as fabric – were selected using the native editing tools in the two programs and this area was compared to the pixels in the initial fabric area to determine the percentage of fabric remaining.

What Have We Learned?

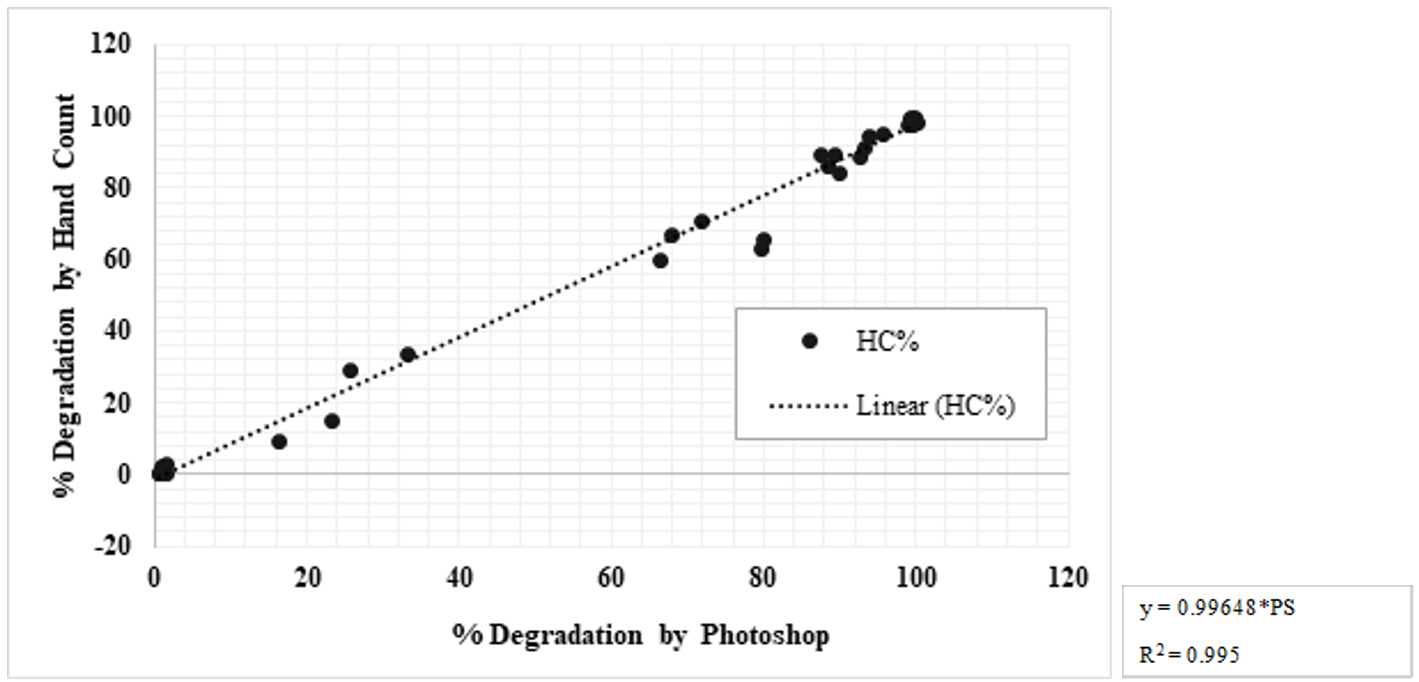
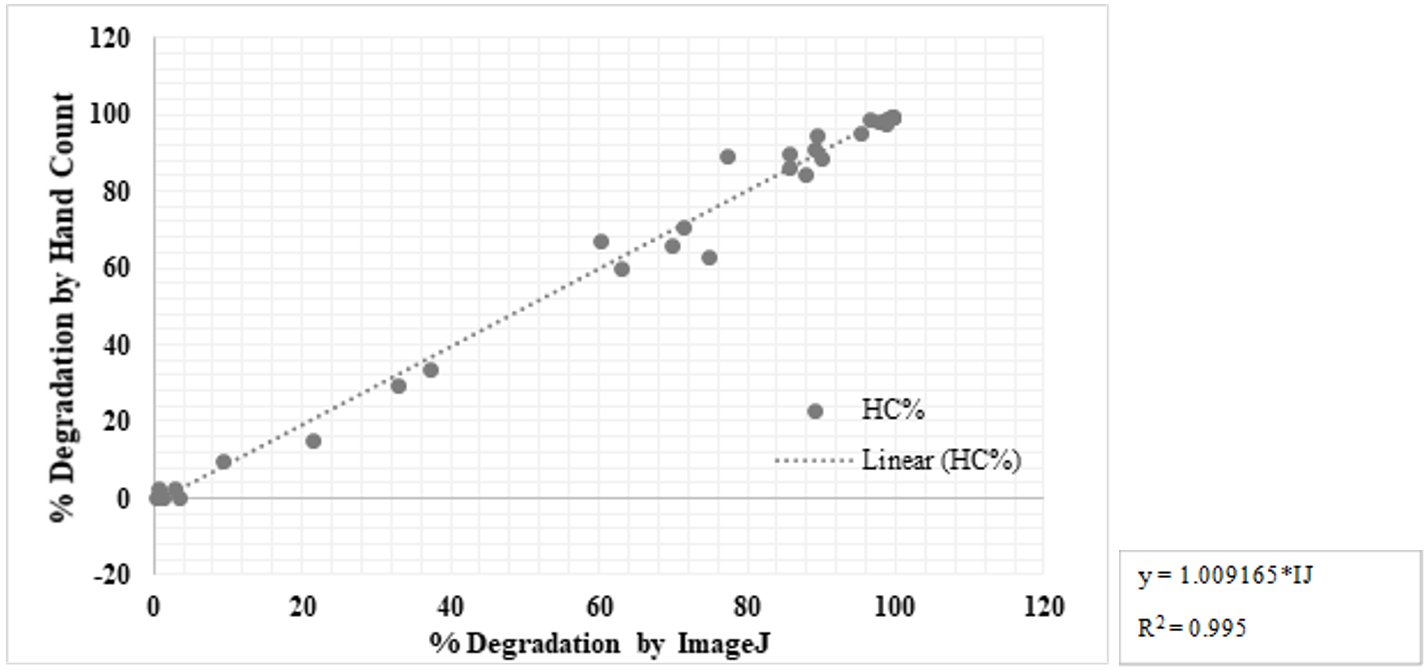
The three methods for estimating the area of the fabric did not show significant differences among each other, which means estimates of fabric degradation obtained with Photoshop and Image J accurately reflect manual hand counts, suggesting that these are reliable visual methods for determining the area of the remaining area of fabric (Figure 5, 6).

Figure 5. Linear regression model for degradation estimation via Photoshop relative to degradation value obtained by hand count
Figure 6. Linear regression model for degradation estimation via ImageJ relative to degradation value obtained by hand count

Future Plans

Future work will seek to validate this method according to standard measures of soil health and biological activity and ensure that the method has enough sensitivity to demonstrate statistical differences between soil treatments. Future studies should also focus on making the process of area estimation with the software an easier, less laborious process. Creating a cellphone app to determine degradation quickly and without the need for a computer could increase the adoption of the fabric degradation assessment method in field settings.

Authors

Amy Schmidt, Associate Professor, University of Nebraska-Lincoln

Corresponding author email address

aschmidt@unl.edu

Additional authors

Karla Melgar Velis, Graduate Research Assistant, University of Nebraska-Lincoln

Mara Zelt, Research Technologist, University of Nebraska-Lincoln

Andrew Ortiz Balsero, Undergraduate Research Assistant, University of Nebraska-Lincoln

Acknowledgements

Funding for this study was provided by the Nebraska Environmental Trust and Water for Food Global Institute at the University of Nebraska-Lincoln. Much gratitude is extended to collaborating members of the On-Farm Research Network, Nebraska Natural Resource Districts, Nebraska Extension Agents and Michael Hodges and family for providing the land, manure, and effort for this research project. Much appreciation to members of the Schmidt Lab who supported field and laboratory work: Juan Carlos Ramos Tanchez, Nancy Sibo, Andrew Lutt, Seth Caines and Jacob Stover.

Experience of Removing and Land Application of Lagoon Solids

Purpose

Manure lagoon systems are designed to hold and treat animal farm wastewater for a predetermined period and remain popular in many livestock farms. If the lagoon is properly designed and built, many years can go by without any significant maintenance requirements outside of water management, pumps and valves. Depending on the capacity and maintenance, additional manure solid removal is often required to reduce the amount of manure solids entering the lagoon storage. When excessive solids build-up or sludge was found, significant odor and low quality/quantity of flushing water would be the issues.

This study documents experience to prepare for and complete land application of lagoon effluent with heavy solids from a flush dairy lagoon in central Missouri. The free stall barn uses mattress bedding with supplemental cedar shavings and houses 140-160 lactating cows. Preparation included measuring lagoon sludge depth and lab analysis of sludge characteristics and scouting for crop fields for land application prior to contacting contractors for a bidding process. A contractor team utilized specialized equipment to dilute, agitate, pump and land apply approximately 8 million gallons of diluted lagoon solids in less than nine working days. Lagoon effluent was sampled throughout the process to monitor the mass of nutrients applied to specific plots of land. For effective lagoon solids removal and land application, proper preparation, specialty equipment and trained professional, timing of the crop fields, and adequate field working days are critical. Simple, non-mechanical technologies are available for even small to midsize dairy farms to reduce the cost of lagoon maintenance by preventing the bulk of solids from entering the lagoon.

What Did We Do?

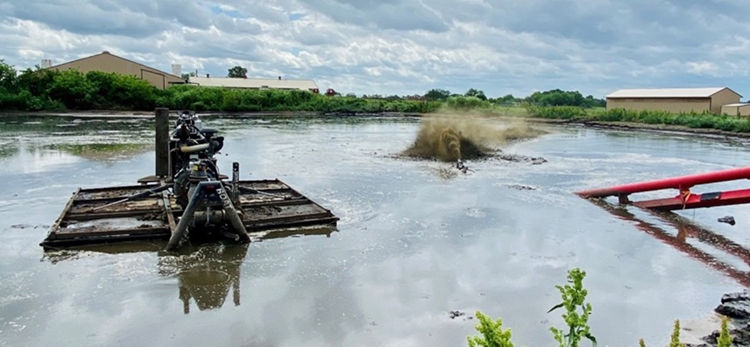
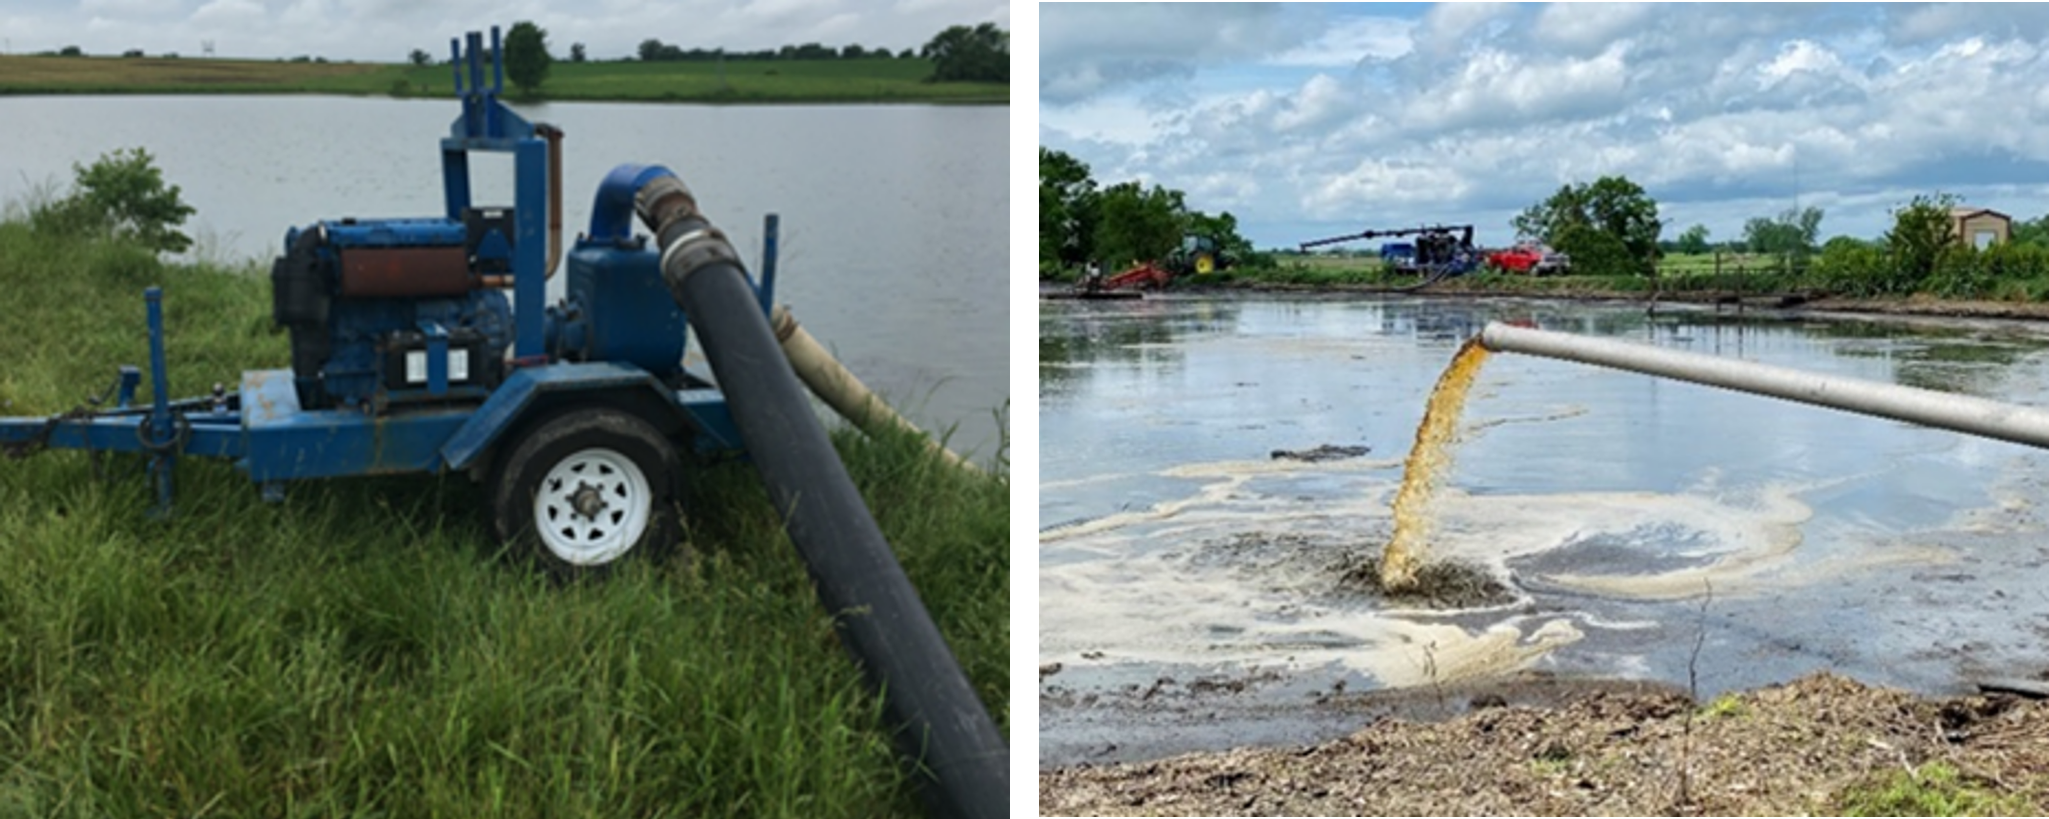
We documented the process of lagoon solids removal for land application, considering the preparation (sludge and effluent sampling), specialty equipment and trained professionals, timing of the crop fields, and adequate field working days. The barn was flushed two to three times per day, with three times per day being typical. There was, at one time, an elevated screen that helped remove the large solids from the flush, but the screen system fell into disrepair several years ago and was abandoned. Solids in the lagoon were agitated and pumped out from May 21, 2020, through June 8, 2020, Figures 1 and 2. A total of 8 million gallons over 280 acres was applied to fields further away from the lagoon, including neighbor’s crop fields that were 1.5 miles away. Equipment needs and specifications were documented (Canter et al., 2021) and being prepared for an Extension publication.

Figure 1. PTO-drive lagoon agitators and agitation boat in operation.
Figure 2.  A dilution pump was used to pump water from the nearby lake (left) to the dairy lagoon (right) with agitation boat and lagoon agitation working in the background.

Daily lagoon effluent samples were taken multiple samples throughout the day on June 2 to gauge the consistency of nutrient concentrations. Results suggest that once completely mixed via agitation, the applied nutrient concentration from a single sample is a reliable estimate within a working day if the moisture content is consistent. The initial slurry had a 10-13 percent solids content, so a significant amount of dilution water was needed to dilute the solids content to the target range. The exact amount of dilution water used was unknown. Figure 3 shows the concentration and moisture data. In general, the higher the moisture content (less solids) in the slurry samples, the higher the concentrations of the important manure nutrients are. The team evaluated potential technologies based on historical experience and first-person interviews. A pull-plug sediment basin (PPSB) was selected after reviewing cost and visiting with a farmer who operated a PPSB and was satisfied with the overall operation and performance (Canter et al., 2021). The application rate of important manure nutrients did show variation during the several days of land application, suggesting an improvement to the real-time effluent nutrient measurement and land application rate adjustment could be improved to provide more consistent nutrients to the crop fields.

Figure 3. Concentrations and moisture content of slurry samples from the lagoon.

What Have We Learned?

Manure management can be a burden for animal feeding operations, which can potentially become a significant threat to the profitability and management of farms if not proactively managed. Owners would be well-advised to survey their lagoon yearly to track solid inventory and plan ahead for the amount of land needed for solids application. Proper solids removal from the lagoon, particularly if regular and effective solids removal has been neglected, requires specialized equipment to reduce liquid supernatant on an annual or semiannual basis. There can be significant variability of nutrient concentration and resulting mass applied. Testing for nutrient concentrations in the lagoon, whether supernatant or sludge, or both, can be misleading due to variance in concentrations due to moisture content as the applicators dilute and concentrate the solids during the land application process.

Daily sampling during land application could help but may not be practical due to the analysis time generally required by labs (5-10 business days). Sensors and probes are available that return instantaneous values and have been used in municipal and industrial wastewater treatment for over a decade. Companies have offered integrated sensors for land application equipment, combining them with their GPS and flow control system to give a complete and accurate summary of nutrient application. Simple, non-mechanical technologies are available for even small to midsize dairy farms to reduce the cost of lagoon maintenance by preventing the bulk of non-degradable solids from entering the lagoon. Implementation of a coarse solids separation system such as the PPSB could significantly reduce the long-term cost of manure management by allowing the operator to use more common equipment (e.g., a loader and spreader) to remove solids from the manure management system.

Future Plans

Continuous monitoring of the lagoon sludge level at a minimum of annual basis is needed to closely monitor the lagoon solid accumulation and performance of the PPSB. The authors are collaborating with NRCS team to improve the PPSB and ways to monitor the lagoon sludge level.

Authors

Teng Lim, Extension Professor, Agricultural Systems Technology, University of Missouri

Corresponding author email address

Limt@missouri.edu

Additional authors

Timothy Canter, Extension Specialist, Agricultural Systems Technology, University of Missouri

Joseph Zulovich, Extension Assistant Professor, Agricultural Systems Technology, University of Missouri

Additional Information

    1. Canter, T., Lim, T.-T., and J. A. Zulovich. 2021. Field Experience of Removing and Land Application of Dairy Lagoon Solids. In International Symposium on Animal Environment and Welfare. Rongchang, Chongqing, China.
    2. Lim, T.-T. 2022. Lagoon Solids Removal, Lessons Learned. Cleanout for Lagoons and Anaerobic Digesters, Jan 21, 2022. Webinar of Livestock and Poultry Environmental Learning Community (LPELC). https://lpelc.org/cleanout-for-lagoons-and-anaerobic-digesters/
    3. Canter, T., Lim, T.-T., Chockley, T. 2021. Considerations of Pull-Plug Sedimentation Basin for Dairy Manure Management. University of Missouri Extension Publication. Retrieved September 25, 2021. https://extension.missouri.edu/publications/eq302.

Acknowledgements

USDA NIFA, Water for Food Production Systems Program A9101, for supporting the project. It is titled “Management of Nutrients for Reuse”, a multi-faceted project that involves professionals from the University of Arkansas, University of Nebraska, Colorado School of Mines and Metallurgy, Case Western University, and University of Missouri.

Joe Harrison, Professor, Livestock Nutrient Management program, Washington State University

Gilbert Miito, Postdoctoral Fellow, Agricultural Systems Technology, University of Missouri

Richard Stowell, Biological Systems Engineering, University of Nebraska

Farm crew and custom applicator team for their help.

A Transportation Simulation Model for selected Concentrated Animal Feeding Facility (CAFFs) within the Maumee Watershed, Ohio

Purpose

The goal of this study was to identify areas that were prone to nutrient transport from land application of manure-based on environmental conditions including length of streams and flood hazard potential in those areas. Additionally, the study aimed at developing an economic utility for producers in transporting manure in the Maumee Watershed in North-west Ohio targeted at reducing the potential environmental impacts that may arise from over application.

What Did We Do?

The initial basic feasible solution of the Hitchcock transportation model (Derigs, U. 1988. The Hitchcock Transportation Problem. In: Programming in Networks and Graphs. Lecture Notes in Economics and Mathematical Systems, vol 300. Springer, Berlin, Heidelberg.) was used to simulate the distribution of manure from 31 dairy and swine concentrated animal feeding facilities to agricultural census block groups (soybeans and corn) in the Maumee Watershed within NW Ohio. The model considered the supply and demand capacity of nearby livestock operations (origin) and agricultural census block groups (destinations) respectively. The second objective was to identify areas that were prone to nutrient transport as determined from the model results based on environmental conditions related to floodplain and length of streams dataset using the Getis-Ord GI* statistic. Finally, using the objective function of the transportation problem, the transportation costs associated with hauling manure from the source to the destinations were calculated.

What Have We Learned?

The distribution of manure showed an unbalanced transportation problem such that available farmland that could receive manure exceeded the supply of the livestock operations. The findings suggest there is adequate agricultural land for manure distribution in the watershed. Additionally, areas indicating clustering in the distribution of manure were further examined to determine the potential for nutrient transport off the land and into nearby water bodies based on the environmental conditions used. Approximately 98% of receiving agricultural census block groups fell in the EC-1 classification, which indicates a very low potential for environmental conditions to influence nutrient movement off farmland receiving manure from the 31 CAFFs studied. Approximately 2% and 1% of total acres receiving manure had a moderate to high potential for flooding respectively and were found in Upper Maumee and St. Joseph sub-basins. The identified sub-basins are recommended target areas for best management practices in reducing nutrient runoff. In using the Getis-Ord GI* statistic in ArcMap, Auglaize, Upper Maumee, Lower Maumee, and Cedar-Portage sub-basins were identified as critical areas of concern with high total acres showing high clustering of stream length.

Future Plans

The transportation problem is a type of linear programming problem where goods and services are transported from one set of sources to one set of destination points to minimize transportation costs. There are two phases to the transportation problem – finding the initial basic feasible solution while the second phase involves optimizing the initial basic feasible solution. This study focused on finding the initial basic feasible solution for manure distribution and application in the Maumee River Watershed. Future research could include optimization of the initial basic feasible solution per the transportation problem process to test the robustness of the results from the first phase.

Secondly, the transportation model coded for this dissertation was based on the manure supply of permitted livestock facilities engaged in only swine and dairy production. The model could be refined to include the supply of all livestock operations in the watershed in addition to all destination agricultural lands. With transportation costs being a major overhead cost for producers, the model can also be calibrated based on minimal travel time as an economic utility for producers and farmers.

Furthermore, given the costs involved in the construction of manure storage facilities and the regulations surrounding manure application as identified in Ohio State Bill 1, locations for ‘manure- sheds’ can be identified for manure storage during off seasons for application. A GIS optimal model can be developed to determine the minimum cost and distance efficient for the location of the proposed ‘manure-sheds’ where both small and medium facilities with limited storage facilities can transport their manure to a centralized location for storage, while also serving as the point of distribution and utilization for farmers.

Authors

Dr. Patrick L. Lawrence, University of Toledo

Corresponding author email address

Patrick.lawrence@utoledo.edu

Additional author

Dr. Edwina Teye, University of Toledo

Acknowledgements

Ohio Sea Grant

Ohio Department of Higher Education

Ohio Pork Council

Ohio Livestock Association

Life Cycle Assessment methodology to evaluate environmental impact of beef manure management: a comparison

Purpose

Manure from beef feedlot productions can be managed through a diversity of strategies. When choosing from the possible scenarios the main factors influencing the decision are financial, logistical or from a regulatory fulfillment focus, however it is necessary to consider the environmental impact generated from the manure management system in order to generate less burdens on behalf of meat production. One of the most reliable methodologies for this matter is Life Cycle Assessment (LCA), which considers every input and output throughout the process and will calculate environmental emissions quantitatively. In this study we compared various LCA studies of beef lot manure management processes, with the aim of understanding the different systems´ hotspots and global emissions so that these can be considered when establishing a manure management system in similar facilities.

What Did We Do?

We gathered LCA studies published from peer-reviewed scientific journals that assessed the environmental impact of beef manure management. The search terms taken into account were “LCA and beef manure” and “LCA and feedlot manure”. To enable comparison between studies the following criterion were considered for inclusion: a) manure collected from intensive feedlot facilities b) results reporting at least global warming potential.

In order to categorize emissions generated from the entire manure life cycle we established four stages of manure management: Feedlot, transport, storage/transformation and use/disposal. Next, we identified which of these stages were taken into account in each study and if emissions were reported for stages individually as well as globally. Lastly, a comparison between LCAs was conducted for which we converted the functional units reported in the references to 1 ton of manure (dry basis). With this we can visualize the emissions generated from every ton of dry manure that enters the system despite the functionality to which it´s destined.

What Have We Learned?

The final review included 14 references which resulted in 19 scenarios evaluated, ranging from 2007 to 2021. Initially we noted that the system with the greatest number of evaluations performed was the transformation of manure into an energetic resource (E), with 12 of the 19 scenarios being focused on energy generation through manure treatment processes, emphasizing that the current trends are not only leaning towards a better manure use but also cleaner energy sources. On the counter part, composting (C) and stockpiling (SP) are the two least evaluated scenarios through LCA (just once in the articles present in this review). Manure composting and stockpiling aren´t perceived as innovative solutions when aiming to mitigate emissions, but shouldn´t be left aside when performing evaluations, since they´re the most applied techniques for feedlot manure management.

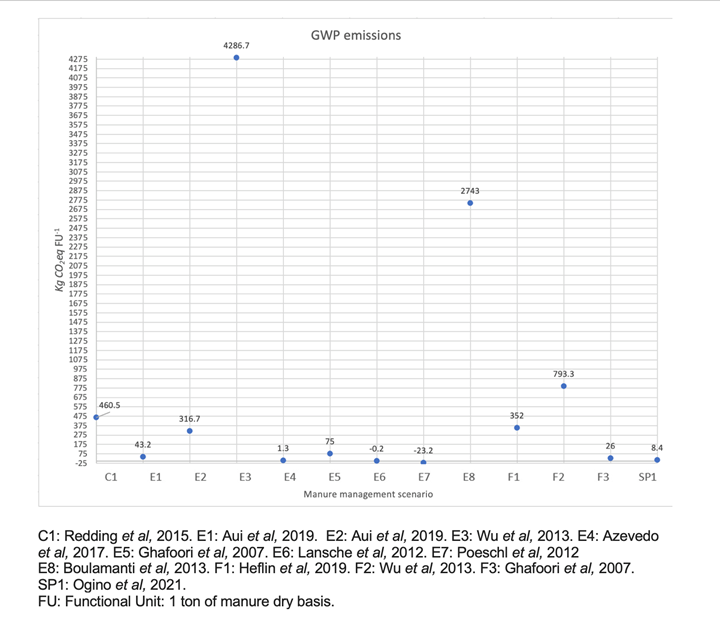
The energetic evaluations represented both, the most (E3) and the least emissions (E7) through the whole process. This is because bioenergetic sources, such as the one generated from manure transformation, frequently are given environmental credits and therefore negative emission values considering the substitution of other energetic resources. In this review 10 of the 12 energetic scenarios considered emission reduction by substitution, but not because the actual process generated less amount of greenhouse gases in itself. Energy production from manure is, in many cases assessed as a life cycle for transformation and excluding other stages of the entire management system. In fact, apart from the kind of treatment only 21.4% of all the LCAs considered in this study included all four stages. Since two of them (Lansche et al, 2012; Van Stappen et al, 2016) mentioned that the best mitigation emission option was to reduce storage time, and one (Giwa et al, 2017) reported the largest emissions coming from transportation we can assume that both, storage and transport are important stages when looking at sources of emissions and should not be left aside.

The difference between emissions between different manure management systems can be as extreme as 4,000X depending on system boundaries, allocation procedures, emission factors, environmental credits, amongst others. When evaluating a manure management system, it is necessary to consider every stage and so that emission reduction can be addressed in the whole process hotspots and not only during the transformation of organic matter.

Future Plans

To conduct an attributional LCA of beef feedlot manure management system as a case study. With this we will contribute more data to contrast composting or stockpiling scenarios and address the weight of the different manure management in a feedlot facility. Also, we will report eutrophication potential and water depletion, as their importance in the environmental impacts of manure management is well known and should be considered when decisions are being made.

Authors

Andrea Wingartz, National Autonomous University of Mexico

Corresponding author email address

anwiot@gmail.com

Additional author

PhD. Rafael Olea Pérez, National Autonomous University of Mexico

Pull-Plug Sedimentation Basin for Dairy Manure Management

Purpose

Many small and mid-sized dairy farms use flush systems for manure removal due to reduced chore time and increased barn cleanliness. Often, flush systems require greater attention to onsite water management and frequent lagoon maintenance. While anaerobic lagoons provide some digestion of manure solids and sludge storage, solids removal may help increase lagoon capacity and reduce costly lagoon sludge removal. A pull-plug sedimentation basin (PPSB) is a passive solids removal system that can reduce the operational time and cost of the overall manure management system by acting as both a sedimentation basin and pre-lagoon solids filter system.

Larger, denser particles accumulate on the basin floor, while buoyant particles (e.g., undigested fiber, waste forage, bedding, etc.) form a floating mat on the surface. The mat acts as a natural filter and retains some of the solids from the waste stream. The PPSB was developed as part of a collaborative effort between USDA NRCS and small dairy producers in Missouri. This abstract provides background and basic information on the PPSB, while more performance evaluation of the system based on nutrient retention, costs, and maintenance and operational considerations can be found in a University of Missouri Extension publication Eq302 (Canter et al., 2021).

What Did We Do?

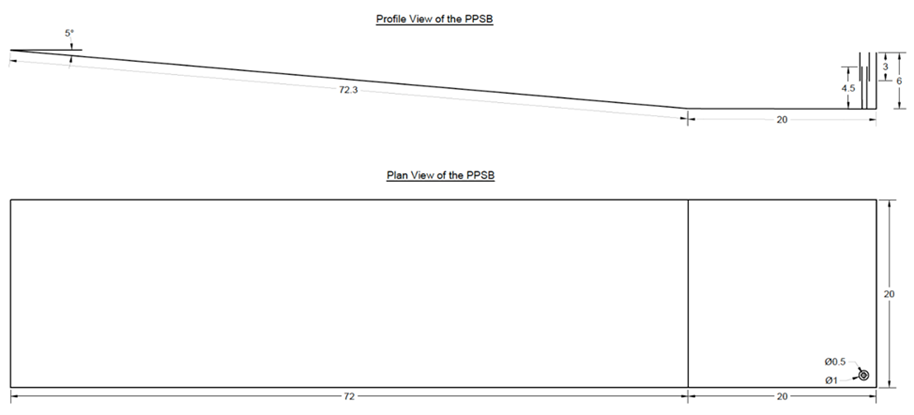
Design details of a working PPSB were documented, and performance evaluation was conducted based on grab samples of the flush and PPSB locations. Critical design considerations for the PPSB including design, hydraulic loading, location of the pull-plug location, and construction details were reported in the Extension publication (Canter et al., 2021). The concrete entry ramp into the PPSB should have a maximum slope of 12:1 (or 5 degrees) (Figure 1) to minimize wheel slippage and potential for equipment overturns. The example provided in Figure 1 is of a typical PPSB design that serves a herd of ~150 milking cows with a single-flush volume of ~7,000 gallons but also represents the smallest recommended size of the system. A minimum depth of 6 feet is needed to keep settling solids out of the discharge stream.

Figure 1. Profile and plan views of typical PPSB (dimensions in feet).

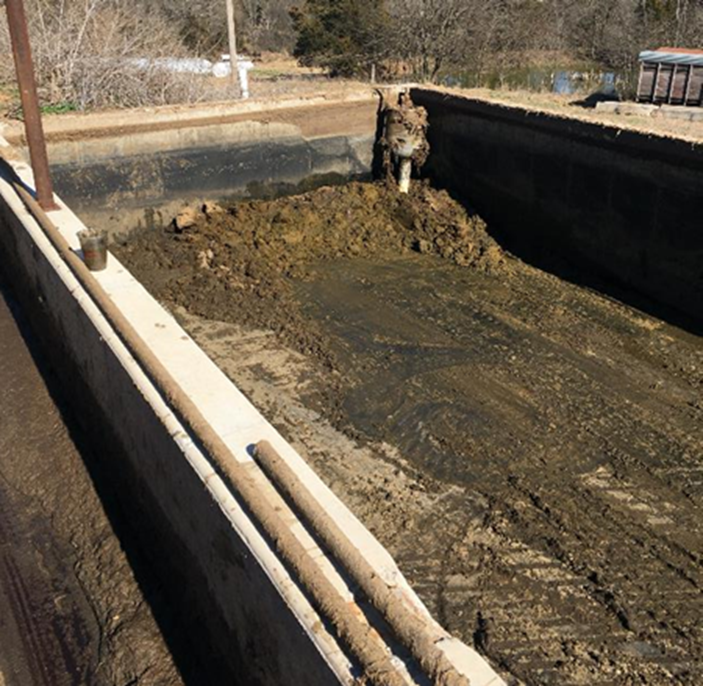
Detailed discussion of the advantages and disadvantages of the PPSB system was reported in the Extension publication. Relatively little maintenance has been reported, while the pull-plug is the only moving part and may need to be replaced if damaged during cleaning or degradation, Figures 2 and 3. Details such as the management and sampling and analysis were discussed, and a case study was conducted to document the information of a PPSB system of a 120-hd dairy farm in Missouri, with a flush system and sand lane, as well as a performance evaluation.

Figure 2. A PPSB system in operation at a dairy farm.
Figure 3. PPSB with liquid discharge pipe, after manure solid was removed.

What Have We Learned?

The owners are satisfied with the performance of the PPSB, which is considered a low-maintenance, low-technology option to efficiently manage manure solids within a flush system. The primary benefit of the PPSB is a reduction in time spent agitating and removing solids/sludge in the lagoon. When less capacity in the lagoon is used for solids treatment and storage, there is more room to store water and longer intervals between repairing or unclogging pumps and the water system. There are typically three to four clean-out periods per year, depending on PPSB and herd sizes and other factors.

The primary benefit of the PPSB is the removal of manure solids using a low maintenance system, resulting in longer intervals between lagoon agitation and land applications. Approximately 23,450 cubic feet of manure solids were prevented from entering the lagoon each year, along with 6,454 pounds of nitrogen (438 pounds as ammonia-nitrogen) and 2,415 pounds of phosphorous. These represent 13 percent and 28 percent of manure-based nitrogen and phosphorous, respectively, being retained in the PPSB.

Future Plans

Additional sampling just before or during clean-out is necessary for a more accurate performance determination. PPSB installed at larger dairy farms, and those using different bedding should be evaluated for performance and documented the cost savings as compared with other popular solid separation systems.

Authors

Teng Lim, Extension Professor, Agricultural Systems Technology, University of Missouri

Corresponding author email address

Limt@missouri.edu

Additional authors

Timothy Canter, Extension Specialist, Agricultural Systems Technology, University of Missouri

Troy Chockley, Environmental Engineer, Natural Resource Conservation Service, United States Department of Agriculture

Additional Information

Canter, T., T.-T. Lim, and T. Chockley. 2021. Considerations of pull-plug sedimentation basin for dairy manure management. University of Missouri Extension. https://extension.missouri.edu/eq302

Acknowledgements

USDA NIFA, Water for Food Production Systems Program A9101, for supporting the project. It is titled “Management of Nutrients for Reuse”, a multi-faceted project that involves professionals from the University of Arkansas, University of Nebraska, Colorado School of Mines and Metallurgy, Case Western University, and University of Missouri.

Joseph Zulovich, Agricultural Systems Technology, University of Missouri

Richard Stowell, Biological Systems Engineering, University of Nebraska

Potential soil health improvement through the integration of cover crops and manure in the upper Midwest

Purpose

Oftentimes fall manure application is associated with significant offsite transport of nitrogen and phosphorus into nearby bodies of water and the atmosphere. Mechanisms of losses include leaching, runoff, sediment transport, and volatilization processes. This is becoming more common as there has been a trend of increased wet springs that create difficult planting conditions. This prolonged period without an active root system leaves more time for nutrient loss from fall-applied manure to occur.

A strategy to offset nutrient losses in the fall and early spring is to plant a cover crop. The uptake of nutrients during this time in the field, which would otherwise be left fallow, allows for nutrients to be stored in the tissue of the cover crops, minimizing nutrient loss risk. Upon terminating the cover crops, the decomposing residues can supply nutrients to the succeeding row-crop. However, cover crop adoption is low in the upper Midwest US stemming from a short cover crop growing season due to the cold climate. This is especially the case for crops utilizing manure. A strategy to expand the cover crop growing season may be to interseed a cover crop into a maturing row-crop prior to harvest. Previous studies investigating the integration of manure and cover crops have seeded the cover crop after manure application. We wanted to measure the impacts of first planting a cover crop then applying manure once the cover crop has had ample time to get established. This may help expand the cover crop growing season and potentially limit the offsite transfer of pollutants to our water and air.

What Did We Do?

A small plot study was started in fall 2019 at the University of Minnesota West Central Research and Outreach Center near Morris, MN. We tested the effect of nitrogen source and cover crops on soil health, nutrient cycling, and agronomic responses using a randomized complete block design with split plots.

Cover crop mixtures of cereal rye and annual ryegrass were interseeded near corn’s fifth leaf collar (V5) growth stage, physiological maturity (R5 to R6 growth stage), or drilled after corn harvest. Dairy manure was sweep-injected to minimize soil disturbance in early and late fall, when soil temperatures were above and below 10°C (50°F), respectively. Non-manured plots received urea in the spring prior to corn planting. Urea applied plots (no manure) with no cover crops served as the control. Soil samples were taken throughout the cover crop and row-crop growing season from the 0-15, 15-30, and 30-60 cm (0-6, 6-12, and 12-24 in) soil layers. Cover crop biomass samples were taken in the late fall prior to the first frost event and prior to cover crop termination in the spring.

What Have We Learned?

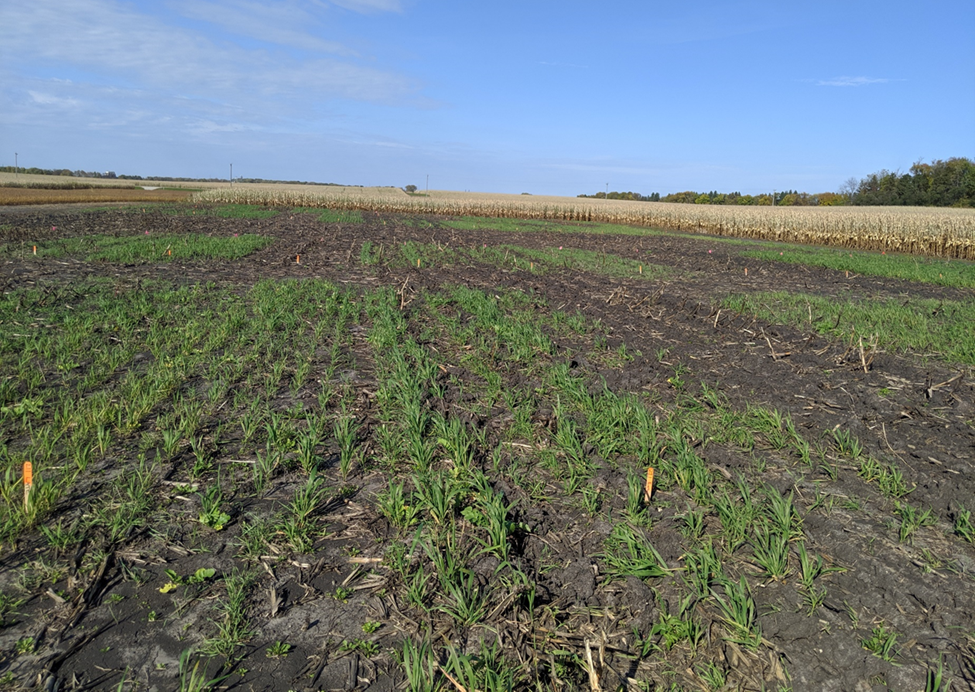
Sweep injection is a reliable method to apply liquid manure to a field with an established stand of cover crops with minimal noticeable damage to the cover crops in the spring (Figure 1). Planting cover crops as soon as possible ensures more biomass is produced; planting after harvest consistently had lower cover crop yield than interseeding. Spring cover crop yield, right before termination, was highest when planted near physiological maturity [110 kg ha-1 (98 lb ac-1)] compared to drilling after harvest [87 kg ha-1 (78 lb ac-1)]. Nutrient source had a significant effect on silage yield. Manure, either applied in the early or late fall, had greater silage yield [58.5 and 58.7 Mg ha-1 (26.1 and 26.2 ton ac-1), respectively] than spring applied urea [53.6 Mg ha-1 (23.9 ton ac-1)]. Plots with cover crops interseeded at V5 had greater silage yield [59.5 Mg ha-1 (26.5 ton ac-1)] than all other treatments [54-56 Mg ha-1 (24-25 ton ac-1)] except no cover crops [57.8 Mg ha-1 (25.8 ton ac-1)].

Figure 1. Cover crops planted prior to late manure application. Photo was taken in the spring at cover crop termination.

Future Plans

Soil samples collected throughout the study are currently being analyzed for nutrient content and other soil health parameters. Results from this study will be used to develop best management practices for integrating cover crops and liquid injected manure in the upper Midwest.

Authors

Manuel J. Sabbagh, Graduate Research Fellow, University of Minnesota

Corresponding author email address

sabba018@umn.edu

Additional authors

Melissa L. Wilson, Assistant Professor, University of Minnesota; Paulo H. Pagliari, Associate Professor, University of Minnesota

Additional Information

Twitter: @mannyandmanure @manureprof

Lab website: https://wilsonlab.cfans.umn.edu/

Acknowledgements

This work is supported by the Conservation Innovation Grants program at the Natural Resources Conservation Service of the USDA, the Minnesota Corn Research and Promotion Council, and the Foundation for Food and Agriculture Research.

The use of cover crops and manure to retain soil moisture in Aridisols in Southern Idaho

Purpose

It is important to measure soil moisture in semi-arid regions because future models predict severe droughts and a decrease in rainfall events by up to 40%. The effects of management practices, such as reduced tillage, cover cropping, and manure application, have not been evaluated in the semi-arid and irrigated crop production area of Southern Idaho. In this study, we investigated the effects of cover crops, dairy manure, and tillage on soil physical characteristics (soil water storage, infiltration, runoff, saturated hydraulic conductivity, bulk density) and silage corn yield in silty loam soils. The objectives of this research were to: (a) determine if cover crops and dairy manure increased soil water storage, or if the cover crops were depriving the cash crop of water, (b) determine if infiltration, runoff, saturated hydraulic conductivity, and bulk density were influenced by cover crops and dairy manure, (c) determine if silage corn yield is affected by cover crops and dairy manure, and (d) determine if there are differences between tillage types.

What Did We Do?

This study was conducted at the USDA-ARS Northwest Irrigation and Soils Research Laboratory in Kimberly, Idaho. The experimental design was a split plot with four replicates and repeated measures, and the two main experiment treatments were tillage (strip till vs disk/chisel plow). The four sub-treatments were: (a) control (no cover crop or dairy manure), (b) cover crop only (CC only), (c) manure only (M only), and (d) cover crop with manure (CC + M). Treatments that did not receive manure received inorganic fertilizer to meet recommended crop needs based on spring soil tests. Inorganic fertilizer was only applied to manure treatments if spring soil tests indicated that additional nutrients were required. Stockpiled dairy manure was applied with a manure spreader at a rate of 30 ton per acre (dry weight) in the fall after corn silage harvest and incorporated by disking or left on the surface. Both the corn silage and the triticale were irrigated using handlines, as needed, during the water season, which was generally from mid-April through mid-October. Soil moisture was measured using a neutron probe throughout each growing season. Neutron probe measurements were collected every 6 inches to a maximum depth of 60 inches one to two times per month. Soil water storage (SWS) was calculated from 0 to 12 inches, 0 to 24 inches, and 0 to 60 inches using weighted depth increments. A Cornell Sprinkle Infiltrometer was used to measure infiltration and runoff rates, field saturated infiltrability, and rainfall before runoff in the middle of the growing season in 2020 prior to an irrigation event.

What Have We Learned?

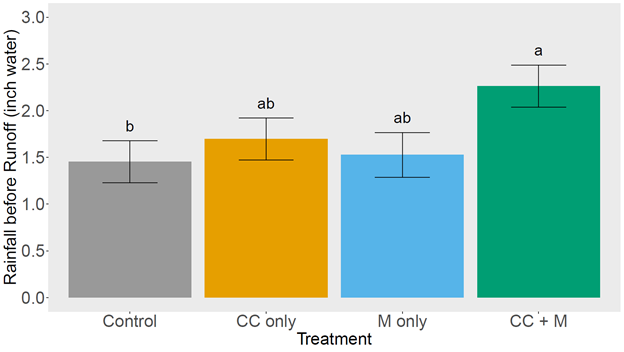
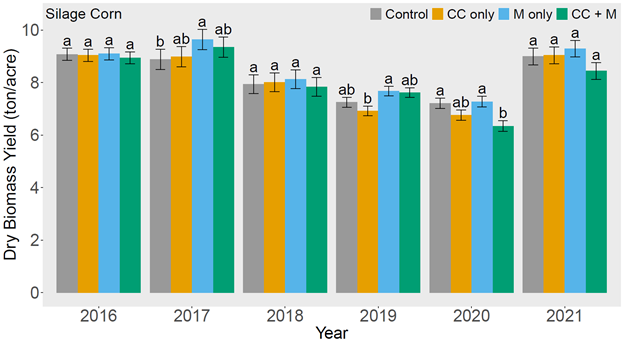
From this research, we found that the use of winter cover crops and fall applied solid dairy manure did not improve soil water storage in the semi-arid and calcareous soils in Southern Idaho. Soil water storage tended to be lower in the CC + M plots (Figure 1). The CC + M plots were able to infiltrate more water prior to runoff than the control plots, suggesting that the CC + M plots are drier (Figure 2). Infiltration, runoff, and saturated hydraulic conductivity did not improve with the treatments and remained similar to the control plots. Although some research has shown improvements in soil moisture, soil physical properties, and dry biomass yield when using reduced tillage practices, there were no differences between reduced tillage and conventional tillage. Silage corn yields tended to be highest in the M only plots and lowest in the CC + M plots, however there were no treatment differences in three of the six years of the study (Figure 3). Using triticale as a winter cover crop would be beneficial to increase total dry biomass yields in dairy systems that would like to increase their forage production, however it is not advised if a producer is only looking to increase silage production.


Figure 1. Average soil moisture storage (SWS; inch of water) by treatment from 2016 to 2021 in the top 15, top 30, and top 60 inches. Soil moisture storage was calculated from 0 to 12 inches, 0 to 24 inches, and 0 to 60 inches using weighted depth increments. Bars represent mean plus standard error. Columns within years not connected by the same number are significantly different (p<0.05).


Figure 2. Average rainfall before runoff by treatment in 2020. Bars represent mean plus standard error. Columns not connected by the same number are significantly different (p<0.05).


Figure 3. Average dry biomass yield for silage corn by treatment from 2016 to 2021. Bars represent mean plus standard error. Columns within years not connected by the same number are significantly different (p<0.05).

Future Plans

This spring, inversion tillage will be performed prior to planting silage corn to incorporate the dairy manure into the topsoil. Dairy manure has not been applied to the field since fall of 2020. Inorganic fertilizer will be applied if needed.

Authors

Presenting author

Kevin Kruger, Research Support Scientist, University of Idaho

Corresponding author

Jenifer L. Yost, Research Soil Scientist, USDA-ARS

Corresponding author email address

jenifer.yost@usda.gov

Additional authors

April B. Leytem, Research Soil Scientist, USDA-ARS; Robert S. Dungan, Research Microbiologist, USDA-ARS; Linda R. Schott, Nutrient and Waste Management Extension Specialist, University of Idaho

Additional Information

This research was presented at the virtual ASA, CSSA, SSSA International Annual Meeting in November of 2020. The link to the recorded presentation is found in the citation below. Although this research is not published in a scientific journal yet, we will be submitting a paper to Agricultural Water Management in early to mid 2022.

Yost, J.L., Leytem, A.B., Dungan, R.S., & Schott, L.R. (2020). The Use of Cover Crops and Manure to Retain Soil Moisture in Aridisols in Southern Idaho [Abstract]. ASA, CSSA and SSSA International Annual Meetings (2020) | Virtual, Phoenix, AZ.

https://scisoc.confex.com/scisoc/2020am/meetingapp.cgi/Paper/126244

Acknowledgements

The authors would like to thank Joy Lynn Barsotti for collecting the neutron probe measurements.