
A National Assessment of the Environmental Impacts of Beef Cattle Production

Environmental effects of cattle production and the overall sustainability of beef have become national and international concerns. Our objective was to quantify important environmental impacts of beef cattle production throughout the United States. This provides baseline information for evaluating potential benefits of alternative management practices and mitigation strategies for improving the sustainability of beef.

What did we do?

Surveys and visits of farms, ranches and feedlots were conducted throughout seven regions of the United States (Northeast, Southeast, Midwest, Northern Plains, Southern Plains, Northwest and Southwest) to determine common practices and characteristics of cattle production. These data along with other information sources were used to create about 150 representative production systems throughout the country, which were simulated with the Integrated Farm System Model using local soil and climate data. The simulations quantified the performance and environmental impacts of beef cattle production systems within each region. A farm-to-gate life cycle assessment was used to determine resource use and emissions for all production systems including traditional beef breeds and cull animals from the dairy industry. Regional and national totals were determined as the sum of the production system outputs multiplied by the number of cattle represented by each simulated system.

What we have learned?

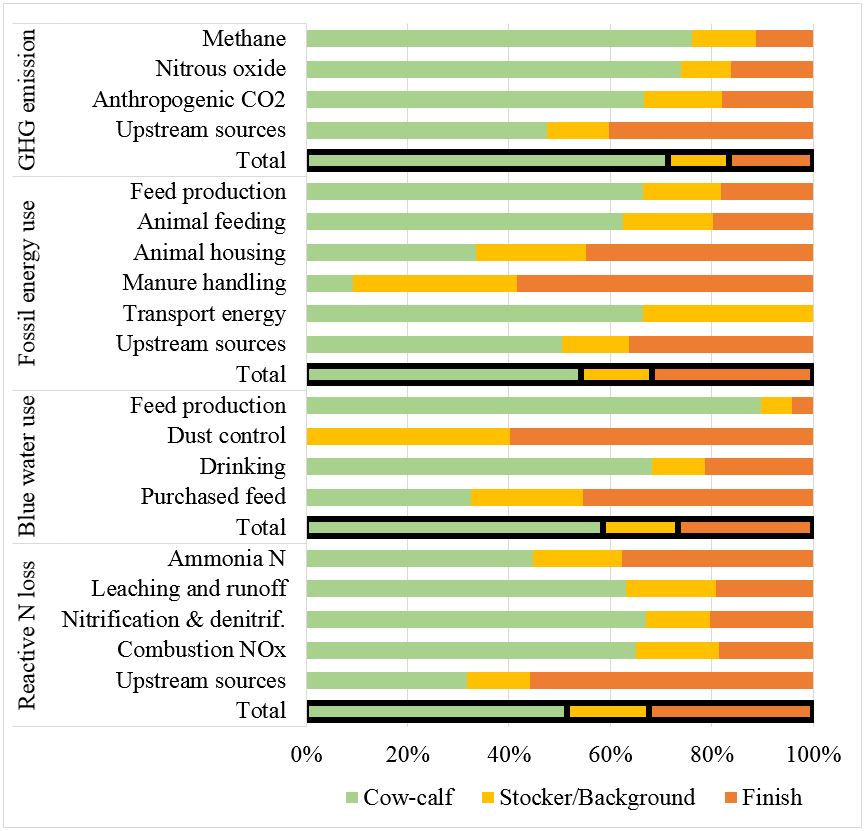
Average annual greenhouse gas emission related to beef cattle production was determined as 268 ± 29 million tons of carbon dioxide equivalent, which is approximately 3.3% of the reported total U.S. emission. Fossil energy use was 539 ± 50 trillion BTU, which is less than 1% of total U.S. consumption. Non-precipitation water use was 6.2 ± 0.9 trillion gallons, which is on the order of 5% of estimated total fresh water use for the country. Finally, reactive N loss was 1.9 ± 0.15 million ton, which indicates about 15% of the gaseous emissions of reactive N for the nation are related to beef cattle production. Expressed per lb of carcass weight produced, these impacts were 21.3 ± 2.3 lb CO2,e, 21.6 ± 2.0 BTU, 0.155 ± 0.012 lb N and 244 ± 37 gal for carbon, energy, reactive N and water footprints, respectively. Many sources throughout the production system contributed to these footprints (Figure 1). The majority of most environmental impacts was associated with the cow-calf phase of production (Figure 2).
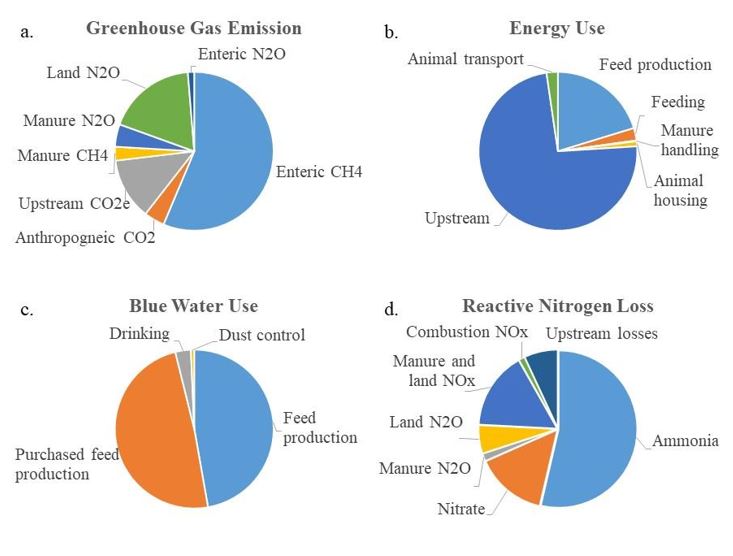
Distribution of the major sources for each environmental footprint.
Figure 1. Distribution of the major sources for each environmental footprint.
Figure 2. Distribution of the sources of each environmental impact across the three major phases in the life cycle of beef cattle production.

Take-home message: This study is the most detailed, yet comprehensive, study conducted to date that provides baseline measures for the sustainability of U.S. beef.

Future plans

These farm-to-gate values are being combined with sources in packing, processing, distribution, retail, consumption and waste handling to produce a full life cycle assessment of U.S. beef considering additional metrics of environmental and economic impact. Further work is ongoing to complete this full LCA and to more fully assess opportunities for mitigating environmental impacts and improving the sustainability of beef.

Authors

Alan Rotz, USDA-ARS; Senorpe Asem-Hiablie, USDA-ARS; Sara Place, National Cattlemen’s Beef Association; Greg Thoma, University of Arkansas.

Additional information

Information on the Integrated Farm System Model is available in the reference manual:

Rotz, C., Corson, M., Chianese, D., Montes, F., Hafner, S., Bonifacio, H., Coiner, C., 2018. The Integrated Farm System Model, Reference Manual Version 4.4. Agricultural Research Service, USDA. https://www.ars.usda.gov/ARSUserFiles/80700500/Reference%20Manual.pdf.

Further information on the national assessment of the environmental impacts of U.S. cattle production is available in:

Rotz, C. A., S. Asem-Hiablie, S. Place and G. Thoma. 2019. Environmental footprints of beef cattle production in the United States. Agric. Systems 169:1-13.

Acknowledgements

This work was funded in part by The Beef Checkoff and the USDA’s Agricultural Research Service. USDA is an equal opportunity provider and employer.

The authors are solely responsible for the content of these proceedings. The technical information does not necessarily reflect the official position of the sponsoring agencies or institutions represented by planning committee members, and inclusion and distribution herein does not constitute an endorsement of views expressed by the same. Printed materials included herein are not refereed publications. Citations should appear as follows. EXAMPLE: Authors. 2019. Title of presentation. Waste to Worth. Minneapolis, MN. April 22-26, 2019. URL of this page. Accessed on: today’s date.

Thermal and Electrical Energy and Water Consumption in a Midwest Dairy Parlor

The typical dairy farm uses a large amount of energy during milking activities. This is due to the frequency of milking and the energy intensive nature of harvesting milk, keeping it cool, and cleaning the equipment with hot water. Renewable energy systems generally become more economically efficient as the amount of energy used increases, making dairy farms a great place to incorporate renewable energy.

Dairy farms have not typically been set up with energy efficiency in mind and often use relatively expensive fuel sources like heating oil or propane to heat water. One of the difficulties encountered with renewable energy systems is the intermittent generation of wind and solar energy, whereas the energy load on a dairy farm is very consistent since cows are typically milked twice or three times every day (very large dairies may milk continuously). An efficient way to store energy has long been sought to tie energy production and consumption together. A dairy farm’s need for both electricity and heat provides an ideal situation to generate electrical energy on-site to meet current electrical load requirements, displace conventional thermal fuels with electrical energy, and evaluate thermal storage as a solution to the time shifting of wind and solar electrical generation.

What did we do?

The dairy operation at the University of Minnesota West Central Research and Outreach Center in Morris milks between 200 and 275 cows twice daily and is representative of a mid-size Minnesota dairy farm. The cows are split almost evenly between a conventional and a certified organic grazing herd, and all cows spend the winter outside in lots near the milking parlor. The existing dairy equipment is typical for similarly sized dairy farms and includes none of the commonly recommended energy efficiency enhancements such as a plate cooler, refrigeration heat recovery, or variable frequency drives for pump motors. The WCROC dairy provides an ideal testing opportunity to evaluate and demonstrate the effect of on-site renewable energy generation and energy efficient upgrades on fossil fuel consumption and greenhouse gas emissions (Figure 1).

Heat pumps, electric water heaters, and thermal storage at the University of Minnesota Morris
Figure 1. Renewable energy upgrades that include new heat pumps, electric water heaters, and thermal storage tank at the University of Minnesota WCROC Dairy in Morris, MN.

A data logger was installed in the utility room of the milking parlor in August 2013 to monitor 18 individual electric loads, 12 water flow rates, 13 water temperatures, and two air temperatures. Average values were recorded every 10 minutes for the last 4 years. The milking parlor has gas and electric meters that measure the total consumption of natural gas and electricity within the parlor. The data helped us evaluate energy and water usage of various milking appliances. Some small energy loads were not measured in unused parts of the barn, or for equipment not directly related to the milking operation. These small and miscellaneous loads were estimated by subtracting monitored energy use from the total energy use.

Baseline measurements were collected at the WCROC dairy and overall, the milking parlor currently consumes about 250 to 400 kWh in electricity and uses between 1,300 and 1,500 gallons of water per day (Figures 2 and 3). The parlor currently uses about 110,000 kWh per year (440 kWh per cow per day) in electricity and 4,500 therms per year in natural gas. A majority of the electricity (26 percent) is used for cooling milk , with ventilation, fans and heaters  utilizing 16 percent. The dairy uses about 600 gallons of hot water per day, with a majority used for cleaning and sanitizing milking equipment (57%), followed closely by cleaning the milking parlor (27%). Energy and water usage fluctuates throughout the year; the dairy calves 40 percent of the cows from September to December and 60 percent from March to May. Therefore, water and energy use escalates dramatically during April.

The first energy efficiency upgrade was the installation of a variable frequency drive for the vacuum pump in September 2013. Prior to the upgrade, the vacuum pump used 55 to 65 kWh per day. Following installation, electrical consumption by the vacuum pump decreased by 75% to just 12 kWh per day. This data provides a vivid example of the significant energy savings that can be achieved with relatively simple upgrades.

Because the dairy operates both  organic and conventional systems, two bulk tank compressors are used: one scroll and one reciprocating. The scroll compressor is the newest and uses 15 kWh per day versus 40 kWh per day for the reciprocating compressor. Based on milk production, the scroll compressor costs $0.73 per kWh per cwt. versus $1.08 per kWh per cwt. for the reciprocating compressor, indicating that the scroll compressor is more efficient. In terms of fossil fuel consumption, milk harvesting consumed more energy than feeding and maintenance.  

Pie Chart: Electrical usage by equipment component for 2016.
Figure 2. Electrical usage by equipment component for 2016.
Pie chart: Hot water usage by activity during 2016
Figure 3. Hot water usage by activity during 2016

During the fall of 2016, a TenKSolar Reflect XTG 50 kW DC array was installed. The annual production from this solar PV system was projected to be 70,000 kWh. At a total cost of $138,000 ($2.77/W) for the solar system,  a 19.7-year simple payback without incentives was predicted. Adding the “Made in Minnesota” incentives would reduce the payback period to 8.6 years.

In 2017, two 10-kW VT10 wind turbines from Ventera were installed. These turbines are a three blade, downwind turbine model, each with an annual predicted generation of 22,400 kWh. The wind system cost was $156,800 ($78,400 per tower) with a 35-year simple payback without incentives. With the 30% federal credit, each turbine would have a 24.5-year payback.

What we have learned?

Our study suggests that fossil energy use per unit of milk could be greatly reduced by replacing older equipment with new, more efficient technology or substituting renewable sources of energy into the milk harvesting process. To improve energy efficiency, begin with an audit to gather data and identify energy-saving opportunities. Some energy efficiency options that may be installed on dairy farms include refrigeration heat recovery, variable frequency drives, plate coolers, and more efficient lighting and fans. A majority of these upgrades have immediate to two- to five-year paybacks. Make all electrical loads as efficient as possible, yet practical. Consider converting all thermal loads to electricity by the use of heat pumps that allow for cooling of milk. In the future, we have plans to harvest energy from our manure lagoon and store electricity as heat by use of heat pumps. Renewable energy options also can improve energy efficiency.

Solar panels
Figure 4. 50 kW solar array at the University of Minnesota WCROC Dairy, Morris, MN

Future Plans

We will continue to monitor the WCROC dairy and make renewable energy upgrades. We have begun monitoring the two 10-kW wind turbines, and installed a new 30-kW solar array in the WCROC pastures for renewable energy production. Additionally, we will evaluate the cow cooling potential of solar systems in the grazing dairy system at the WCROC. This study is the first step toward converting fossil fuel-based vehicles used in dairy farms to clean and locally produced energy. The knowledge and information generated will be disseminated to agricultural producers, energy professionals, students, and other stakeholders.

Authors

Brad Heins, Associate Professor, Dairy Management, hein0106@umn.edu

Mike Reese, Director of Renewable Energy

Eric Buchanan, Renewable Energy Scientist

Mickey Cotter, Renewable Energy Junior Scientist

Kirsten Sharpe, Research Assistant, Dairy Management

Additional information

We have developed a Dairy Energy Efficiency Decision Tool to help provide producers a quick way to estimate possible energy and costs savings from equipment efficiency upgrades. The tool can be used to quickly see what areas of a dairy operation may provide the best return on investment. Furthermore, we have developed a U of MN Guidebook for Optimizing Energy Systems for Midwest Dairy Production. This guidebook provides additional information about the topics that were discussed in this article, as well as the decision tool. More information may be found at https://wcroc.cfans.umn.edu/energy-dairy

Acknowledgements

To complete our goals, we have secured grants from the University of Minnesota Initiative for Renewable Energy and the Environment (IREE), the Minnesota Rapid Agricultural Response Fund, and the Xcel Energy RDF Fund.

The authors are solely responsible for the content of these proceedings. The technical information does not necessarily reflect the official position of the sponsoring agencies or institutions represented by planning committee members, and inclusion and distribution herein does not constitute an endorsement of views expressed by the same. Printed materials included herein are not refereed publications. Citations should appear as follows. EXAMPLE: Authors. 2019. Title of presentation. Waste to Worth. Minneapolis, MN. April 22-26, 2019. URL of this page. Accessed on: today’s date.

Carbon, Water, and Land Use for Pork Production when Modifying Type and Regional Sourcing of Feed Ingredients

Providing animal protein to tomorrow’s nine billion people will be a challenge given the associated environmental pressures with animal production, particularly issues such as greenhouse gas (GHG) emissions, human health and water usage/quality. Globally, livestock production systems contribute 14.5% to the total human-induced emissions of greenhouse gases (FAO, 2013). Animal feed is a major component of these impacts with the composition of animal diets having important downstream effects (i.e. GHG emissions, animal productivity, animal health, product safety and quality and animal welfare) as well as upstream effects on water quality, GHG emissions, land use and energy consumption (Makkar, 2016). Despite these effects, feeding programs for swine largely only focus on cost minimization and productivity (Dubeau et al. 2011; Pomar et al. 2007). Finding ways to produce animal protein while reducing the environmental impacts is vital to maintaining the long-term economic viability and cultural significance of this industry.

Pork, and the meat industry in general, has downstream pressure from customers to decrease environmental impacts. Major food companies have initiated supply chain management programs to minimize their carbon footprint in response to consumer demands and societal concerns. Within pork production, feed grains and manure management are the two largest contributors to GHG emissions, water use and land use (Matlock et al., 2014; Thoma et al., 2011). However, there is high variability in agricultural production systems and the associated environmental impacts across these locations (Yang and Heijung 2016; Hellweg and Canals, 2014). There is further variability across space due to the large differences in manure management practices, climate conditions and fuel mixes employed in U.S. counties and processing facilities. While research has been done on characterizing the average environmental impacts across the U.S. (Thoma et al 2011; Macleod et al 2013), and for particular production systems on a specific farm (or on average) (Bandekar et al 2014), this substantial variability across the U.S. can significantly affect specific supply chain environmental impacts.

What did we do?

The US pork industry is not a homogenous group of producers (in location, size, or even feed inputs) and therefore providing one single LCA number for the entire industry is incomplete. To capture this variability we used the Food Systems Sustainable Supply-chain model (FoodS3) that uses county level environment impacts of corn production, rather than using a single national average estimate. We also added spatial difference in manure impacts by estimating the volatile solids excreted in manure by the three regional feeding programs using county specific manure management practices. Using these estimates, we calculated the water and land use impacts of corn feed inputs in regional pig feeding programs, as well as the GHG impacts from corn feed inputs and manure emissions. We ran these calculations for four feed programs including: 1) the use of corn distillers dried grains with solubles (DDGS) and 2) dehydrated retail level food waste, as approaches for recycling nutrients back into pig feed; as well as 3) the use of synthetic amino acids (AA) and 4) enzymes (i.e. phytase), as back-end diet supplementation strategies for minimizing the environmental impact of pork production.

What have we learned?

The inclusion of county level spatial environmental impact data and supply chain connections are significant to this work. Location matters, not just in regional diet mixes, but also in environmental impacts of sourcing ingredients and manure management. With the FoodS3 model is was possible to bring in modeled supply relationships in environmental impact analysis. Similarly, having food waste data nutrient analyses available to test a food waste diet added in a hypothetical “future technology” for pig food that has not been extensively studied.

We found that using the food waste feeding program resulted in the lowest corn input greenhouse gas emissions totals compared with all other feeding programs evaluated in this study. However, for all GHG emissions, the control feeding program had the lowest GHG emissions. While use of synthetic amino acids decreased excretion of volatile solids in manure, it resulted in the greatest greenhouse gas emissions. These emissions are the result of proportionally greater use corn in the synthetic amino acid diets than any other diet (more corn was required to ensure that the diet met the Nutrient Requirement for Swine (NRC, 2012) in our modeled diets). The impact of feeding program on greenhouse gas emissions also varied among geographic regions, where the Mid-West region had the least per pig emissions regardless of the type of diets used in the feeding program. This variation is primarily due to the spatially different emissions of feed ingredients estimated with our FoodS3 model. As expected, water and land use were least for the feeding program based on food waste, while using synthetic amino acids in diets resulted in the greatest water and land use per pig produced.

Future plans

While this study was an important step in bringing spatial heterogeneity to understanding the environmental impacts of pig diets, further work should consider diets with combinations of our alternative ingredients. Most commercially available pig diets already include synthetic AA and inorganic phosphorus (P), and many include DDGS. Furthermore, the diets may have regional variations in more than just corn and soy (which we accounted for), but also in some of our alternative ingredients, such as DDGS and food waste. Future research is needed to compare the environmental impacts of these diets to one that includes food waste as well as examine different rates of inclusion for food waste.

Authors

Jennifer Schmitt1*, Pedro Urriola2, Jae Cheol Jang3; Gerald Shurson4

1 Program Director and Lead Scientist, NorthStar Initiative for Sustainable Enterprise, Institute on the Environment, UMN jenniferschmitt@umn.edu

2 Research Assistant Professor, Department of Animal Science, UMN

3 Post-doctoral Associate Department of Animal Science, UMN

4 Professor-Swine Nutrition, Department of Animal Science, UMN

* Corresponding Author

Additional Information

Bandekar, P. et al., 2014. Life cycle analysis of swine management practices. San Francisco, Proceedings of the 9th International Conference on Life Cycle Assessment in the Agri-Food Sector.

Dubeau, F., Julien, P.-O., & Pomar, C. (2011). Formulating diets for growing pigs: economic and environmental considerations. Annals of Operations Research, 190(1), 239–269. https://doi.org/10.1007/s10479-009-0633-1

FAO. (2013). Food Wastage Footprint: Impacts on Natural Resources—Summary Report. Rome. Retrieved from http://www.fao.org/docrep/018/i3347e/i3347e.pdf

Hellweg, S. & Canals, L., 2014. Emerging approaches, challenges and opportunities in life cycle assessment. Science, 344(6188), pp. 1109-1113.

Macleod, M. et al., 2013. Greenhouse gas emissions from pig and chicken supply chains – a global life cycle assessment, Rome: Food and Agriculture Organization of the United Nations.

Matlock, M., Greg Thoma, B., Eric Boles Mansoor Leh, P., Sandefur Rusty Bautista, H., & Rick Ulrich, P. (2014). A Life Cycle Analysis of Water Use in U.S. Pork Production Comprehensive Report.

Pomar, C., Dubeau, F., Létourneau-Montminy, M.-P., Boucher, C., & Julien, P.-O. (2007). Reducing phosphorus concentration in pig diets by adding an environmental objective to the traditional feed formulation algorithm. Livestock Science, 111(1), 16–27. https://doi.org/10.1016/j.livsci.2006.11.011

Thoma, G., Nutter, D., Ulrich, R., Charles, M., Frank, J., & East, C. (2011). National Life Cycle Carbon Footprint Study for Production of US Swine, 1–75.

Yang, Y. & Heijungs, R., 2016. A general computation structure for regional life-cycle assessment. International Journal of Life Cycle Assessment, pp. 1-9.

Acknowledgements

Funding, in part, was provided by the National Pork Checkoff.

The authors are solely responsible for the content of these proceedings. The technical information does not necessarily reflect the official position of the sponsoring agencies or institutions represented by planning committee members, and inclusion and distribution herein does not constitute an endorsement of views expressed by the same. Printed materials included herein are not refereed publications. Citations should appear as follows. EXAMPLE: Authors. 2019. Title of presentation. Waste to Worth. Minneapolis, MN. April 22-26, 2019. URL of this page. Accessed on: today’s date.

Nutrient Leaching Under Manure Staging Piles

For many livestock producers, manure storage capacity is limited.  Severe weather events can intensify the manure storage capacity limitations.  One option available to producers is to haul manure to the field and place it in manure staging areas.  This can reduce the manure storage capacity needed at the livestock facility, and reduce manure hauling time in the spring.  Hauling of manure to manure staging areas is typically done when convenient, with little thought about the effect of timing and nutrient loss.  This study examined nutrient loss from manure staging piles placed in November, January, and March over a course of five years.

What Did We Do?

This study compared manure staging areas with manure placed at three different times (November, January, and March) and two different bedding materials (straw, no straw).  

For each placement event (November, January, March) manure from the tie stall barn (straw bedding) and the butterfly sheds (sand bedding) at the Utah State University Caine Dairy was hauled to Cache Junction, UT and placed in manure staging piles.  Composite manure samples were collected from each pile (manure type) at the time of placement, and at removal each year (in the fall after crop harvest) for five years. Manure samples were analyzed for ammonium-nitrogen using Method 12-107-04-1-F on a Lachat Flow Injection Analysis (FIA) analyzer and total N using an Elementar combustion analyzer.  Leachate was collected biweekly by means of zero-tension lysimeters installed under the manure staging areas and analyzed for ammonium-nitrogen using Method 10-107-06-2-O and nitrate-nitrogen using Method 10-107-04-1-R on a Lachat FIA analyzer. Soil samples were taken to a depth of 90 cm and analyzed for nitrate-nitrogen using Method 12-107-04-1-F on a Lachat FIA analyzer.

What Have We Learned?

Figure 1. Total N (mg) in leachate/lysimeter under manure staging piles.

Significant leachate was produced under the manure staging piles placed during the winter months, with the manure with no straw (sand bedding) producing more leachate than the manure with straw (straw bedding).  Manure piles placed in November produced less leachate and lost less total N than those placed in January and March (Figure 1). Due to Utah’s dry climate, this is most likely due to drying of the manure in the late fall months, which enabled the manure to absorb more moisture during the winter months. Manure piles placed in January produced the most leachate and exhibited more total N loss (Figure 2).

Difference in manure Total N% from time of placement to removal for land application.
Figure 2.  Difference in manure Total N% from time of placement to removal for land application.

The snow and snow melt most likely contributed to the large amount of leachate and nitrogen loss observed under the January piles.

Future Plans

The results of this study indicate that straw bedding helps retain the nitrogen in the manure and reduce nitrogen loss from manure placed in manure staging piles.  In addition, in Utah’s dry climate, the timing of manure staging pile placement does affect nutrient loss with placement in late November minimizing nutrient leaching.  This information will be presented to producers, NRCS, DWQ, and other ag professionals.

Authors

Rhonda Miller, Ph.D.; Agricultural Systems Technology and Education Dept.; Utah State University, rhonda.miller@usu.edu

Jennifer Long; Agricultural Systems Technology and Education Dept.; Utah State University

Additional Information

Website:  http://agwastemanagement.usu.edu

Acknowledgements

The authors gratefully acknowledge support from Utah State University Experiment Station.


The authors are solely responsible for the content of these proceedings. The technical information does not necessarily reflect the official position of the sponsoring agencies or institutions represented by planning committee members, and inclusion and distribution herein does not constitute an endorsement of views expressed by the same. Printed materials included herein are not refereed publications. Citations should appear as follows. EXAMPLE: Authors. 2019. Title of presentation. Waste to Worth. Minneapolis, MN. April 22-26, 2019. URL of this page. Accessed on: today’s date.

Environmental Impacts of Dairy Production Systems in the Changing Climate of the Northeast

To meet the nutritional needs of a growing population, dairy producers must increase milk production while minimizing farm environmental impacts. As we look to the future, management practices must also be adapted to maintain production under projected climate change. To plan for the future, better information is needed on practices that can reduce emissions from the farm and adapt to changes in the climate while maintaining or improving production and profitability.

What did we do?

We conducted a comprehensive assessment of the effects of climate change on both the productivity and environmental performance of farms as influenced by strategies to reduce emissions and adapt to the changing climate. Production systems were evaluated using three representative northeastern dairy farms: a 1500-cow farm in New York, a 150-cow farm in Wisconsin and a 50-cow farm in southern Pennsylvania. A cradle-to-farm gate life cycle assessment was conducted using farm-scale process-based modeling and climate projections for high and low emission scenarios. Environmental considerations included the carbon footprint of the milk produced and reactive N and P losses from the farms.

What we have learned?

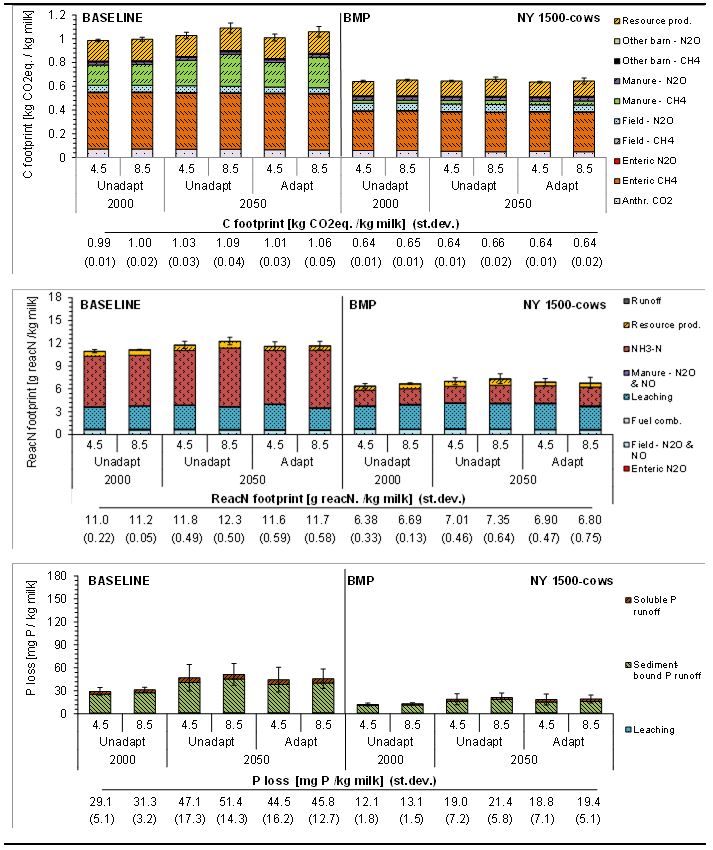
We found that the environmental impact of the three representative dairy farms generally increased in the near future (2050) climate if no mitigation measures were taken. Overall, feed production was maintained as decreases in corn grain yield were compensated by increases in forage yields. Adaptation of the cropping system through changes in planting and harvest dates and corn variety led to a smaller reduction in corn grain yield, but the detrimental effects of climate change could not be fully negated. Considering the increased forage yield, total feed production increased except for the most severe projected climate change. Adoption of farm-specific beneficial management practices substantially reduced the greenhouse gas emissions and nutrient losses of the farms in current climate conditions and stabilized the environmental impact in future climate conditions, while maintaining feed and milk production (See Figure 1 for example results).

Figure 1. Carbon footprint, reactive nitrogen footprint and P loss in recent (2000) and future (2050) climate conditions (RCP4.5 and RCP8.5) for a 1500-cow farm in New York with baseline and Best Management Practice (BMP) scenarios, with and without crop system adaptions in 2050. Error bars represent the standard deviation of IFSM simulations for 3 climate scenarios per RCP. Unadapt = not adapted cropping system. Adapt = adapted cropping system.

The take-home message is that with appropriate management changes, our dairy farms can become more sustainable under current climate and better prepared to adapt to future climate variability.

Future plans

A more comprehensive life cycle assessment is being done by linking the output of the farm model with life cycle assessment software. The process level simulation of the farm provides inventory information for an inclusive life cycle assessment with multiple environmental considerations. This integrated software will provide a more complete sustainability assessment of the potential benefits of alternative management strategies for both now and the future.

Authors

Karin Veltman, University of Michigan; C. Alan Rotz, USDA-ARS; Larry Chase, Cornell University; Joyce Cooper, Washington State University; Chris Forest, Penn State University; Pete Ingraham, Applied GeoSolutions; R. César Izaurralde, University of Maryland; Curtis D. Jones, University of Maryland; Robert Nicholas, Penn State University; Matt Ruark, University of Wisconsin; William Salas, Applied GeoSolutions; Greg Thoma, University of Arkansas; Olivier Jolliet, University of Michigan.

Additional information

Information on the Integrated Farm System Model is available in the reference manual:

Rotz, C., Corson, M., Chianese, D., Montes, F., Hafner, S., Bonifacio, H., Coiner, C., 2018. The Integrated Farm System Model, Reference Manual Version 4.4. Agricultural Research Service, USDA. Available at: https://www.ars.usda.gov/northeast-area/up-pa/pswmru/docs/integrated-farm-system-model/#Reference.

Information on the analysis of Best Management Practices on northeastern dairy farms is available in:

Veltman, K., C. A. Rotz, L. Chase, J. Cooper, P. Ingraham, R. C. Izaurralde, C. D. Jones, R. Gaillard, R. A. Larsson, M. Ruark, W. Salas, G. Thoma, and O. Jolliet. 2017. A quantitative assessment of beneficial management practices to reduce carbon and reactive nitrogen footprints and phosphorus losses of dairy farms in the Great Lakes region of the United States. Agric. Systems 166:10-25.

Acknowledgements

This work was supported by the National Institute of Food and Agriculture, U.S. Department of Agriculture, under award number 2013-68002-20525. Any opinions, findings, conclusions, or recommendations expressed in this publication are those of the authors and do not necessarily reflect the view of the U.S. Department of Agriculture. USDA is an equal opportunity provider and employer.

The authors are solely responsible for the content of these proceedings. The technical information does not necessarily reflect the official position of the sponsoring agencies or institutions represented by planning committee members, and inclusion and distribution herein does not constitute an endorsement of views expressed by the same. Printed materials included herein are not refereed publications. Citations should appear as follows. EXAMPLE: Authors. 2019. Title of presentation. Waste to Worth. Minneapolis, MN. April 22-26, 2019. URL of this page. Accessed on: today’s date.

Cataloging and Evaluating Dairy Manure Treatment Technologies


Proceedings Home | W2W Home w2w17 logo

Purpose

To provide a forum for the introduction and evaluation of technologies that can treat dairy manure to the dairy farming community and the vendors that provide these technologies.

What Did We Do?

Newtrient has developed an on-line catalog of technologies that includes information on over 150 technologies and the companies that produce them as well as the Newtrient 9-Point scoring system and specific comments on each technology by the Newtrient Technology Advancement Team.

What Have We Learned?

Our interaction with both dairy farmers and technology vendors has taught us that there is a need for accurate information on the technologies that exist, where they are used, where are they effective and how they can help the modern dairy farm address serious issues in an economical and environmentally sustainable way.

Future Plans

Future plans include expansion of the catalog to include the impact of the technology types on key environmental areas and expansion to make the application of the technologies on-farm easier to conceptualize.

Corresponding author name, title, affiliation  

Mark Stoermann & Newtrient Technology Advancement Team

Corresponding author email address  

info@newtrient.com

Other Authors 

Garth Boyd, Context

Craig Frear, Regenis

Curt Gooch, Cornell University

Danna Kirk, Michigan State University

Mark Stoermann, Newtrient

Additional Information

http://www.newtrient.com/

Acknowledgements

All of the vendors and technology providers that have worked with us to make this effort a success need to be recognized for their sincere effort to help this to be a useful and informational resource.

The authors are solely responsible for the content of these proceedings. The technical information does not necessarily reflect the official position of the sponsoring agencies or institutions represented by planning committee members, and inclusion and distribution herein does not constitute an endorsement of views expressed by the same. Printed materials included herein are not refereed publications. Citations should appear as follows. EXAMPLE: Authors. 2017. Title of presentation. Waste to Worth: Spreading Science and Solutions. Cary, NC. April 18-21, 2017. URL of this page. Accessed on: today’s date.
USDA-NRCS and the National Air Quality Site Assessment Tool (NAQSAT) for Livestock and Poultry Operations

Proceedings Home | W2W Home w2w17 logo

Purpose

The National Air Quality Site Assessment Tool (NAQSAT) was developed as a first-of-its-kind tool to help producers and their advisors assess the impact of management on air emissions from livestock and poultry operations and identify areas for potential improvement related to those air emissions.

What did we do?

In 2007, several land-grant universities, with leadership from Michigan State University, began developing NAQSAT under a USDA-NRCS Conservation Innovation Grant (CIG). The initial tool included beef, dairy, swine, and poultry operations. A subsequent CIG project, with leadership from Colorado State University, made several enhancements to the tool, including adding horses to the species list. In 2015, USDA-NRCS officially adopted NAQSAT as an approved tool for evaluating air quality resource concerns at livestock and poultry operations. USDA-NRCS also contracted with Florida A&M University in 2015 to provide several regional training workshops on NAQSAT to NRCS employees. Six training workshops have been completed to date (Raleigh, NC; Modesto, CA; Elizabethtown, PA; Lincoln, NE; Richmond, VA; and Yakima, WA) with assistance from multiple NAQSAT development partners. Additionally, USDA-NRCS revised its comprehensive nutrient management plan (CNMP) policy in October 2015 to make the evaluation of air quality resource concerns mandatory as part of CNMP development.

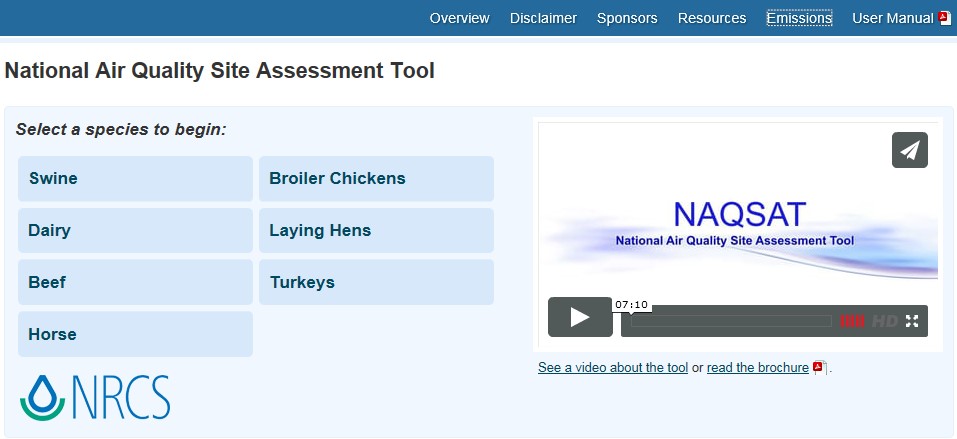
Snippet from website of the National Air Quality Site Assessment Tool

Group photo of team in field

Zwicke in class lecturing

Zwicke and group in animal housing facility

What have we learned?

NAQSAT has proven to be a useful tool for bench-marking the air emissions impacts of current management on confinement-based livestock and poultry operations. In the training sessions, students have been able to complete NAQSAT runs on-site with the producer or producer representative via tablet or smartphone technologies. Further classroom discussion has helped to better understand the questions and answers and how the NAQSAT results can feed into the USDA-NRCS conservation planning process. Several needed enhancements and upgrades to the tool have been identified in order to more closely align the output of the tool to USDA-NRCS conservation planning needs. NAQSAT has also proven to be useful for evaluating the air quality resource concern status of an operation in relation to the CNMP development process.

Future Plans

It is anticipated that the identified needed enhancements and upgrades will be completed as funding for further NAQSAT development becomes available. Additionally, as use of NAQSAT by USDA-NRCS and our conservation planning and CNMP development partners expands, additional training and experience-building opportunities will be needed. The NAQSAT development team has great geographic coverage to assist in these additional opportunities.

Corresponding author, title, and affiliation

Greg Zwicke, Air Quality Engineer – Air Quality and Atmospheric Change Team, USDA-NRCS

Corresponding author email

greg.zwicke@ftc.usda.gov

Other authors

Greg Johnson, Air Quality and Atmospheric Change Team Leader, USDA-NRCS; Jeff Porter, Animal Nutrient and Manure Management Team Leader, USDA-NRCS; Sandy Means, Agricultural Engineer – Animal Nutrient and Manure Management Team, USDA-NRCS

Additional information

naqsat.tamu.edu

https://lpelc.org/naqsat-for-swine-and-poultry

https://lpelc.org/naqsat-for-beef-and-dairy/

Acknowledgements

C.E. Meadows Endowment, Michigan State University

Colorado Livestock Association

Colorado State University

Florida A&M University

Iowa Turkey Federation

Iowa Pork Producers

Iowa Pork Industry Center

Iowa State University

Iowa State University Experiment Station

Kansas State University

Michigan Milk Producers Association

Michigan Pork Producers Association

Michigan State University

Michigan State University Extension

National Pork Board

Nebraska Environmental Trust

Oregon State University

Penn State University

Purdue University

Texas A&M University

University of California, Davis

University of Georgia

University of Georgia Department of Poultry Science

University of Idaho

University of Maryland

University of Maryland Department of Animal and Avian Sciences

University of Minnesota

University of Missouri

University of Nebraska

USDA-ARS

Virginia Tech University

Washington State University

Western United Dairymen

Whatcom County (WA) Conservation District

The authors are solely responsible for the content of these proceedings. The technical information does not necessarily reflect the official position of the sponsoring agencies or institutions represented by planning committee members, and inclusion and distribution herein does not constitute an endorsement of views expressed by the same. Printed materials included herein are not refereed publications. Citations should appear as follows. EXAMPLE: Authors. 2017. Title of presentation. Waste to Worth: Spreading Science and Solutions. Cary, NC. April 18-21, 2017. URL of this page. Accessed on: today’s date.

Nitrogen and Phosphorus Cycling Efficiency in US Food Supply Chains – A National Mass-Balance Approach


Proceedings Home | W2W Home w2w17 logo

Purpose 

Assessing and improving the sustainability of livestock production systems is essential to secure future food production. Crop-livestock production systems continue to impact nitrogen (N) and phosphorus (P) cycles with repercussions for human health (e.g. secondary particle formation due to ammonia emission and drinking water contamination by nitrate) and the environment (e.g. eutrophication of lakes and coastal waters and exacerbation of hypoxic zones). Additionally, P is a limited resource, and sustaining an adequate P supply is a major emerging challenge. To develop strategies for a more sustainable use of N and P, it is essential to have a quantitative understanding of the flows and stocks of N and P within the society. In this study, we developed detailed national N and P budgets to assess nutrient cycling efficiency in US (livestock) food supply chains, to identify hotspots of nutrient loss and to indicate opportunities for improvement!

What did we do? 

1. National nutrient mass-balance

A mass-balance framework was developed to quantify nutrient flows within the US. In this framework, the national US system is represented by 9 major sectors are relevant in terms of nutrient flows: mining (relevant for P only), industrial production, agriculture, food & feed processing industry, retail, households and other consumers, energy and transport, humans, and waste treatment. These sectors can exist of several sub-sectors. For example, the agricultural sector consists of several secondary sub-systems including pasture, agricultural soil, livestock and manure management (WMS – waste management system).

Different livestock categories can have distinct environmental impacts and nutrient use efficiencies (e.g. (Hou et al. 2016), (Eshel et al. 2014), (Herrero et al. 2013)), we therefore distinguish six livestock categories (dairy cattle, beef cattle, poultry (meat), poultry (layers), sheep, hogs) and

 their associated food commodities (dairy products, beef from dairy cattle, beef, poultry, eggs, lamb, pork).

For each sub-system, we identify and quantify major flows to and from this compartment. All flows are expressed in a common unit, i.e. metric kiloton N per year (kt N/yr) for nitrogen and metric kiloton P per year (kt P/yr) for phosphorus. Quantified flows include nutrient related emissions to the environment and waste flows.

At present, the waste sectors and environmental compartment are outside the system boundaries, that is, we quantify flows to these compartments, but we do not attempt to balance these sectors. We do, however, keep track of the exact chemical species (e.g. emission of N2O-N to air instead of N to air) emitted as far as possible. The municipal waste treatment (MSW) and municipal waste water treatment (WWTP) are treated in more detail: major flows from and to these compartments are quantified. These sub-sectors are treated in more detail because of their role in nutrient recycling through e.g. sewage sludge application on agricultural soils.

Data were collected in priority from national statistics (e.g. USDA NASS for livestock population) and peer-reviewed literature, and were supplemented with information from industrial reports and extension files if needed. If available, data were collected for the years 2009 to 2012 and averaged, when unavailable, we collected data for the closest year.

2. Scenario analysis

In the scenario analysis, we test the opportunity for dairy livestock production systems to contribute to a more efficient nutrient use through anaerobic co-digestion of dairy manure and organic food waste. Recently, Informa Economics assessed the national

 market potential of anaerobic digester products for the dairy industry (Informa Economics 2013). Next to a reduction in greenhouse gas emissions, anaerobic co-digestion of dairy manure and organic food waste can contribute to improve nutrient cycling efficiency (Informa Economics 2013). Dairy manure contains high levels of nitrogen and phosphorus, which can be used as a natural crop fertilizer, if recuperated from manure. Presently, non-farm organic substrates such as food waste are typically disposed of in landfills, which causes greenhouse gas (GHG) emissions and also results in a permanent removal of valuable nutrients from the food supply chain (Informa Economics 2013). By anaerobic co-digestion, a part of the nutrien! ts contai ned in dairy manure and food waste can be recovered. These nutrients can be used to fertilize crops and substitute synthetic fertilizer application. In the scenario analysis, we test to what extent anaerobic co-digestion of dairy manure and food waste can contribute to improve nutrient cycling efficiency, particularly by substituting synthetic fertilizers. We develop the scenario based on data provided in the InformaEconomics report.

What have we learned? 

In general, our results show that livestock production is the least efficient part of the total food supply chain with large losses associated with manure management and manure and fertilizer application to crops. In absolute terms, the contribution of the household stage to total and N and P losses from the system is small, approximately 5 and 7% for N and P, respectively. However, households ‘waste’ a relatively large percentage of purchased products, (e.g. 16% and 18% of N and P in dairy products end up as food waste), which presents an opportunity for improvement. A scenario was developed to test to what extent anaerobic co-digestion of dairy manure and food waste can contribute to improving nutrient cycling efficiency on a national scale. Results suggest that 22% and 63% of N and P applied as synthetic fertilizer could potentially be avoided in dairy food supply chains by large scale implementation of anaerobic co-digestion o! f manure and food waste.

Future Plans     

Future research plans include a further development of scenarios that are known to reduce nutrient losses at the farm scale and to assess the impact of these scenarios on national nutrient flows and losses.

Corresponding author, title, and affiliation        

Karin Veltman, PhD, University of Michigan, Ann Arbor

Corresponding author email    

veltmank@umich.edu

Other authors    

Carolyn Mattick, Phd, Olivier Jolliet, Prof., Andrew Henderson, PhD.

Additional information                

Additional information can be obtained from the corresponding author: Karin Veltman, veltmank@umich.edu

Acknowledgements       

The authors wish to thank Ying Wang for her scientific support, particularly for her contribution in developing the anaerobic co-digestion scenario.

This work was financially supported by the US Dairy Research Institute.


The authors are solely responsible for the content of these proceedings. The technical information does not necessarily reflect the official position of the sponsoring agencies or institutions represented by planning committee members, and inclusion and distribution herein does not constitute an endorsement of views expressed by the same. Printed materials included herein are not refereed publications. Citations should appear as follows. EXAMPLE: Authors. 2017. Title of presentation. Waste to Worth: Spreading Science and Solutions. Cary, NC. April 18-21, 2017. URL of this page. Accessed on: today’s date.

Planning for Resilience: Using Scenarios to Address Potential Impacts of Climate Change for the Northern Plains Beef System

Proceedings Home | W2W Home w2w17 logo

Purpose

Resiliency to weather extremes is a topic that Northern Plains farmers and ranchers are already familiar with, but now climate change is adding new uncertainties that make it difficult to know the best practices for the future. Scenario planning is a method of needs assessment that will allow Extension and beef system stakeholders to come together using the latest climate science to discover robust management options, highlight key uncertainties, prioritize Extension programming needs, and provide an open forum for discussion for this sometimes controversial topic.

Overall objectives:

1. Determine a suite of key future scenarios based on climate science that are plausible, divergent, relevant, and challenging to the beef industry.

2. Determine robust management options that address the key scenario drivers.

3. Develop a plan for Extension programming to address determined educational needs.

What did we do?

A team of researchers, Extension specialists, and educators was formed with members from University of Nebraska and South Dakota State University. They gathered the current research information on historical climate trends, projections in future climate for the region, and anticipated impacts to the beef industry. These were summarized in a series of white papers.

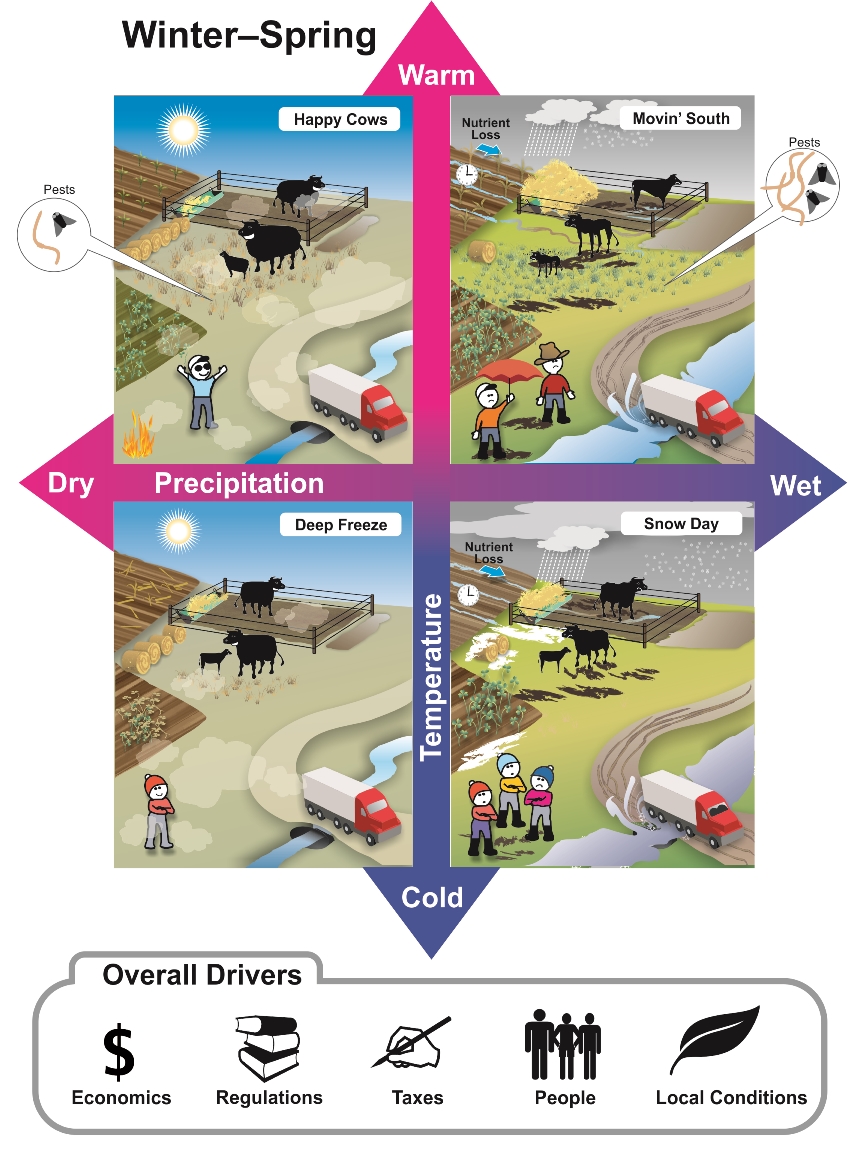
Three locations were selected to host two half day focus groups, representing the major production regions. A diverse group representing the beef industry of each region including feedlot managers, cow calf ranchers, diversified producers, veterinarians, bankers, NRCS personnel, and other allied industries. The first focus group started with a discussion of the participants past experiences with weather impacts. The team then provided short presentations starting with historic climate trends and projection, anticipated impacts, and uncertainties. The participants then combined critical climate drivers as axis in a 2×2 grids, each generating a set of four scenarios. They then listed impacts for each combination. The impacts boundaries were feed production through transporting finished cattle off-farm.

Project personnel then combined the results of all three locations to prioritize the top scenarios, which were turned into a series of graphics and narratives. The participants were then brought together for a second focus group to brainstorm management and technology options that producers were already implementing or might consider implementing. These were then sorted based on their effectiveness across multiple climate scenarios, or robustness. The options where also sorted by the readiness of the known information: Extension materials already available, research data available but few Extension materials, and research needed.

Graphic depicting warm/dry, warm/wet, cold/dry, cold/wet conditions on the farm during winter-spring

Graphic depicting hot/dry, hot/wet, cool/dry, cool/wet conditions on the farm during summer-fall

What have we learned?

The key climate drivers were consistent across all focus groups: temperature and precipitation, ranging from below average to above average. In order to best capture the impacts, the participants separated winter/spring and summer/fall.

This method of using focus groups as our initial interaction with producers on climate change was well received. Most all farmers love to talk about the weather, so discussing historical trends and their experiences with it as well as being upfront with the uncertainties in future projections, while emphasizing the need for proactive planning seemed to resonate.

With so many competing interests for producers’ time, as well as a new programming area, it was critical to have trusted local educators to invite participants. Getting participants to the second round of focus groups was also more difficult, so future efforts should considering hosting a single, full day focus group, or allowing the participants to set the date for the second focus group, providing more motivation to attend.

Future Plans

The scenarios and related management options will be used to develop and enhance Extension programming and resources as well as inform new research efforts. The goal is to provide a suite of robust management options and tools to help producers make better decisions for their operation.

Corresponding author, title, and affiliation

Crystal Powers, Extension Engineer, University of Nebraska – Lincoln

Corresponding author email

cpowers2@unl.edu

Other authors

Rick Stowell, Associate Professor at University of Nebraska – Lincoln

Additional information

Crystal Powers

402-472-0888

155 Chase Hall, East Campus

Lincoln, NE 68583

Acknowledgements

Thank you to the project team:

University of Nebraska – Lincoln: Troy Walz, Daren Redfearn, Tyler Williams, Al Dutcher, Larry Howard, Steve Hu, Matthew Luebbe, Galen Erickson, Tonya Haigh

South Dakota State University: Erin Cortus, Joseph Darrington,

This project was supported by the USDA Northern Plains Regional Climate Hub and Agricultural and Food Research Initiative Competitive Grant No. 2011-67003-30206 from the USDA National Institute of Food and Agriculture.

The authors are solely responsible for the content of these proceedings. The technical information does not necessarily reflect the official position of the sponsoring agencies or institutions represented by planning committee members, and inclusion and distribution herein does not constitute an endorsement of views expressed by the same. Printed materials included herein are not refereed publications. Citations should appear as follows. EXAMPLE: Authors. 2017. Title of presentation. Waste to Worth: Spreading Science and Solutions. Cary, NC. April 18-21, 2017. URL of this page. Accessed on: today’s date.
Scenario Planning for the New York State Dairy Industry in a Changing Climate

Proceedings Home | W2W Home w2w17 logo

Purpose

Climate change is a slow and continual process that has been gradually changing our weather, and it will continue to occur. In order to adapt to such gradual changes, much foresight and planning is needed. The input-gathering process undertaken for this exercise was intended to compile information from stakeholders that was used to determine various scenarios of what future dairy production will look like, under specific climate change scenarios.

A survey of producers’ perspectives performed in 2014 yielded useful information regarding the beliefs of many New York State (NYS) dairy farmers. The survey showed that the majority of these farmers believe that they and their peers must adapt to climate changes they are currently facing, in the coming decades, in order to continue to grow and expand the industry in a sustainable manner. The scenario planning process will aid producers and their advisors in determining which adaptation strategies will be most effective to become more resilient to the climate changes that are projected in the near-term future for New York.

What did we do?

A Scenario Planning exercise was conducted throughout 2016 in preparation to help NYS producers imagine a future that involves the changes in climate that are projected over roughly the next 50 years. Scenario planning is a process that involves stakeholder input to develop multiple future scenarios based on a few key variables that will affect and change the way a system functions currently. It is a unique process in that it is not probability-based rather, it is based on the views of stakeholders and experts who choose the variables to be presented in a divergent fashion.

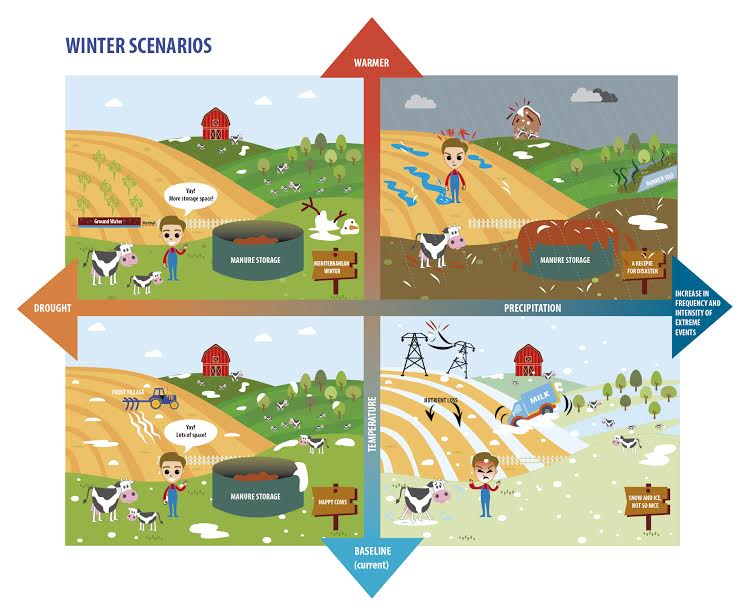
A workshop was held in July 2016 which gathered input from 12 stakeholders, and this input was then combined with current climate projections and other resources, to develop 8 comprehensive scenarios, 4 for the winter season and 4 for the growing season. The final scenarios are visual representations and are paired with qualitative narratives to explore the impacts of the divergent situations that are created. The final narratives provide a useful communications tool to share with farmers and other stakeholders, to explore the impacts of the climate variables involved.

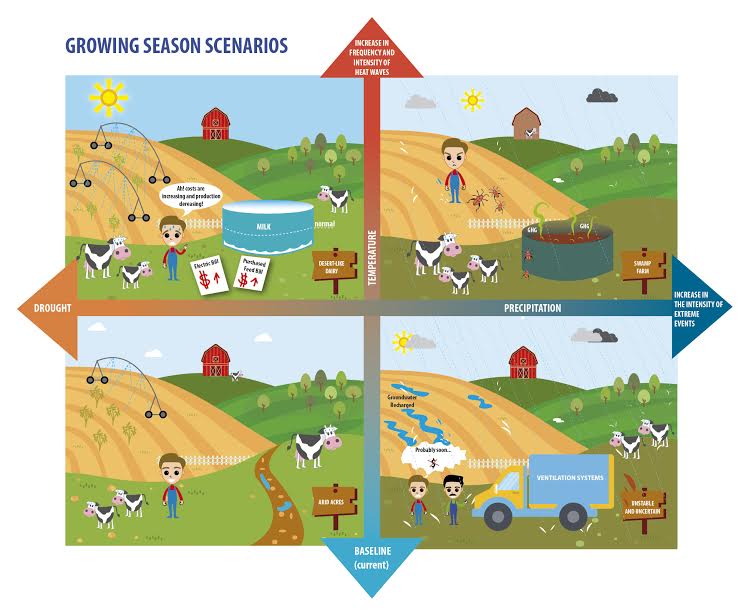
Growing season scenarios 1Winter scenarios

What have we learned?

The exercise focused on temperature and precipitation changes for New York State, and the impacts to various aspects of the farmstead on a typical New York dairy farm. Scenarios were created for both winter and growing seasons, since the range of impacts is highly season dependent. The divergent scenarios created are presented in Figure 1 (growing season scenarios) and Figure 2 (winter season scenarios). Qualitative narratives were developed to describe in-depth the interactions that occur in each situation, for example, impacts to: the herd, the farmstead, manure management, farm economics, and finally with the farmer and personnel. Furthermore, once each situation is described fully, the next level of impact explores outside variables, for example, regional economic or political changes, population growth or social changes, or nation-wide or world-wide events that could have a significant impact on the specific farm situation presented.!

Future Plans

Next steps include identifying the best management strategies to handle the challenges presented in each resulting scenario. The final scenarios are presented in such a fashion that they will be useful tools to inform farm management, planning and decision making. The final scenarios can be used to examine how a certain set of management actions would perform under various future climatic conditions. “Robust” management actions need to be identified that would be the most highly effective under all scenarios considered, in other words, best management practices need to be identified that make the most sense to invest in, to be prepared for as many of the scenarios created as possible. In the same effort, it is important to identify management actions that are ineffective or that have little impact for a majority of the future scenarios developed. Pursuing actions that only work under a few of the projected scenarios is not in! line wit h smart planning to make the farm as resilient as possible. This preparation is a significant step towards helping farms be resilient in the face of unexpected future changes.

Corresponding author, title, and affiliation

Jennifer Pronto, Co-founder, BioProcess Analytics, LLC

Corresponding author email

jenny.pronto@gmail.com

Other authors

Curt Gooch, PE, Cornell University

The authors are solely responsible for the content of these proceedings. The technical information does not necessarily reflect the official position of the sponsoring agencies or institutions represented by planning committee members, and inclusion and distribution herein does not constitute an endorsement of views expressed by the same. Printed materials included herein are not refereed publications. Citations should appear as follows. EXAMPLE: Authors. 2017. Title of presentation. Waste to Worth: Spreading Science and Solutions. Cary, NC. April 18-21, 2017. URL of this page. Accessed on: today’s date.