NRCS has started a pilot project to test existing animal waste storage facilities for seepage using the DeltaProbeTM Seepage meter. The DeltaProbeTMseepage meter is the result of an NRCS Conservation Innovation Grant (CIG) to develop a device to quickly and directly measure seepage rates from waste storage ponds or lagoons. The pilot project will assess the use of the equipment under a variety of regional, environmental and climatic conditions.
What did we do?
The DeltaProbeTM Seepage meter was developed in Michigan through an NRCS Conservation Innovation grant (CIG) with Nth Consultants, Ltd. and Abletech Industries, LLC.
NRCS purchased two seepage meters and trained six individuals to operate the device. The device is used in conjunction with a weather station on site to collect data.
Standard Testing procedure has been developed.
Initial testing under the CIG was performed in Michigan. A pilot test was performed in Washington state on an HDPE lined waste storage facility during 2018. Further testing was planned for the winter months of 2018, but the extremely high rainfall has precluded testing.
What we have learned?
The equipment has the potential to provide “whole pond” testing of a waste storage facility overnight under suitable conditions. The device can measure the change in the depth of water surface with a 95% confidence interval to the nearest 0.035 mm over a 25.4 mm range in 8 hours overnight.
Testing results in a snapshot of seepage rate under the conditions during the timeframe which the test is performed.
The equipment requires training for proper setup, use and to review the results of testing.
Future plans
Further testing will take place on waste storage facilities in North Carolina and Kansas in 2019.
Agricultural Research Service (USDA, ARS) will be providing a test of the equipment.
Authors
Sandra L. Means, Environmental Engineer, USDA-NRCS, National Animal Manure Nutrient Management Team, Greensboro, North Carolina. Sandy.Means@gnb.usda.gov
Bill Reck, National Environmental Engineer, USDA, NRCS.
The authors are solely responsible for the content of these proceedings. The technical information does not necessarily reflect the official position of the sponsoring agencies or institutions represented by planning committee members, and inclusion and distribution herein does not constitute an endorsement of views expressed by the same. Printed materials included herein are not refereed publications. Citations should appear as follows. EXAMPLE: Authors. 2019. Title of presentation. Waste to Worth. Minneapolis, MN. April 22-26, 2019. URL of this page. Accessed on: today’s date.
Provide leaders with information to develop a well-planned crowd-sourced data application that improves communication and speed response times in disasters. Recognize the potential benefits of crowd-sourced and employee-sourced real-time geospatial data during emergency response. Present steps taken by United States Department of Agriculture – Natural Resources Conservation Service (NRCS) Texas State Office for the deployment of the “dead cow tool” and share lessons learned. Provide a framework of questions and items that need to be addressed for the successful deployment of a real-time data collection tool.
What Did We Do?
In response to Hurricane Harvey in the fall of 2017, the Texas NRCS GIS staff developed on-line reporting tools to collect real-time data related to damages and animal mortalities that could be used by employees and the public. ESRI’s ArcGIS Collector Application was selected for its ease of use, ability to be used when off-line, and staff familiarity with the tool’s programming language. In this case, NRCS already had the necessary licensing for ArcGIS Online accounts.
The “dead cow tool” is a near real-time reporting tool for the public to identify locations, types and magnitude of agricultural losses. This provides NRCS and other agencies with data to request funding for emergency response and recovery funds to assist the local agricultural producers. However, significant concerns were raised relative to releasing the application for public use, so the data collection applications were then limited to a handful of NRCS employees within the disaster areas.
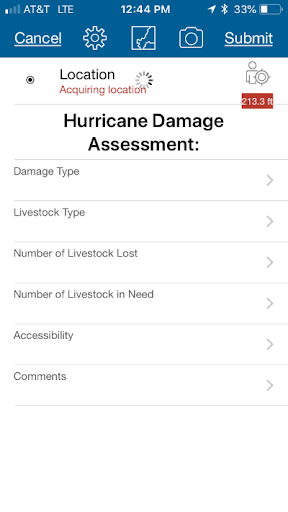
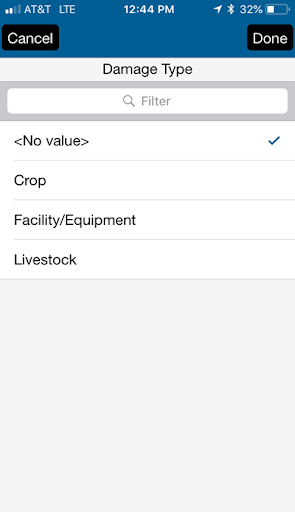
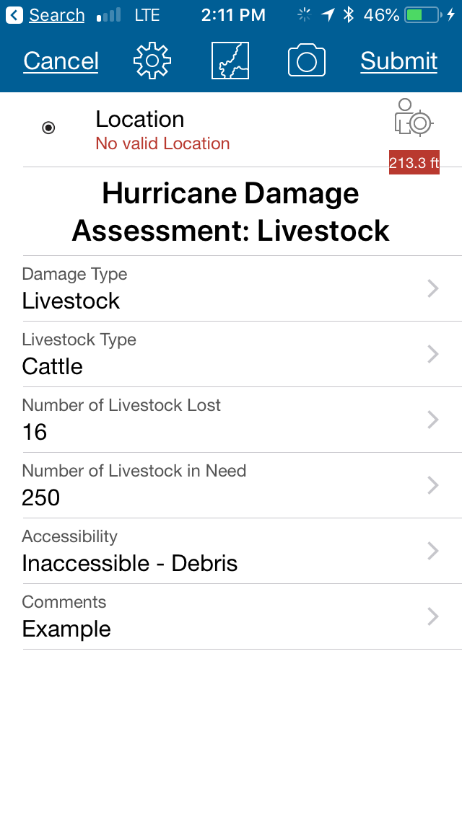
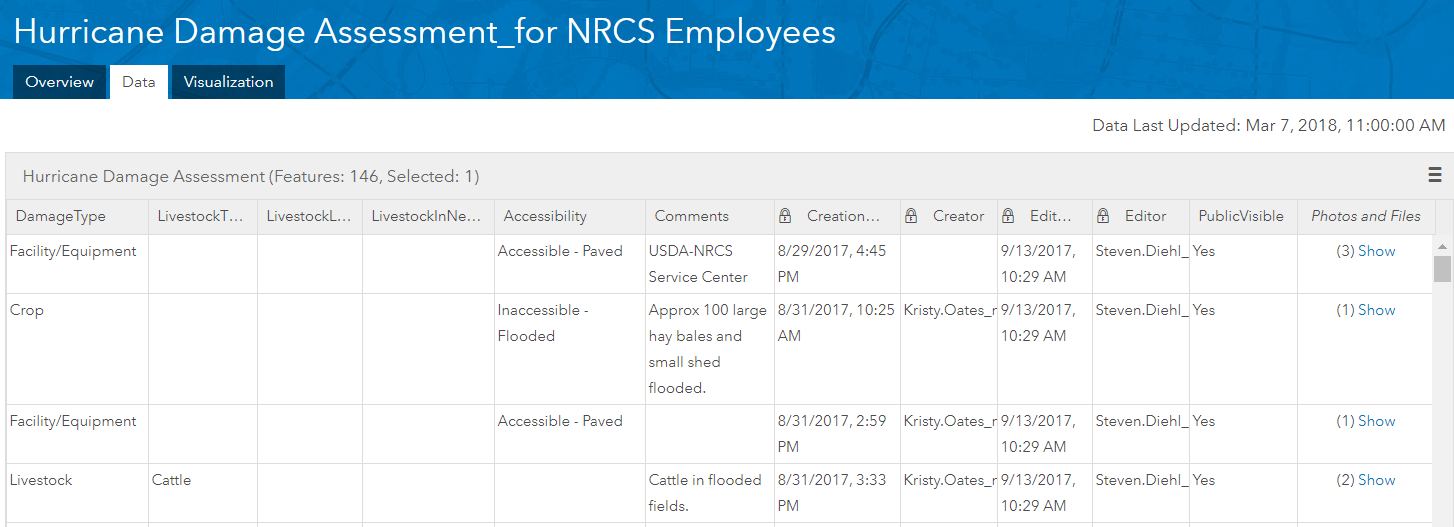
The Dead Cow Tool (displayed as Hurricane Harvey Data Collector Map) was designed to collect the following parameters: Damage Type; Livestock Type; Number of Livestock Lost; Number of Livestock in Need; Accessibility; and Comments. There was also an option to add or take images and add the location from a map previously downloaded onto a user’s mobile device (if network connectivity was lacking). Here are a few screenshots to serve as an example from an iPhone (Figures 1 – 6):
Figure 1. Data collection maps developed in response to Hurricane Harvey
Figure 2. Main data collection screen for the “Dead Cow Tool” aka Hurricane Harvey Collector Map
Figure 3. Options for damage types in the “dead cow tool”
Figure 4. Completed Livestock Damage Assessment ready to be submitted. There is includes the option to add a photo.
Texas NRCS developed and deployed another tool for employees to complete Damage Survey Reports while in the field. “In Hurricanes Ike and Rita, staff went out in the field, took handwritten notes about the damage, wrote down the location, took pictures and then had to return to the office, to download and enter the information on their computer. They had to look up the latitude and longitude points from their notes to document the exact location and then save all that information in several different locations. It was a long process for our staff,” says NRCS State Soil Scientist Alan Stahnke. “I knew there had to be a way to make it more efficient for them.” Stahnke had been working with Steven Diehl, GIS technician, and others on his staff for several months on an ArcGIS application, ArcCollector, based on ESRI map data. They had the basics down and when Hurricane Harvey showed up on the radar, they knew they had to work fast to get the application ready for staff in the wake of Harvey’s wrath. The resulting smart phone device field tool – the Hurricane Harvey Damage Reporter – is a method to record the damage and collect information on all the points into a central database. (Littlefield, 2017)
The Damage Survey Report tool reduced the time needed by field engineers by approximately 50% from the previous method. The data was available to others with access as it was entered – thereby providing timely data to managers and leadership. Additionally, it allowed the final reports to be developed by state office personnel further reducing the time required by the field – allowing them to take care of other pressing matters.
Figure 5. Screenshot of Data Collected and viewed through ESRI’s ArcGISOnline Portal
Figure 6. Screenshot of visual map of data collected through ESRI’s ArcGIS Online Portal
What Have We Learned?
Several lessons were learned: First, approve policies on data collection prior to the disaster – these need buy-in and flexibility. Second, decide how data will be released and identify typical reports. Third, develop Data Collection Applications in advance – allowing testing, training, familiarity, and formatting needed for user-friendliness. Fourth, select the correct Data Collection Tool. Fifth, identify data collection alternatives if the application cannot be realistically utilized – power outages, lack of network connection, closed roads, flooded areas, etc.
It is important to prepare, plan, and train prior to a disaster to allow time to adjust and/or develop policies and reduce knee-jerk reactions.
Data collection can have negative impacts if not properly administered and protected. Several identified concerns during Hurricane Harvey were protecting the data collected, preventing submittal of inappropriate language and/or photos, potential for someone submitting the data to believe that they had applied or requested assistance, and data distribution. Our NRCS GIS specialists (Texas and across the US) worked with ESRI developers to overcome some of the data protection and prevention of inappropriate material. However, obtaining clearance from leadership for public-use of the application was not obtainable in a timely matter.
Real-time data collection is a useful tool for both internal customers and the public when faced with a disaster and allows the timely coordination of resources for rapid response and recovery.
Disasters such as Hurricane Harvey require significant resources for response and recovery. Real-time data collection can aid in allocating resources. With animal mortalities, it is important that animals in sensitive environmental areas are properly disposed of in a timely manner. NRCS has provided technical and financial assistance for proper carcass disposal following natural disasters to reduce the associated environmental risk.
Generating Reports and Maps with Information Collected — Recognize the market impacts of sharing reported losses. NRCS must follow applicable federal rules and regulations to related to personally identifiable information. Generally, a report could be published with information grouped by county based on collected data provided there is more than one producer in the county with that type of livestock or commodity. For example, if there is only one farm in a county with emus, and the producer reported their losses of 50% of their emus, USDA Agencies could not share that data, as the producer could then be identified.
Policies are needed to address data collection with public interfaces. Consider modifications to existing policies or creating new policies to allow the use of crowd-source data.
The intent of the app and intended use of the data must be clearly conveyed to users. USDA Agencies raised concerns the public would believe that the tool indicated that they were applying for assistance, not simply reporting. (Stahnke, Jannise, & Northcut, 2018)
Prior to collecting data, appropriate policies should be written that address, how, when, where and why the information is needed and how it will be used in accordance with federal data collection requirements. The policies should be reviewed internally by a variety of users to ensure that the policy is clear and provides adequate accountability. Buy-in from all levels is needed prior to launching a data collection system to the public. Depending upon the type of organization that is collecting the data – a variety of controls may need to be established to protect the data.
How the data will be collected and shared– this area should allow flexibility. Allowing public to enter data using their own devices may be necessary to obtain the data in a timely manner. What will public users gain by sharing their information?
Will the data be shared with other agencies, non-governmental organizations (NGOs), etc.?
If employees are allowed to use their own device, is there a possibility of a litigation hold on the personal device? (USDA – Forest Service, Mobile Geospatial Advisory Group, 2015)
When does the data need to be collected? This may vary – for example, the number and type of livestock lost in a sensitive area may need to be reported as soon as the livestock are found; flooded fields and associated losses, road closures, or areas with downed power lines may have some lag-time in reporting over a period of several weeks as roads and properties become available for inspection
Where does the data that has been submitted get collected?
Who is going to oversee the data collection and create needed reports?
Will the data be adequately protected? As mentioned, some of the data collected, particularly with potential images and audio embedded with file attributes, will likely include personal or sensitive data that must be protected.
Why is the data being collected?
Will it serve a purpose and be used?
Can the data be potentially abused?
What level of data integrity is required?
Will certification or training be required for various users?
Will additional weight be placed on data from “authenticated” or “certified” users?
Who will be required to review of the proposed data collection system?
Should these vary based on the scope of the project? Setting the review levels and identifying who is authorized for deployment of the tool in advance is helpful to know what rules need to be followed. Some flexibility should be provided to allow modifications and adaptations as needed during an emergency.
Selecting the appropriate data collection tool and platform is critical to success. There is an organization “Principles for Data Collection” that has created a guidance document for mobile data collection (MDC). Additionally, they host a “Digital Principles Forum — an online meeting place for peer learning, connection building, and debate on the Principles for Digital Development. Together with you, we aim to build a community that connects ICT4D, information technology, and international aid and humanitarian development practitioners with thoughtful curated content, relevant conversation and quality opportunities to improve their work.”
“How to Choose a Mobile Data Collection Platform” is a guidance document prepared by the Principal for Data Collection group. Below are some of the considerations that they have identified:
Consider data and security needs including personal or sensitive data.
Consider the ecosystem – following a disaster, internet and wireless connections may be intermittent or non-existent.
Identify and prioritize selection criteria
Short-term and long-term costs
Number of users, surveys, and items
Devices and data requirements for enumerators
Security and privacy compliance
Integration with other technology
Offline collection
Short Message Service (SMS) integration
Unstructured Supplementary Service Data Integration
Authentication and user roles
Skip logic and data parameters
Data analysis
GIS and mapping
Language
Photos, audio and video
Ease of setup and use
Research MDC platform options
Rank options
Consider whether to customize an MDC platform
Select and test your platform.
TIP: Be sure to test several devices in your context before making a final selection.
(Principles for Digital Development, 2018)
When developing and testing applications, consider the following:
Users accessibility to AGOL, i.e., do they need a login in their company’s Enterprise ESRI platform or is the application in the public domain on AGOL.
Amount of training required for user to input
Ease of navigation and number of clicks required to complete form
Varying size of screens on user devices (small screens vs. tablets)
Test with a variety of different levels of users
Types of reports and training required for the administrator
Duration of the application and availability
Creating sample reports and identifying who can see specific data in advance will aid when a disaster does occur. In Texas, this type of data might be useful to the Texas Animal Health Commission, and other agencies involved in Emergency Support Function #11 – Agriculture and Natural Resources Annex (ESF-11).
The following items should be further investigated for disaster related activities:
FEMA’s National Incident Management System
How to share some information with users that have input data – allows them to know that their data is being utilized for a worthy cause
Identifying other agencies that are working on recovery efforts with the same groups
Setting up mechanisms to share data automatically rather than relying on an individual to send out reports
Methodologies for ground-truthing and screening data quickly
Explore the possibilities of utilizing ESRI’s WorkForce application to track locations of employees for safety and workflow coordination.
It is important to consider that even with the best tools developed and ready for deployment – they might not be able to be used in the field if there is no power to charge the mobile data collection device or ability to transmit the data back to the database. Considerations of solar chargers for the mobile devices for employees might be helpful. Establishing alternate methods of communication such as, but not limited to, land lines, postal mail, drop off locations, leaving surveys at the gates, and 800 phone numbers should be implemented.
Future Plans
There are infinite possibilities for the collection and use of real-time data in a disaster. It is the opinion of the authors that the potential benefits greatly outweigh the risks of not obtaining and utilizing the data. We will continue to share the lessons learned to help others implement solid data collection tools.
Authors
Cherie LaFleur, P.E., Environmental Engineer, USDA – Natural Resources Conservation Service, Central National Technical Service Center, Fort Worth, Texas. Cherie.lafleur@usda.gov
Collins, C. (2017, October 27). Retrieved from Texas Observer: https://www.texasobserver.org/agriculture-losses-estimated-200-million-harvey/
Fannin, B. (2017, October 27). Texas agricultural losses from Hurricane Harvey estimated at more than $200 million. Retrieved from AgriLife Today — Texas Agrilife Extension: https://today.agrilife.org/2017/10/27/texas-agricultural-losses-hurricane-harvey-estimated-200-million/
Littlefield, D. A. (2017, September). NRCS Develops New Web App to Expedite Agency Response to Harvey. Retrieved from USDA-NRCS: https://www.nrcs.usda.gov/wps/portal/nrcs/detail/tx/newsroom/stories/?cid=nrcseprd1351676
Principles for Digital Development. (2018, May 8). How to Choose a Mobile Data Collection Platform. Retrieved from Digital Principles: https://digitalprinciples.org/wp-content/uploads/PDD_HowTo_ChooseMDC-v3.pdf
Stahnke, A., Jannise, P., & Northcut, M. (2018, 05 15). USDA NRCS Texas Personnel. (C. Stanley, Interviewer)
The Weather Company. (2017, September 2). Historic Hurricane Harvey’s Recap. Retrieved from The Weather Company: https://weather.com/storms/hurricane/news/tropical-storm-harvey-forecast-texas-louisiana-arkansas
USDA – Forest Service, Mobile Geospatial Advisory Group. (2015, August). Internal Document: Collector for ArcGIS Field Data Collection Pilot for Enterprise GIS Using ArcGIS Online.
Acknowledgements
Alan Stahnke, State Soil Scientist, NRCS, Temple, TX.
Pam Jannise, State GIS Specialist, NRCS, Temple, TX.
Steven Diehl, Cartographic Technician, NRCS, Temple, TX.
Mark Northcut, Landscape and Planning Staff Leader, NRCS, Temple, TX.
The authors are solely responsible for the content of these proceedings. The technical information does not necessarily reflect the official position of the sponsoring agencies or institutions represented by planning committee members, and inclusion and distribution herein does not constitute an endorsement of views expressed by the same. Printed materials included herein are not refereed publications. Citations should appear as follows. EXAMPLE: Authors. 2019. Title of presentation. Waste to Worth. Minneapolis, MN. April 22-26, 2019. URL of this page. Accessed on: today’s date.
Soluble nutrients are believed to be contributing to the recent high-profile impacts in the Great Lakes including excessive cyanobacteria growth (Ohio 2010; Baker et al. 2014). Retaining nutrients, and especially phosphorus in the Great Lakes region, on crop land is also important to the producer as it is non-renewable, scarce, expensive, exhibits high price variability, and can cause adverse environmental impacts when discharged into fresh water systems.
This research program was designed to quantitatively investigate preferential flow pathways caused by macropores by conducting field analyses using the mobile macropore characterization unit. Such pathways enable soluble nutrients, such as phosphorous, to rapidly migrate through soil, into tile drains, and then to surface water (Geohring et al. 2001; Heathwaite and Dils 2000). Results, along with site characteristics such as farm-management practices, topography, soil texture, depth to water table, depth and spacing of subsurface drains, if applicable, topography, and proximity to surface water, enable the qualitative selection of the best management practice to retain nutrients. This approach recognizes that all farm fields are unique and best practices to maximize nutrient uptake and minimize its transport off site are not equally applicable
What did we do?
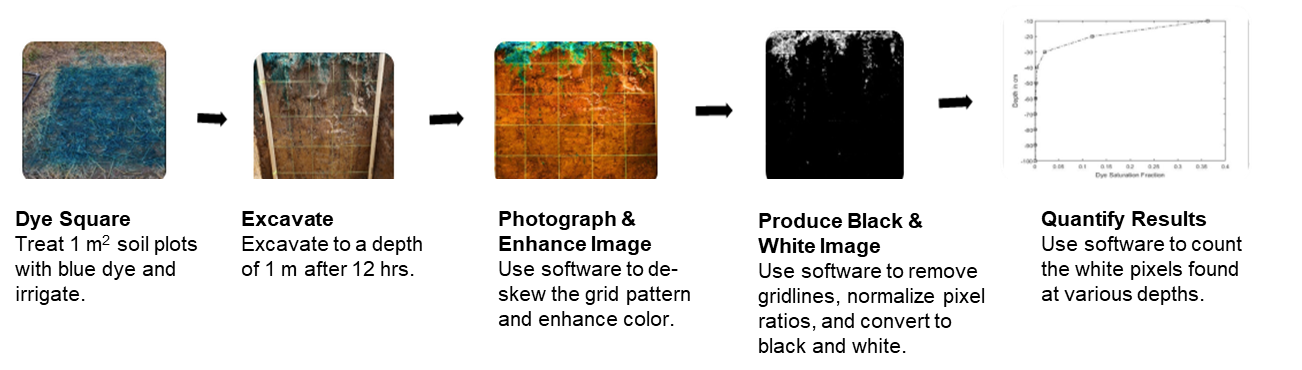
Forrer et al., 2000, developed a visual technique to assess liquid flow through microporous soil. The technique entails adding dye to small plots of saturated soil and excavating trenches in each area. This method was expanded by photographing the soil profiles, processing the image to convert pixels with dye to white and soil without dye to black, and quantifying each with depth using MATLAB (Figure 1). The result is an estimate of the amount and extent of the macropores.
Figure 1. Assessment of Soil Macropores
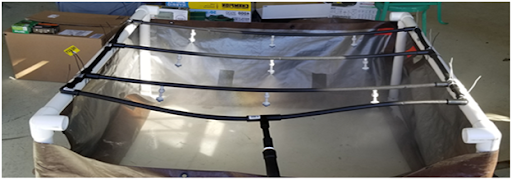
This technique was packaged into the mobile macropore characterization unit to allow for efficient measurements (Figures 2 and 3).
Figure 2. Mobile Macropore Characterization Unit
Figure 3. Dye and Water Distribution Unit using Sprinklers
What we have learned?
Five sites across Michigan with varied management practices and soil structure were tested using the newly developed protocol as shown in Figure 4.
Figure 4. Representative Images from Five Sites using Dye Tracer Study
What are the next steps?
The mobile micropore characterization unit will be used extensively at an ongoing edge-of-field monitoring research site in Michigan to develop correlations between soluble pollutants in the tile drain water and quantitative macropore characterization. Thereafter, the unit will be used by extension educators for field-specific measurements to help producers decide on the most appropriate best management practices.
Authors
Steven I. Safferman1, Jason S. Smith2, Thiramet Sothiyapai3, Ehsan Ghane4
1 Associate Professor; Michigan State University, Biosystems and Agricultural Engineering; Corresponding Author: SteveS@msu.edu
2 Teaching Specialist, Michigan State University, Engineering CoRe
3 Undergraduate Research Assistant, Michigan State University, Biosystems and Agricultural Engineering
4 Assistant Professor and Extension Specialist, Michigan State University, Biosystems and Agricultural Engineering
Additional Information
Baker, D. B., R. Confesor, D. E. Ewing, L. T. Johnson, J. W. Kramer, and B. J. Merryfield. 2014. “Phosphorus Loading to Lake Erie from the Maumee, Sandusky and Cuyahoga Rivers: The Importance of Bioavailability.” Journal of Great Lakes Research 40 (3): 502–17. https://doi.org/10.1016/j.jglr.2014.05.001.
Forrer, I., A. Papritz, R. Kasteel, H. Flühler, and D. Luca. 2000. “Quantifying Dye Tracers in Soil Profiles by Image Processing.” European Journal of Soil Science 51 (2): 313–22. https://doi.org/10.1046/j.1365-2389.2000.00315.x.
Geohring, Larry D, Oloro V Mchugh, M Todd Walter, Tammo S Steenhuis, M Saleem Akhtar, and Michael F Walter. 2001. “Phosphorus Transport Into Subsurface Drains By Macropores After Manure Applications :” Soil Science 166 (12): 896–909.
Heathwaite, A. L., and R. M. Dils. 2000. “Characterising Phosphorus Loss in Surface and Subsurface Hydrological Pathways.” Science of the Total Environment 251–252: 523–38. https://doi.org/10.1016/S0048-9697(00)00393-4.
Ohio, E P A. 2010. “Ohio Lake Erie Phosphorus Task Force Final Report.” Ohio EPA OH Task Force.
Acknowledgements
This project was funded by the Michigan Soybean Promotion Committee, Corn Marketing Program of Michigan, and Michigan Wheat Program. The author wish to acknowledge contributions from Brendon Kelly, Lyndon Kelly, Steve Miller, and the MSU Soil and Plant Nutrient Laboratory.
The authors are solely responsible for the content of these proceedings. The technical information does not necessarily reflect the official position of the sponsoring agencies or institutions represented by planning committee members, and inclusion and distribution herein does not constitute an endorsement of views expressed by the same. Printed materials included herein are not refereed publications. Citations should appear as follows. EXAMPLE: Authors. 2019. Title of presentation. Waste to Worth. Minneapolis, MN. April 22-26, 2019. URL of this page. Accessed on: today’s date.
Livestock farming practices and technologies, like many aspects of agriculture and industry, continue to evolve. As technology and attitudes change regarding livestock farming, public response changes as well; this is reflected in the way that people talk and write about the subject. This change and growth is a common topic of both public and technical debate and scrutiny. Databases on the internet collect public articles and documents related to livestock farming dating back to the early 1980’s. The information in these articles can be evaluated using a number of computer science based approaches. These data can help to highlight how significant past events and their impacts were perceived, and possibly predict how future trends within the industry will be described in popular press/media.
What Did We Do?
We gathered popular press articles from an online database, Factiva, with the search terms “livestock and odor,” from the year 2000 to the present. A computer program developed using machine learning processes: (1) cleans and structures the individual articles into text files; and (2) quantifies the importance and frequency of words in individual and groups of articles, by year. The program assigns two measures of importance to each word. Words that frequently occur in many articles per year provide broad overarching ideas and subjects. Words that are deemed important to each individual article provide more nuanced data including companies, people, and equipment discussed in livestock farming. To demonstrate the results, this data is visualized in tables and graphs to show patterns in subjects as they develop and change over time.
What Have We Learned?
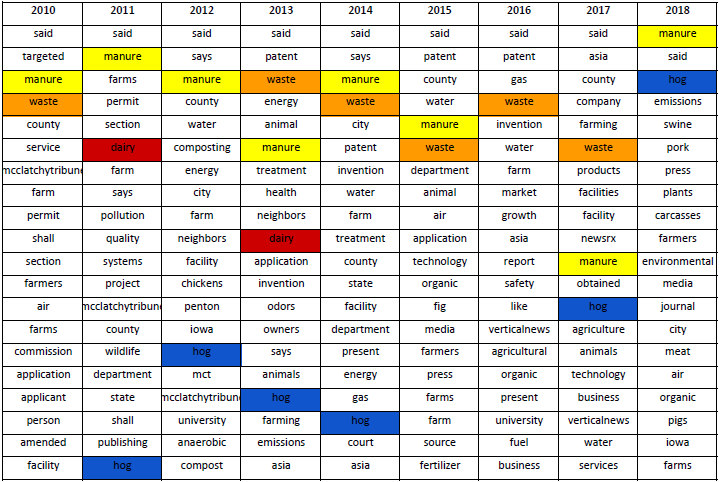
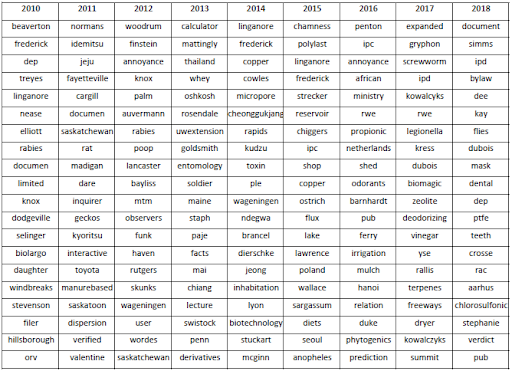
This analysis method gives us a quantitative basis for reviewing the change in importance of words over time. All analysis after choosing the subject and search terms is done by a computer program, protecting the outcomes from reader bias. Changes in word importance or frequency can be supported with numerical data and easily visualized from year to year. The different approaches also allow for inferences between long-term subjects and ideas (Table 1), and shorter term players in the industry (Table 2).
This analysis method does not pull out the context that any of the words are used. Manure and waste are two means of describing the same material, with different connotations. Manure and waste appeared at similar frequencies in many, but not all years. Dairy was more prominent in 2011 and 2013, but hogs (or synonyms) appeared in most years. Refinements to the article search protocol could limit the articles to those of opinion (i.e. editorials) or regional perspectives. There are opportunities for this method to inform historical reviews of livestock and the environment, and inform future communication efforts.
Future Plans
There are a number of opportunities to extend this project in the future. One would be to experiment with different search terms and databases to see how outcomes depend on the data source. Another opportunity would be to apply the quantitative method to other applications. The computer program could be applied to any database and so the method has utility to topics other than livestock farming.
Authors
Ryan Felton, Undergraduate Research Assistant, University of Minnesota
Erin Cortus, Assistant Professor and Extension Engineer, University of Minnesota
ecortus@umn.edu
Additional Information
Project support provided by the University of Minnesota UROP program.
Table 1. The top twenty words by year that most frequently appeared in a popular press article database search based on the keywords “livestock and odor”, by year. The relative frequency of some livestock types (cattle, hog, dairy) and manure-related words (manure, waste) are highlighted.
Table 2. The top twenty words by year that were the important focus of articles in a popular press article database search based on the keywords “livestock and odor”.
The authors are solely responsible for the content of these proceedings. The technical information does not necessarily reflect the official position of the sponsoring agencies or institutions represented by planning committee members, and inclusion and distribution herein does not constitute an endorsement of views expressed by the same. Printed materials included herein are not refereed publications. Citations should appear as follows. EXAMPLE: Authors. 2019. Title of presentation. Waste to Worth. Minneapolis, MN. April 22-26, 2019. URL of this page. Accessed on: today’s date.
Anaerobic digestion of swine manure is a treatment process that can be used to reduce odor emissions, generate bioenergy, and reduce methane emissions. Studies and models are available that can be used to quantify methane production, and volatile solids (VS) reduction rates. Few provide information on the plant nutrient contents of digested manure. Such information is needed to develop nutrient management plans to use digester effluent to produce crops, biomass, or as a nitrogen source for making compost in an environmentally responsible manner. The objective of this study was to observe the reductions and transformations of solids (TS, VS), nitrogen, phosphorous, potassium, and sulfur resulting from anaerobic digestion.
What did we do?
Fresh swine manure was obtained from the gestation barn at the Starkey Swine Center at Clemson University (Figure 1), and large supernatant samples were obtained from the lagoon on-site. The solid manure from the gestation floor was diluted with supernatant from the lagoon to obtain three total solids (TS) concentrations. The target total solids concentrations were 1%, 1.2%, and 2%. Dilutions in this range were selected because they were representative of common ranges of liquid swine manure removed from modern production facilities. This also provided three levels of organic load (OL) that was defined by the VS concentration of the mixtures (g VS/L). The dilutions that were actually achieved were 0.9%, 1.2%, and 1.9% total solids with volatile solids (VS) concentrations of 6.10, 9.05, and 13.75 g VS/L.
Since lagoon water was used for dilution in a manner similar to the operation of a recycled flush system no additional seed material was needed. The microorganisms needed for anaerobic digestion already existed in the manure.
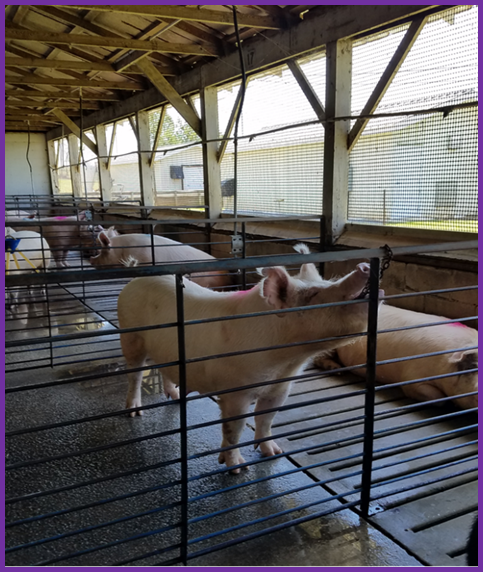
Figure 1. Naturally ventilated gestation barn at the Starkey Swine Center at Clemson University.
Batch Anaerobic Digestion
The three mixtures of swine manure and lagoon water were anaerobically digested using 1.8L batch reactors that were maintained at 35 C in a heated water tank as shown in Figure 2. Three 1.8L bottles were used for each of the three liquid swine manure mixtures to give a total of 9 reactor bottles. Complete details of the batch method used is provided by Chastain and Smith (2015).
Figure 2. Aquarium used to provide a heated water bath (35°C) that held the nine, 1.8-L batch reactors.
The reactor bottles were digested for 56 to 74 days. The pH of the bottles was measured daily and was used as the primary parameter to monitor digestion progress. Biogas production was also monitored by collecting it in 3-L Tedlar® bags, one per reactor bottle. The day on which the gas collection bags were emptied was recorded and provided a secondary parameter to determine when digestion was complete. Anaerobic digestion is a two phase process. During the first phase, called the acid forming phase, microorganisms create volatile fatty acids (VFA) and the pH falls rapidly to 6 or less. During the second phase the methanogens increase in population and consume the VFAs causing the pH to rise. Digestion was complete once the pH hovered around 7.5 for several days, and biogas was no longer produced. A graph of the variation in pH for the reactors is provided in Figure 3.
Figure 3. Variation of pH with respect to process time for three organic loading rates used. Each point is the mean of three 1.8-L batch reactor bottles.
Solids and Plant Nutrients Measured Before and After Anaerobic Digestion
Well-mixed samples of the three liquid swine manure mixtures were obtained before and after anaerobic digestion. Since nitrogen and phosphorous in swine manure exist in soluble and organic forms the reductions and transformations of soluble and organic forms of these nutrients were also observed. The samples were analyzed to determine the following using standard techniques:
The total solids (TS),
The fixed solids (FS) or ash content,
The volatile solids (VS = TS – FS)
Total Kjeldahl nitrogen (TKN = Org-N + TAN)
Total ammonical nitrogen (TAN = NH4+-N + NH3– – N),
Organic nitrogen (Org-N = TKN – TAN),
Nitrate nitrogen (NO3-N),
Mineral nitrogen (Min N = TAN + NO3-N),
Total nitrogen (TN = TKN + NO3-N),
Total phosphorus (TP),
Soluble phosphorous (Sol-P),
Total potassium (TK), and
Sulfur (S).
What did we learn?
The first important observation was related to the completeness of anaerobic digestion. The mean VS reduction ratio (g VS destroyed/g VS added) for all nine reactors was measured, and was 0.62 on the average. This and was in excellent agreement with the literature value of 0.63 for swine manure (Hill, 1991), and indicated that anaerobic digestion was complete. The rate of TS destruction was 0.45 g TS destroyed / g TS added.
The second set of observations were related to the impact of anaerobic digestion on nitrogen. The mass of total N was not changed by anaerobic digestion, but the mass of organic nitrogen was decreased by 36% as it was mineralized to TAN. The TAN was increased by a factor of 1.84, and the mineral N (TAN + NO3-N) was increased by a factor of 1.8 on the average. The initial nitrate-N concentrations were small and evidence of denitrification was observed as indicated by a reduction in nitrate-N by 59%. The impact of N transformations was to increase the fraction of total-N that was in the total ammonical form from 33% before digestion to 59% after digestion which highlights the need to store and land apply anaerobically digested manure so as to reduce ammonia volatilization.
Anaerobic digestion was also observed to have mixed results on the mass of P, K, and S. The mass of total-P was not significantly impacted by anaerobic digestion. On the average, 73% of the soluble-P was converted to organic P by microbial activity, and was believed to remain in the microbial biomass. There was no impact on TK by digestion as expected. The mass of S was reduced by 7% on the average presumably by the formation of small amounts of H2S.
Authors
John P. Chastain, Ph.D. Professor and Extension Agricultural Engineer, Clemson University, Department of Agricultural Sciences, Agricultural Mechanization and Business Program, McAdams Hall, Clemson, South Carolina 29634 USA. jchstn@clemson.edu 1-864-656-4089
Bryan Smith, BSAE, MSCE, Area Extension Agent – Agricultural Engineer, Clemson Extension Service, 219 West Laurens Street, Laurens, South Carolina 29360 USA.
References
Chastain, J.P. and W.B. Smith. (2015). Determination of the Anaerobic Volatile Solids Reduction Ratio of Animal Manure Using a Bench Scale Batch Reactor. Presented at the 2015 ASABE Annual International Meeting. Paper No. 152189216. ASABE, 2950 Niles Rd., St. Joseph, MI 49085-9659
Hill, D.T. (1991). Steady-State Mesophilic Design Equations for Methane Production from Livestock Wastes. TRANSACTIONS of the ASAE, 34(5):2157-2163.
Acknowledgements
This study was supported by the Clemson Extension Confined Animal Manure Managers Program and by a grant from the South Carolina Energy Office.
The authors are solely responsible for the content of these proceedings. The technical information does not necessarily reflect the official position of the sponsoring agencies or institutions represented by planning committee members, and inclusion and distribution herein does not constitute an endorsement of views expressed by the same. Printed materials included herein are not refereed publications. Citations should appear as follows. EXAMPLE: Authors. 2019. Title of presentation. Waste to Worth. Minneapolis, MN. April 22-26, 2019. URL of this page. Accessed on: today’s date.
Anaerobic digestion (AD) is a growing technology that uses a series of microbial activities to breakdown organic material such as food waste and manure, to produce biogas for renewable energy, digestate for nutrient recycling as fertilizer, and large reductions in greenhouse gas (GHG) emissions and odors. Currently there are millions of AD systems in China and India, with a vast majority of these systems operating on a small-scale basis, while European nations such as Germany and Italy, have thousands of agricultural- based AD systems, that are large scale and more technologically advanced. Europe with over 17,000 biogas plants has steady increases in AD adoption each year, as more countries are setting sustainability goals that include increasing renewable energy use and reducing GHG emissions. The US however, has less than 300 agricultural-based AD systems and 1500 AD systems at wastewater treatment facilities. An in depth analysis was performed of US policies related to AD adoption and how these policies compare to policies in other countries with higher AD adoption rates. A survey was developed for farmers, policy makers, and extension associates to understand policy effects on AD adoption rates and identify challenges to increasing AD adoption rates in the US. The survey data, along with the AD policy analysis, was used to compare and contrast policies, programs and overall legislative climate between countries and understand the timeline in which policies were administered. While policy is the product of a multitude of variables, including general perceptions, institutional involvement, legal framework, and societal /economic benefits, the survey and subsequent analyses seek to understand how these variables interact. The results of the survey and policy analysis will be presented to detail the general perceptions around AD policies, challenges with AD adoption, operation, and maintenance, and overall perceptions of the AD field in the US.
Authors
Carlton Poindexter, University of Maryland-College Park, cpoindex@umd.edu
Lansing, Stephanie (University of Maryland-College Park)
The authors are solely responsible for the content of these proceedings. The technical information does not necessarily reflect the official position of the sponsoring agencies or institutions represented by planning committee members, and inclusion and distribution herein does not constitute an endorsement of views expressed by the same. Printed materials included herein are not refereed publications. Citations should appear as follows. EXAMPLE: Authors. 2019. Title of presentation. Waste to Worth. Minneapolis, MN. April 22-26, 2019. URL of this page. Accessed on: today’s date.
To better understand the state of the science and to lessen the present risk of winter manure application, a literature review was conducted that examined a wealth of studies dating back to 1945. Interest in winter manure application has increased, in part, due to the high-profile nutrient impacts to the Great Lakes and the several resulting new policies that have been implemented within the surrounding states. Based on this literature review, research needs and future directions were identified.
What did we do?
A comprehensive literature review was conducted that included scientific, technology transfer, and regulatory documents. Contaminants of concern, emerging pollutants, case studies, existing best management practices, state level policy, and key data gaps were identified.
What we have learned?
The US Environmental Protection Agency (EPA) and the Natural Resource Conservation Service (NRCS) discourages the application of manure in winter because of the elevated risk of nutrient loss to the environment as demonstrated by several field, laboratory, and modeling studies (Srinivasan et al., 2006). The emergence of environmental issues downstream of livestock operations such as algae blooms and fish kills has led some States to ban winter manure application all together, although some states still allow emergency applications and exempt smaller farms from the regulations. Additionally, the loss of nutrients during spring thaws means a loss of soil productivity for farmers and added expense to purchase soil amendments. There are several parameters that ultimately determine the impact winter manure spreading will have on the environment and the nutrient content that remains in the soil after application. Included, but not limited to, are slope, soil type, depth of freeze, rate of thaw, depth of snow, presence of cover crops, tilling practices, manure moisture content, and timing of application. Several are interdependent, often resulting in difficulty isolating the relative effects of any particular parameter compared to another and, in some cases, contradictory research results are found. However, several general findings may still be derived, as discussed below.
Nutrients
Runoff from winter-applied manure can be an important source of annual nutrient loadings to water bodies, with nitrogen and phosphorous being the most often reported. In a 1985 study, Moore and Madison (1985) estimated that 25% of annual phosphorus load to a Wisconsin lake was directly attributable to winter spreading of animal wastes. Brown et al. (1989) investigated the Cannonsville Reservoir in New York and determined that snowmelt runoff from winter manured cropland contributed more phosphorus to the reservoir than runoff from barnyards. Clausen and Meals (1989) estimated that 40% of Vermont’s streams and lakes experienced significant water quality impairments from the addition of just two winter-spread fields in their watersheds. Plot studies of winter-applied manure found 23.5 to 1,086 mg/L of total Kjeldahl nitrogen (TKN) and 1.6 to 15.4 mg/L of phosphorus in runoff (Lorimor and Melvin, 1996; Thompson et al., 1979). In two Vermont field studies, Clausen (1990; 1991) reported 165 to 224% increases in total phosphorus concentration, 246 to 1,480% increases in soluble phosphorus, 114% increases in TKN, and up to a 576% increase in NH3-N following winter application of dairy manure. Mass losses of nutrients are highly variable across studies. Several studies have noted elevated, though moderate, mass losses of nitrogen ranging from 10-22% of applied nitrogen (Converse et al., 1976; Hensler et al., 1970; Klausner et al., 1976; Lorimor and Melvin, 1996; Midgley and Dunklee, 1945; Phillips et al., 1981). However, Owens et al. (2011) reported total nitrogen losses of 35-94%, by mass. These numbers are highly variable due the extreme variance in weather conditions, with flash events contributing more nutrient loss than slower melt events. Authors noted that it is possible for nearly all loss to occur in a single storm event (Klausner et al., 1976; Owens et al., 2011).
Steenhuis et al., (1979) reported decreases in ammonia volatilization rates for winter spread manure relative to spring due to lower temperatures. Lauer et al. (1976) showed that manure covered by snow had no signs of ammonia volatilization. These results suggested that limiting ammonia volatilization may be critical to nutrient retention in soil. However, Williams et al. (2010) showed that manure applied under snow did not truly maintain this ammonia but lost it through runoff. No case studies have quantified the reduction of other odor causing compounds such as di-hydrogen sulfide in winter applied manure relative to other seasonal applications.
Losses are contingent upon fields exhibiting certain risk factors (Klausner et al., 1976; Young and Holt, 1977; Young and Mutchler, 1976). Important are variations in local weather conditions, depth and type of soil freeze, the position of manure relative to the snowpack, and the timing of application relative to snow melt. Because of the large number of unconstrained variables in the natural environment, there continue to be disagreements on best management practices to limit nutrient movement. Additionally, the form of nutrient is critical. All of these factors impact the mechanisms of nutrient loss: plant uptake, sorption, polymerization, microbial degradation, volatilization, advective movement, and dispersive transport. Consequently, the fate of particulate forms may be very different than soluble, depending on the site and management-specific conditions.
As such, the industry will benefit from continued experiment and field research in an effort to account for very specific, definable variables and nutrient form. Further, because of the extensive list of relevant variables, the development of precise and accurate mathematical models is essential as experimentally modeling the infinite number of site and management-specific conditions is impossible.
Pathogens
Several varieties of pathogens are common in livestock excrement, though not all pose human health risks. Pathogens of concern include the following (USEPA 2004; Rogers and Haines 2005; Sobsey et al. 2006; Pappas et al. 2008; Bowman 2009).
Bacteria: Escherichia coli (E. coli) O157:H7 and other shiga-toxin producing strains, Salmonella spp., Campylobacter jejuni, Yersinia enterocolitica, Shigella sp., Listeria monocytogenes, Leptospira spp., Aeromonas hydrophila, Clostridium perfringens, Bacillus anthraxis (in endemic area) in mortality carcasses.
Parasites: Giardia lamblia, Cryptosporidium parvum, Balantidium coli, Toxoplasma gondii, Ascaris suum and lumbricoides, Trichuris trichuria.
Viruses: Rotavirus, hepatitis E virus, influenza A (avian influenza virus), enteroviruses, adenoviruses, caliciviruses (e.g., norovirus).
As with nutrients, application of animal manure to impervious surfaces such as frozen ground can increase the risk of pathogen loss through runoff events relative to application in other seasons (Reddy, et al., 1981). Cool temperatures have been shown to improve the survival of fecal bacteria (Reddy et al., 1981; Kibbey, et al., 1978). However, field studies found that freezing conditions can be lethal to fecal bacteria (Kibbey, et al., 1978). While these reports hint at fecal bacteria being able to survive cool but not freezing conditions, Kudva, et al. (1998) reported E. coli surviving more than 100 days in manure frozen at minus 20°C. Conversely, freezing and thawing of a soil manure mixture was found to reduce E. coli levels by about 90% (Bicudo, 2003).
More research on this topic is needed to identify conflicting results. Of particular interest is the impact of warming soil temperatures. Slight variations can result in substantial microbial ecological changes. Further, it is well understood that the use of fecal coliform as a pathogen indicator is flawed. New microbial genetics techniques enable the identification of pathogens of greatest risk. Research should monitor for these specific, likely pathogens and their fate during freeze-thaw cycles.
Emerging Pollutants
Land application of both solid and slurry excrement has been cited as a vector for introduction of antimicrobials into the environment (Boxall 2008; Klein et al. 2008). In the early 2000s, it was estimated that approximately 60% to 80% of livestock and poultry routinely received antimicrobials through feed or water, injections, or external application (NRC 1999; Carmosini and Lee 2008). Though new best management practices involving non-therapeutic use of antibiotics in livestock are likely to decrease these percentages, estimated changes are not available. Livestock animals are estimated to discharge 70-90% of antibiotics administered through excrement (Massé et al., 2014). Approximately 55% of antimicrobial compounds administered to livestock and poultry are also used to treat human infections (Benbrook 2001; Kumar et al. 2005; Lee et al. 2007). The utilization of such overlapping antibiotics has been cited as a potential cause of antimicrobial resistance (Sapkota et al. 2007), a grave concern in modern medicine (Levy and Marshall 2004; Sapkota et al. 2007).
Antimicrobials are hydrophilic and do not readily break down in the environment and are, consequently, at high risk of introduction into water bodies through runoff events (Chee-Sanford et al. 2009; Zounková et al. 2011). Critically, these compounds show high adsorptive tendencies in soils and clays (Chee-Sanford et al. 2009), thus providing a potential for interception by soil.
Because antibiotics are highly hydrophilic, movement with melt water results, similar to soluble nutrients. Although this mechanism seems clear, movement during winter application is poorly understood. The mechanisms that determine their fate are the same as those listed for nutrients. However, this fate is poorly understood, especially regarding the amount that will reach the field and streams when comparing different seasonal applications. Further, some studies suggest prolonged storage in aerobic manure environments helps facilitate breakdown particularly at higher temperatures (Kumar et al. 2005; Lee et al. 2007; Boxall et al. 2008). However, the question remains whether these effects are present in winter storage.
Fate studies under diverse farm field conditions are essential. Further, the original compound may be broken down into metabolites, some of which may be even more dangerous. All original and breakdown products should be reviewed.
Benefits of Winter Manure Application
The soil health benefits of winter manure application appear to be limited. However, the literature suggests that soil compaction and nitrogen volatilization can be reduced when applying to frozen soil, but at the potential expense of nutrient runoff. There are also many benefits to agriculturalists, as Fleming and Fraser (2000) noted:
Reducing size and number of manure storage structures.
Spreading the manure when logistics suite the farmer.
Reducing soil compaction by avoiding equipment use during compressible soil conditions.
Management Practices
There is little standardization in regard to winter manure application and most states cite the NRCS conservation practice standard 590 for nutrient management (NRCS, 2013). In regard to winter manure application, this standard states the following. “Nutrients must not be surface-applied if nutrient losses offsite are likely. This precludes spreading on: frozen and/or snow-covered soils, and when the top two inches of soil are saturated from rainfall or snow melt. Exceptions for the above criteria can be made for surface-applied manure when specified conditions are met and adequate conservation measures are installed to prevent the offsite delivery of nutrients” (NRCS, 2013). As a continuation of standard 590, the NRCS states that at a minimum the following factors should be considered before winter manure application (NRCS, 2013):
Field slope
Organic residue and living covers
Amount and form of nutrients to be applied
Setback distances to protect local water quality
Application timing
The ambiguity in standard practices for winter manure application has led to several different State policies. States with winter manure application guidelines include Ohio, Pennsylvania, Michigan, and Illinois. States that have some form of bans include Vermont, Iowa, Maryland, Indiana, Minnesota, and Wisconsin. States not listed have policies that are identical to the NRCS standard 590.
Future Plans
Based on this literature review, needed research has been identified:
Review the incidences of emergency spreading on frozen ground versus incorporation during cold weather. Understanding the frequency and timing of emergency spread events is critical to crafting policy and best management practices.
Evaluate compliance with new rules and if intended impacts are realized, including comparing watershed level of target pollutants across state lines and time lines to view the impacts of this policy change.
Determine if application in early spring, when soil is saturated and precipitation events are frequent, is more desirable than in winter application before a deep freeze allows for incorporation. Related is the impact of soil moisture content on the fate of target pollutants during thaw events.
Determine the economic impact on producers and the potential loss of small to medium sized farms. One of the most often cited criticisms of unconditional winter manure application bans is that it can disproportionately disadvantage smaller producers. In a Michigan survey of small producers, 27% of non-CAFO dairy farmers suggested that they would need to suspend operations if such a ban were instituted (Miller et al., 2017). This same survey found that a total ban on winter application in Michigan would collectively cost small farms in that state an estimated $30 million dollars (Miller et al., 2017). An important task is to survey, with time, states that have banned winter manure application to determine if significant shift with regard to average producer size occurred. If so, it is important to consider the resulting economics of the environmental benefits and if national biosecurity decreased with a reduction in producers.
Verify the effectiveness of risk indices such as the Manure Application Risk Index (MARI), Wisconsin’s Online Manure Advisory System, and other individual states’ P-indices. Many of these indices were developed based on recommendations from research and the practical experience of experts, but literature verifying this is scarce.
Determine the impact of climate change on winter manure application policies. Climate change effects the duration and intensity of winter temperatures and the frequency and intensity of precipitation events. Such conditions may require more adaptable metrics such as frost depth, depth of snow, ability to incorporate, and forecasted thaw events.
Authors
Steven I. Safferman1, Jason S. Smith2, and Rachelle L. Crow3
1Associate Professor; Michigan State University, Biosystems and Agricultural Engineering; Corresponding Author: SteveS@msu.edu
2Teaching Specialist, Michigan State University, Engineering CoRe
3Undergraduate Research Assistant, Michigan State University, Biosystems and Agricultural Engineering
Additional information
Benbrook, C.M. 2001. Quantity of antimicrobials used in food animals in the United States. American Society for Microbiology 101st Annual Meeting. May 20-24, 2001. Orlando, FL.
Bicudo, J. R., Goyal, S.M. 2003. Pathogens and manure management systems: a review. Environmental technology 24.1 (2003): 115-130.
Bowman, J. 2009. Manure pathogens: manure management, regulations, and water quality protection. p. 562.Water Environmental Federation, McGraw-Hill, New York.
Boxall, A. 2008. Fate and transport of veterinary medicines in the soil environment. p 123-137. In D.S. Aga (ed.) Fate and transport of pharmaceuticals in the environment and water treatment systems. 1st ed. CRC Press, Boca Raton, FL.
Brown, M.P., Longabucco, P., Rafferty, M.R., Robillard, P.D., Walter, M.F., Haith, D.A. 1989. Effects of animal waste control practices on nonpoint-source phosphorus loading in the West Branch of the Delaware River watershed. J. Soil Water Conserv. 44, 67–70.
Carmosini, N., Lee, L.S. 2008. Sorption and Degradation of selected pharmaceuticals in soil and manure. p 139-165. In D.S. Aga (ed.) Fate and transport of pharmaceuticals in the environment and water treatment systems. 1st ed. CRC Press, Boca Raton, FL.
Chee-Sanford, J.C., Mackie, R.I., Koike, S., Krapac, I.G., Lin, Y., Yannarell, A.C., Maxwell, S., Aminov. R.I. 2009. Fate and transport of antibiotic residues and antibiotic resistance genes following land application of manure waste. Journal of Environmental Quality. 38(3):1086-1108.
Clausen, J.C. 1990. Winter and Fall application of manure to corn land. Pages 179 – 180 invMeals, D.W. 1990. LaPlatte River Watershed Water Quality Monitoring and AnalysisProgram: Comprehensive Final Report. Program Report No. 12. Vermont WatervResource Research Center, University of Vermont, Burlington.
Clausen, J.C. 1991. Best manure management effectiveness. Pages 193 – 197 in Vermont RCWP Coordinating Committee. 1991. St. Albans Bay Rural Clean Water Program, Final Report. Vermont Water Resources Research Center, University of Vermont, Burlington
Clausen, J.C., Meals, D.W. 1989. Water quality achievable with agricultural best management practices. J. Soil Water Conserv. 44, 593–596.
Converse, J.C., Bubenzer, G.D., Paulson, W.H. 1976. Nutrient losses in surface runoff from winter spread manure. Trans. ASAE 19, 517–519.
Fleming, R., Fraser, H. 2000. Impacts of winter spreading of manure on water quality: Literature review. Ridgetown, Ontario, Canada Ridget. Coll. Univ. Guelph.
Hensler, R.F., Olsen, R.J., Witzel, S.A., Attoe, O.J., Paulson, W.H., Johannes, R.F. 1970. Effect of method of manure handling on crop yields, nutrient recovery and runoff losses. Trans. ASAE 13, 726–731.
Kibbey, H.J., Hagedorn, C., and McCoy, E.L. 1978. Use of fecal streptococci as indicators of pollution in soil. Applied Environmental Microbiology. 35:711-717.
Klausner, S.D., Zwerman, P.J., Ellis, D.F. 1976. Nitrogen and phosphorus losses from winter disposal of dairy manure. J. Environ. Qual. 5, 47–49.
Klein C., O’Connor, S., Locke, J., Aga, D. 2008. Sample preparation and analysis of solid-bound pharmaceuticals. p. 81-100. In D.S. Aga (ed.) Fate and transport of pharmaceuticals in the environment and water treatment systems. 1st ed. CRC Press, Boca Raton, FL.
Kudva, I. T., Blanch, K., Hovde, C. J. 1998. Analysis of Escherichia coli O157: H7 survival in bovine or bovine manure and manure slurry. Applied and environmental microbiology, 64(9), 3166-3174.
Kumar, K., Gupta, S.C., Chander, Y., Singh, A.K. 2005. Antibiotic use in agriculture and its impact on the terrestrial environment. Advances in Agronomy. 87:1-54.
Lauer, D.A., Bouldin, D.R., Klausner, S.D. 1976. Ammonia volatilization from dairy manure spread on the soil surface. J. Environ. Qual. 5, 134–141.
Lee, L.S., Carmosini, N., Sassman, S.S., Dion, H.M., Sepúlveda, M.S. 2007. Agricultural contributions of antimicrobials and hormones on soil and water quality. Advances in Argronomy.93:1-68.
Levy, S.B., Marshall, B. 2004. Antibacterial resistance worldwide: causes, challenges and responses. Nature Medicine Supplement. 10(12):S122-S129.
Lorimor, J.C., Melvin, J.C. 1996. Nitrogen losses in surface runoff from winter applied manure. Final Report. Univ. Iowa, Ames, Iowa.
Massé, I.D., Saady, M.N., Gilbert, Y. 2014. Potential of Biological Processes to Eliminate Antibiotics in Livestock Manure: An Overview. Anim. . doi:10.3390/ani4020146
Midgley, A.R., Dunklee, D.E. 1945. Fertility runoff losses from manure spread during the winter. Agricultural Experiment Station; Burlington.
Miller, S.R., Mann, J.T., Leschewski, A., Rozeboom, D., Safferman, S., Smith, J. 2017. Survey of Small Michigan Livestock Winter Manure Handling and Economic Assessment of Policy Change, in: 2017 ASABE Annual International Meeting. American Society of Agricultural and Biological Engineers, p. 1.
Moore, I.C., Madison, F.W. 1985. Description and application of an animal waste phosphorus loading model. J. Environ. Qual. 14, 364–369.
NRC. 1999. The use of drugs in food animals: benefits and risks. Food and Nutrition Board, Institute of Medicine. National Academy Press, Washington, DC.
NRCS. 2013. Conservation Practice Standard 590: Nutrient Management [WWW Document]. URL https://www.nrcs.usda.gov/Internet/FSE_DOCUMENTS/stelprdb1192371.pdf (accessed 1.8.17).
Owens, L.B., Bonta, J. V, Shipitalo, M.J., Rogers, S. 2011. Effects of winter manure application in Ohio on the quality of surface runoff. J. Environ. Qual. 40, 153–165.
Pappas, E. A., Kanwar, R. S., Baker, J. L., Lorimor, J. C., Mickelson, S. 2008. Fecal indicator bacteria in subsurface drain water following swine manure application. Transactions of the ASABE, 51(5), 1567-1573.
Phillips, P.A., Culley, J.L.B., Hore, F.R., Patni, N.K. 1981. Pollution potential and corn yields from selected rates and timing of liquid manure applications. Trans. ASAE 24, 139–144.
Reddy, K. R., Khaleel, R., Overcash, M. R. 1981. Behavior and transport of microbial pathogens and indicator organisms in soils treated with organic wastes. Journal of Environmental Quality, 10(3), 255-266.
Rogers, S., and J. Haines. 2005. Detecting and mitigating the environmental impact of fecal pathogens originating from confined animal feeding operations: review. EPA-600-R-06-021. USEPA, Office of Research and Development, National Risk Management Research Laboratory. Cincinnati, OH.
Sapkota, A.R., F.C. Curriero, K.E. Gibson, and K.J. Schwab. 2007. Antibiotic-resistant enterococci and fecal indicators in surface water and groundwater impacted by a concentrated swine feeding operation. Environmental Health Perspectives. 115(7):1040-1045.
Sobsey, M.D., Khatib, L.A., Hill, V.R., Alocilja, E., Pillai, S. 2006. Pathogens in animal wastes and the impacts of waste management practices on their survival, transport and fate. p. 609-666. In J.
Srinivasan, M.S., Bryant, R.B., Callahan, M.P., Weld, J.L. 2006. Manure management and nutrient loss under winter conditions: A literature review. J. Soil Water Conserv. 61, 200–209.
Steenhuis, T.S., Bubenzer, G.D., Converse, J.C. 1979. Ammonia volatilization of winter spread manure. Trans.of ASAE. p 152-157, 161.
Thompson, D.B., Loudon, T.L., Gerrish, J.B. 1979. Animal manure movement in winter runoff for different surface conditions, in: Best Management Practices for Agriculture and Silviculture Proceedings of the 1978 Cornell Agricultural Waste Management Conference, P 145-157, 1979. 1 Fig, 4 Tab, 16 Ref.
USEPA. 2004. Risk management evaluation for concentrated animal feeding operations. EPA-600-R-04-042.USEPA, Office of Research and Development, National Risk Management Research Laboratory, Cincinnati, OH.
Williams, M.R., Feyereisen, G.W., Beegle, D.B., Shannon, R.D., Folmar, G.J., Bryant, R.B. 2010. Manure application under winter conditions: Nutrient runoff and leaching losses, in: 2010 Pittsburgh, Pennsylvania, June 20-June 23, 2010. American Society of Agricultural and Biological Engineers, p. 1.
Young, R.A., Holt, R.F. 1977. Winter-applied manure: Effects on annual runoff, erosion, and nutrient movement. J. Soil Water Conserv.
Young, R.A., Mutchler, C.K. 1976. Pollution potential of manure spread on frozen ground. J. Environ. Qual. 5, 174–179.
Zounková, R., Klimešová, Z., Nepejchalová, L., Hilscherová, K., Bláha, L. 2011. Complex evaluation of ecotoxicity and genotoxicity of antimicrobials oxytetracycline and flumequine used in aquaculture. Environmental Toxicology and Chemistry, 30(5), 1184-1189.
Acknowledgements
This project was funded by the North Central Regional Water Network Manure and Soil Heath Working Group and the Soil Health Institute.
The authors are solely responsible for the content of these proceedings. The technical information does not necessarily reflect the official position of the sponsoring agencies or institutions represented by planning committee members, and inclusion and distribution herein does not constitute an endorsement of views expressed by the same. Printed materials included herein are not refereed publications. Citations should appear as follows. EXAMPLE: Authors. 2019. Title of presentation. Waste to Worth. Minneapolis, MN. April 22-26, 2019. URL of this page. Accessed on: today’s date.
The Runoff Risk project was started in Wisconsin in 2011, with the realization at that time, there was no real-time runoff risk guidance available for manure applicators. The project has grown, with four states (Michigan, Minnesota, Ohio and Wisconsin) now operating real-time runoff risk forecast websites.
Figure 1. Minnesota Runoff Risk Advisory Forecast from July 1, 2018.
The Minnesota Runoff Risk Advisory Forecast (RRAF) system is a tool developed by the Minnesota Department of Agriculture (MDA) and the National Weather Service (NWS). It is designed to help farmers and commercial applicators determine the best time to apply manure to reduce the runoff risk of valuable nutrients and protect water resources. It is part of a regional risk advisory forecast project that utilizes existing NWS weather and watershed models in a water quality application. Figure 1 shows a screenshot of the website from July 1, 2018, indicating the runoff risk forecast in the central part of the state.
Runoff Risk Analysis
The NWS models continuously simulate soil moisture and temperature conditions as well as incorporating future precipitation and temperature forecasts and current and future snowpack. An algorithm that looks at chosen model state values is evaluated for a variety of risk conditions, such as runoff and soil saturation. Based on over 20 years of simulations, basin specific thresholds were created. Finally, there was post–processing of that data that is run on the output to produce risk events. This information is provided daily to the project partners through data servers. The data is processed and the website is updated twice daily. The graphic displays the different risk events predicting the likelihood of today (Day 1), tomorrow (Day 2), and Day 3 or multi-day (Day 1 through Day 3 combined) runoff events. Farmers and commercial applicators use an interactive map to locate their field and find their forecasted risk. Users can also sign up for email or text messages for their county that alert them to a severe runoff risk for that day.
Figure 2. Tabular 5 day forecast from June 24, 2019 in Bandon Township, Renville County, Minnesota.
Runoff risk is grouped into four categories: No event, Low, Moderate and Severe. When the risk is Moderate or Severe, it is recommended that the applicator evaluate the situation to determine if there are other locations or later dates when the application could take place. Figure 2 shows results for a specific location in Bandon Township in Renville County, Minnesota. For the first three days, the risk of runoff at that specific location was Severe, which indicated that a producer should wait to apply.
Daily Mapping Information
Figure 3. Daily soil temperature forecast at 6 inch depth for Minnesota.
The RRAF website also provides statewide forecasted daily average two inch soil depth temperatures which can be useful at planting time, daily average six inch soil depth temperatures which are helpful when determining fall fertilizer application in appropriate areas and daily precipitation forecasts. Figure 3 shows the daily soil temperature forecast at the six inch depth for the state of Minnesota. The colored dots are real time soil temperature gauges that can be interactively clicked on to reveal current soil temperature. The color of the dot is not reflective of the temperature at the gauge. It simply notes what entity is in charge of the gauge.
Potential of RRAF
This is a relatively new application that has been implemented in Minnesota since March 2018. The potential impacts of usage on this could be quite large. Any time movement of manure to water resources can be minimized is a success for the farmer and the environment. The overall goal of the presentation is to make people aware of this tool, share information on the performance, and encourage potential users to add this tool to their “toolbox”. The main message is to check conditions, delay if necessary, and spread on the day when there is least potential impact to the environment.
Further partnerships are desired to continue to get the word out on this application. Yearly multi-state coordination meetings occur, with the next meeting coming up in Ohio in August 2019. Version 3 of the RRAF will be derived from the National Weather Service National Water Model. Development on this version will start in Spring 2019 and should take four years for it to be merged into the National Water Model system. For MDA, we continue to promote RRAF website and monitor the output, comparing it to real time data to make sure that the model is working correctly.
Heather Johnson, Hydrologist 3, Minnesota Department of Agriculture
The authors are solely responsible for the content of these proceedings. The technical information does not necessarily reflect the official position of the sponsoring agencies or institutions represented by planning committee members, and inclusion and distribution herein does not constitute an endorsement of views expressed by the same. Printed materials included herein are not refereed publications. Citations should appear as follows. EXAMPLE: Authors. 2019. Title of presentation. Waste to Worth. Minneapolis, MN. April 22-26, 2019. URL of this page. Accessed on: today’s date.
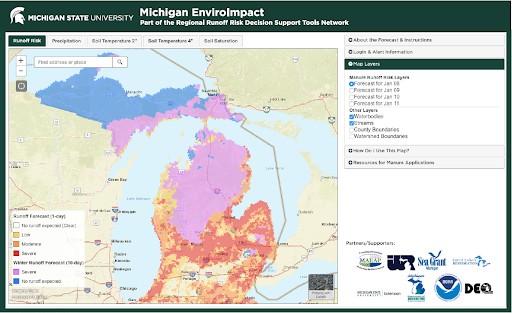
The purpose of the MI EnviroImpact Tool is to provide farmers with a daily runoff risk decision support tool that can aid in effectively planning short-term manure and nutrient application. This not only helps keep nutrients on the field and potentially saves money, but it also helps to protect our waterways in Michigan.
Figure 1. Livestock operations are a readily available source of manure nutrients. With effective nutrient application, farmers might be able to reduce the use of commercial fertilizers and save money.Figure 2. With the MI EnviroImpact tool, farmers are able to plan for effective short-term manure application.
What did we do?
Farmer interest groups were pulled together for initial piloting and testing of the MI EnviroImpact tool to hear what worked and what needed improvement. The goal was to make this a very user-friendly tool that everyone could use. Additionally, educational and outreach materials were created (factsheet, postcard, YouTube videos, and presentations) to help get the word out about this decision support tool. The ultimate goal of the MI EnviroImpact tool is for use as a decision support tool for short-term manure and nutrient application. The tool derives the runoff risk forecast from real-time precipitation and temperature forecasts. This information is then combined with snow melt, soil moisture and temperature, and other landscape characteristics to forecast times when the risk of runoff will be higher. The MI EnviroImpact tool is applicable in all seasons and has a winter mode for times when the average daily snow depth is greater than 1 inch or the 3-day average soil temperature (top 2 inches) is below freezing.
Figure 3. The MI EnviroImpact tool displaying both winter and non-winter modes of daily runoff risk.
What did we learn?
Through our work with the MI EnviroImpact Tool and those that helped to develop this tool, we were able to spread awareness of this user-friendly tool, so that more farmers would be likely to use it to help in nutrient application planning. Furthermore, those outside of the farming community have been very encouraged to see that agriculture is continuing to take steps in being environmentally friendly. Additionally, others have viewed this tool as a resource outside of farmers, showing that the MI EnviroImpact Tool has broader implications than just agriculture.
Future Plans
Future plans include continuing education about the MI EnviroImpact Tool as well as continued distribution of educational materials to help spread awareness of the tool itself.
Additional Information
Those who would like to learn more about the MI EnviroImpact Tool can visit the following links:
This project was prepared by MSU under award NA14OAR4170070 from the National Oceanic and Atmospheric Administration, U.S. Department of Commerce through the Regents of the University of Michigan. The statements, findings, conclusions, and recommendations are those of the author(s) and do not necessarily reflect the views of the National Oceanic and Atmospheric Administration, the Department of Commerce, or the Regents of the University of Michigan.
MSU is an affirmative-action, equal-opportunity employer, committed to achieving excellence through a diverse workforce and inclusive culture that encourages all people to reach their full potential. Michigan State University Extension programs and materials are open to all without regard to race, color, national origin, gender, gender identity, religion, age, height, weight, disability, political beliefs, sexual orientation, marital status, family status or veteran status. Issued in furtherance of MSU Extension work, acts of May 8 and June 30, 1914, in cooperation with the U.S. Department of Agriculture. Jeff Dwyer, Director, MSU Extension, East Lansing, MI 48824. This information is for educational purposes only. Reference to commercial products or trade names does not imply endorsement by MSU Extension or bias against those not mentioned.
Figure 4. Partners and funding sources involved in supporting, developing, and implementing the MI EnviroImpact tool.
Project Collaborators:
Heather A. Triezenberg, Ph.D.
Extension Specialist and Program Leader, Michigan Sea Grant
Michigan State University Extension
Community, Food and Environment Institute
Fisheries and Wildlife Department Meaghan Gass
Sea Grant Extension Educator
Michigan State University Extension
Jason Piwarski
GIS Specialist
Michigan State University
Institute of Water Research
Dustin Goering
Senior Hydrologist
North Central River Forecast Center
NOAA National Weather Service
Cindy Hudson
Communications Manager, Michigan Sea Grant
Community, Food & Environment Institute
Michigan State University Extension
Jeremiah Asher
Assistant Director
Institute of Water Research
Michigan State University
Kraig Ehm
Multimedia Producer
ANR Communications and Marketing
College of Agriculture and Natural Resources
Michigan State University
Luke E. Reese
PhD, Associate Professor
Biosystems and Agricultural Engineering
Michigan State University
Marilyn L. Thelen
Associate Director, Agriculture and Agribusiness Institute
Michigan State University Extension
Todd Marsee
Senior Graphic Designer
Michigan Sea Grant
University of Michigan
Mindy Tape
Manager
ANR Communications & Marketing
Michigan State University Extension
The authors are solely responsible for the content of these proceedings. The technical information does not necessarily reflect the official position of the sponsoring agencies or institutions represented by planning committee members, and inclusion and distribution herein does not constitute an endorsement of views expressed by the same. Printed materials included herein are not refereed publications. Citations should appear as follows. EXAMPLE: Authors. 2019. Title of presentation. Waste to Worth. Minneapolis, MN. April 22-26, 2019. URL of this page. Accessed on: today’s date.
One method to reduce the impacts of excess nutrients leaving agricultural fields and degrading water quality across the Nation is to ensure nutrients are not applied right before a runoff event could occur. Generally nutrient management approaches, including the 4-Rs (“right” timing, rate, placement, and source), include some discussion about the “right time” for nutrient applications, however that information is static guidance usually centered on the timing of crop needs. What has been missing, and what will be discussed in this talk, will be the development and introduction to runoff risk decision support tools focused on providing farmers and producers real-time guidance on when to not apply nutrients in the next week to 10 days due to the risk of runoff capable of transporting those nutrients off their fields. The voluntary adoption and use of runoff risk in short-term field management decisions could provide both environmental and economic benefits.
In response to the need for real-time nutrient application guidance and a request from states in the Great Lakes region, the National Weather Service (NWS) North Central River Forecast Center (NCRFC) has helped develop these runoff risk tools in collaboration with multiple state agencies and universities and with support from the Great Lakes Restoration Initiative (GLRI). There are currently four active runoff risk tools in the Great Lakes region: Michigan, Minnesota, Ohio, and Wisconsin. It is possible to develop similar tools for Illinois, Indiana, and New York if willing state partners are identified.
What did we do?
Studies have shown that a few large runoff events per year contribute a majority of the annual load leaving fields. In addition applications generally occur during the riskiest times of year for runoff (fall through spring) when fields experience the least vegetative cover and soils are vulnerable. Knowing this information, real-time NWS weather and hydrologic models were evaluated to identify conditions that correlated with runoff observed at edge-of-field (EOF) locations. The runoff risk algorithm identifies daily runoff events and stratifies the events by magnitude respective to each grid cell’s historical behavior. The events are then classified into risk categories for the farmers and producers. In general, high risk events are larger magnitude events that don’t happen as often and also have a higher accuracy rate. On the other end, low risk events are smaller magnitude events that have a higher chance of being a false alarm yet are also less likely to be associated with significant nutrient loss.
NWS models are run twice daily and simulate soil temperature, soil moisture, runoff, and snowpack conditions continuously. The runoff risk algorithm is applied against the model output to produce runoff risk guidance which is sent to the state partners. Each state has a working group and a lead agency or organization that manages the effort to produce and maintain the runoff risk websites as well as promote the tools and educate the users on how to interpret and use the guidance.
What have we learned?
At this point there are four regional runoff risk tools available. Response has been positive from both state agencies and when farming groups are asked about the runoff risk concept during post-presentation surveys and small focus groups. There is a strong desire from the farming community to make the best decision during stressful times of the year when farming schedules and the weather are often in conflict.
At this point, it is universally accepted among the runoff risk collaborators that there is a need to provide free, easily obtainable forecast guidance to the farming community so they can make the best nutrient application decisions for their operations and the environment.
Runoff risk tools are strictly for decision support and not meant to be a regulatory tool in nature. This is due to the limitations in hydrologic models, weather forecasting, spatial scale issues, and that the tools have no way of incorporating farmer specific practices into the risk calculations. Although model improvements will occur in the future, ensuring users understand the limitations but also the benefits they can provide are important components in the States’ outreach and education functions.
Future Plans
Based on feedback from the states employing runoff tools, there is a second round of enhancement planned for the runoff risk algorithm in the summer of 2019. Other improvements from the states’ perspective deal with updating webpages and building on and enhancing push notification capabilities such as text message and email alerts.
The next major step forward begins in spring 2019 with the start of version 3 runoff risk. This 2-year development will transition runoff risk guidance from the current model over to the new NWS National Water Model (NWM). The NWM framework will allow finer resolution guidance (1km or smaller) for numerous models runs per day all with full operational support. Moving to the NWM also allows continuous improvement and future collaboration opportunities with universities to improve the underlying WRF-Hydro model as well as runoff risk and other derived decision support guidance.
Authors
Dustin Goering, Senior Hydrologist, North Central River Forecast Center, National Weather Service Andrea Thorstensen, Hydrologist, North Central River Forecast Center, National Weather Service
There are many individuals across a wide spectrum of agencies, industry, and universities that have been instrumental in the development of runoff risk to this point.
Support for the development of runoff risk across the Great Lakes and the upcoming version 3 runoff risk from the National Water Model has been provided by multi-year grants from the Great Lakes Restoration Initiative.
The authors are solely responsible for the content of these proceedings. The technical information does not necessarily reflect the official position of the sponsoring agencies or institutions represented by planning committee members, and inclusion and distribution herein does not constitute an endorsement of views expressed by the same. Printed materials included herein are not refereed publications. Citations should appear as follows. EXAMPLE: Authors. 2019. Title of presentation. Waste to Worth. Minneapolis, MN. April 22-26, 2019. URL of this page. Accessed on: today’s date.
Manage Cookie Consent
To provide the best experiences, we use technologies like cookies to store and/or access device information. Consenting to these technologies will allow us to process data such as browsing behavior or unique IDs on this site. Not consenting or withdrawing consent, may adversely affect certain features and functions.
Functional
Always active
The technical storage or access is strictly necessary for the legitimate purpose of enabling the use of a specific service explicitly requested by the subscriber or user, or for the sole purpose of carrying out the transmission of a communication over an electronic communications network.
Preferences
The technical storage or access is necessary for the legitimate purpose of storing preferences that are not requested by the subscriber or user.
Statistics
The technical storage or access that is used exclusively for statistical purposes.The technical storage or access that is used exclusively for anonymous statistical purposes. Without a subpoena, voluntary compliance on the part of your Internet Service Provider, or additional records from a third party, information stored or retrieved for this purpose alone cannot usually be used to identify you.
Marketing
The technical storage or access is required to create user profiles to send advertising, or to track the user on a website or across several websites for similar marketing purposes.