Ammonia Emissions and Emission Factors: A Summary of Investigations at Beef Cattle Feedyards on the Southern High Plains

Waste to Worth: Spreading science and solutions logoWaste to Worth home | More proceedings….

Why Study Ammonia Emitted from Feedlots?

Ammonia volatilization is a major component of the nitrogen balance of a feedyard, and the effects of ammonia loss range from the economic (loss of manure fertilizer value) to the environmental (air quality degradation, overfertilization of ecosystems). Although not yet regulated, ammonia emissions from cattle are required to be reported under the Emergency Planning and Community Right to Know Act. Emission factors are used to estimate ammonia emissions for purposes of reporting and national inventories, but current emission factors are based on limited data. Our objective was to definitively quantify ammonia emissions and emission factors from commercial feedyards on the southern High Plains of Texas.

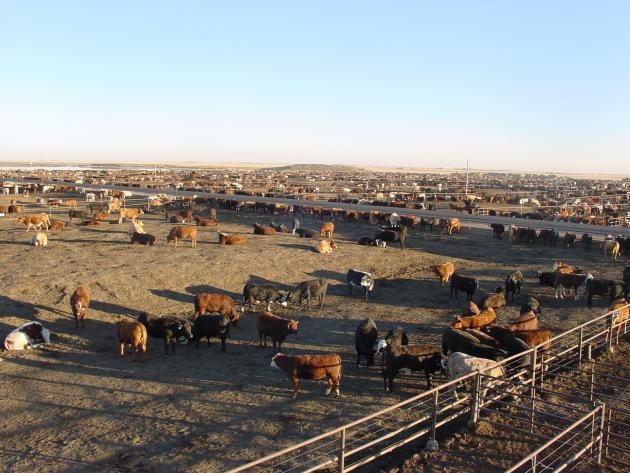
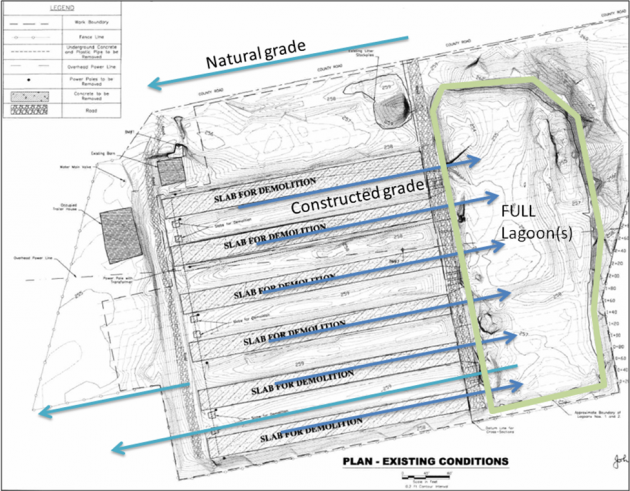
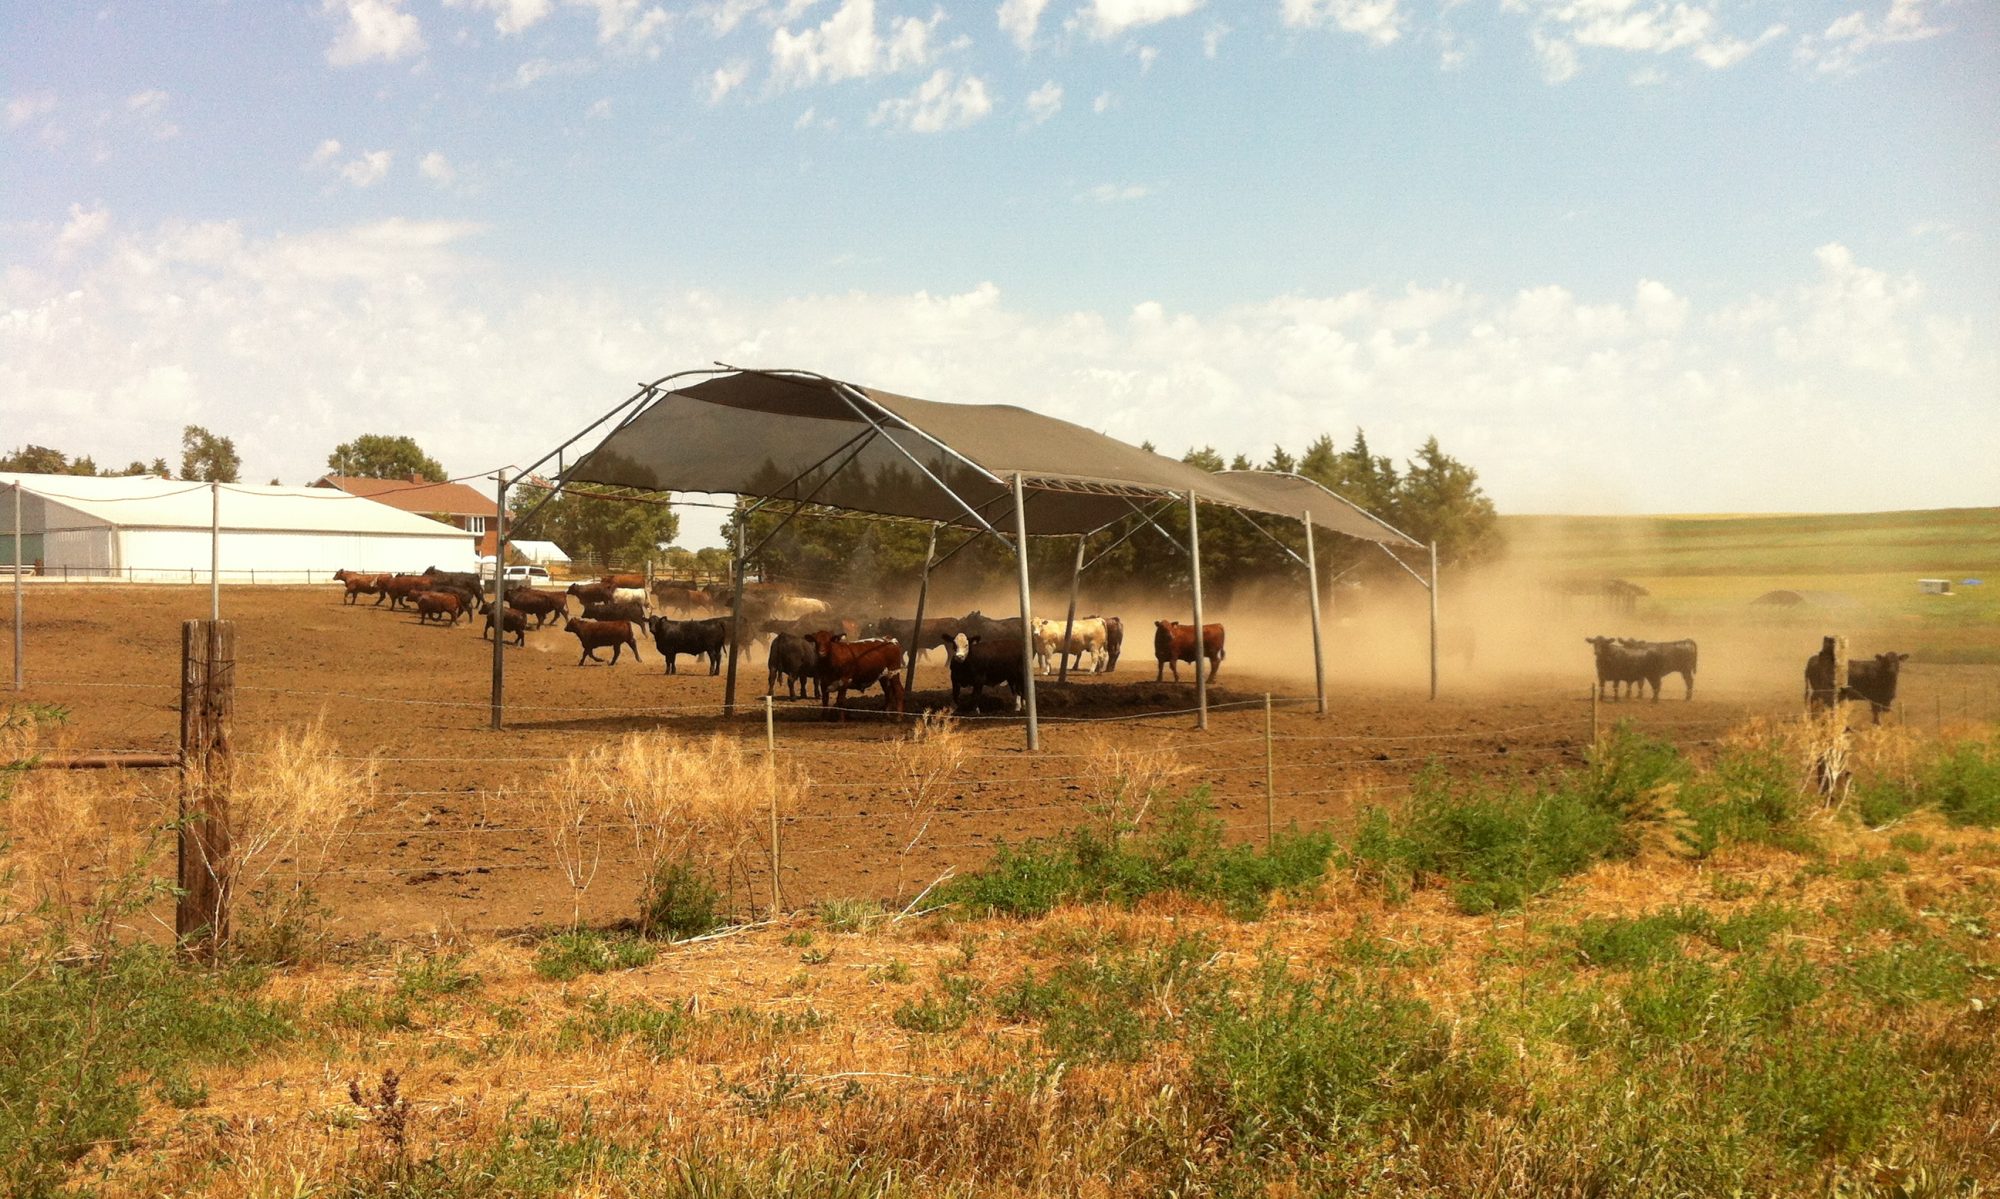
A typical feedyard on the High Plains of Texas. In the foreground, cattle in corrals with a stocking density of about 150 sq. ft./animal. In the background on the left, the runoff water retention pond, and center, a mound of stockpiled manure.

What Did We Do?

Ammonia emissions were quantified at three commercial feedyards in the Texas Panhandle from 2002 to 2008 using micrometeorological methods. Seasonal, intensive measurement campaigns were conducted from 2002 to 2005 at one feedyard, and ammonia emissions were near-continously monitored from 2007-2008 at two more feedyards. Meteorological and cattle management data were also collected.

What Have We Learned?

Ammonia emissions followed a distinct annual pattern. Emissions during summer were about twice those during winter, while spring and autumn emissions were intermediate. Annualized ammonia emissions ranged from 0.20 to 0.37 lb NH3/animal/day, and averaged 0.26 lb NH3/animal/day over all studies. Ammonia loss as a fraction of nitrogen fed to cattle averaged 41% during winter and 69% during summer; on an annual basis, 54% of fed nitrogen was lost as ammonia. Greatest emissions were observed when crude protein in cattle rations exceeded the nutrient requirements of beef cattle. Mean monthly ammonia emissions were strongly correlated with mean monthly temperature, and the relationship can be used to predict ammonia emissions from southern High Plains feedyards. Cattle feeders that meet recommended crude protein in rations can expect to lose half of fed N as ammonia. We recommend an annual emission factor of 88 lb/head for beef cattle feedyards based on one-time capacity, or 39 lb/head fed, based on a 150-d feeding period.

The annual pattern of ammonia emission rates (ER) followed seasonal temperatures, but also was sensitive to dietary crude protein (CP). Adding distillers grains to rations from March, 2008 to October, 2008 increased crude protein at Feedyard A to as high as 19%. Ammonia emissions greatly increased compared with the previous year and compared with Feedyard E.

Future Plans

Next steps involve using the extensive database from this research to adapt and refine process-based models of ammonia emissions. These models, based on the actual physical and chemical processes that control ammonia loss, will be more generally applicable than emission factors to a wider range of feedyards.

On an annual basis, ammonia emission averaged 0.26 lb per animal per day across the three feedyards and six years of study. Increased ammonia emission at Feedyard A in 2008 was due to high dietary crude protein when distillers grains were added to rations. Using these data and other estimates of ammonia loss from retention ponds and stockpiles, we recommend, for beef cattle fed a diet that meets protein requirements, an annual emission factor of 88 lb/head based on one-time capacity, or 39 lb/head fed, based on a 150-d feeding period.

Authors

Richard W. Todd, Research Soil Scientist, USDA-ARS Conservation and Production Research Laboratory, Bushland, Texas, richard.todd@ars.usda.gov

Richard W. Todd, Research Soil Scientist; N. Andy Cole, Research Leader and Research Animal Scientist (Nutrition); and Heidi M. Waldrip, Research Soil Scientist: USDA-ARS Conservation and Production Research Laboratory, Bushland, Texas.

Additional Information

Cole, N.A., R.N. Clark, R.W. Todd, C.R. Richardson, A. Gueye, L.W. Greene, and K. McBride. 2005. Influence of dietary crude protein concentration and source on potential ammonia emissions from beef cattle manure.  J. Anim. Sci. 83:722 731.

Cole, N.A., A.M. Mason, R.W. Todd, M. Rhoades, and D.B. Parker. 2009. Chemical composition of pen surface layers of beef cattle feedayrds. Prof. Anim. Sci. 25:541-552.

Flesch, T.K., J.D. Wilson, L.A. Harper, R.W. Todd, and N.A. Cole. 2007. Determining ammonia emissions from a cattle feedlot with an inverse dispersion technique. Agric. For. Meteorol. 144:139-155.

Hristov, A. N., M. Hanigan, A. Cole, R. Todd, T. A. McAllister, P. M. Ndegwa, A. Rotz. 2011. Ammonia emissions from dairy farms and beef feedlots: A review. Can. J. Anim. Sci. 91:1-35.

Preece, S.L., N.A. Cole, R.W. Todd, and B.W. Auvermann. 2012. Ammonia emissions from cattle-feeding operation. Texas A&M AgriLife Extension Bulletin E-632 12/12.

Rhoades, M.B., D.B. Parker, N.A. Cole, R.W. Todd, E.A. Caraway, B.W. Auvermann, D.R. Topliff, and G.L. Schuster. 2010. Continuous ammonia emission measurements from a commercial beef feedyard in Texas. Trans. ASABE 53:1823-1831.

Sakirkin, S.L., N.A. Cole, R.W. Todd, and B.W. Auvermann. 2011. Ammonia emissions from cattle-feeding operations. Part 1: issues and emissions. Texas Agricultural Experiment Station Bulletin, Air Quality Education in Animal Agriculture, Issues: Ammonia, December, 2011. p. 1-11.

Sakirkin, S., R.W. Todd, N.A. Cole, and B.W. Avermann. 2011. Ammonia emissions from cattle-feeding operations. Part 2: abatement. Texas Agricultural Experiment Station Bulletin, Air Quality Education in Animal Agriculture, Issues: Abatement, December, 2011. p. 1-11.

Todd, R.W., N.A. Cole, and R.N. Clark. 2006. Reducing crude protein in beef cattle diet reduces ammonia emissions from artificial feedyard surfaces. J. Environ. Qual. 35:404-411.

Todd, R.W., N.A. Cole, M.B. Rhoades, D.B. Parker, and K.D. Casey. 2011. Daily, monthly, seasonal and annual ammonia emissions from southern High Plains cattle feedyards. J. Environ. Qual. 40:1-6.

Todd, R.W., N.A. Cole, H.M. Waldrip, and R.M. Aiken. 2013. Arrhenius equation for modeling feedyard ammonia emissions using temperature and diet crude protein. J. Environ. Qual. 2013. (accepted for publication).

Acknowledgements

Research was supported by CSREES Grant #TS2006-06009 under the direction of Dr. John Sweeten, Resident Director, Texas A&M University AgriLife Research and Extension Center, Amarillo, TX. Larry Fulton, Research Technician, USDA-ARS-CPRL, provided invaluable technical and logistical support and expertise.

The authors are solely responsible for the content of these proceedings. The technical information does not necessarily reflect the official position of the sponsoring agencies or institutions represented by planning committee members, and inclusion and distribution herein does not constitute an endorsement of views expressed by the same. Printed materials included herein are not refereed publications. Citations should appear as follows. EXAMPLE: Authors. 2013. Title of presentation. Waste to Worth: Spreading Science and Solutions. Denver, CO. April 1-5, 2013. URL of this page. Accessed on: today’s date.

Effect of Manure Handling and Incorporation on Steroid Movement In Agricultural Fields Fertilized With Beef Cattle Manure

Waste to Worth: Spreading science and solutions logoWaste to Worth home | More proceedings….

Why Study Manure Land Application and Steroids?

Manure generated from concentrated animal feeding operations may serve as a source of steroids in surface water and adversely impact the development of aquatic ecosystems. The objectives of this research were to determine the amount of steroids and metabolites in manure from beef cattle production pens, and runoff from crop production fields.

What Did We Do?

Heifers were treated with zeranol, trenbolone acetate, and 17b-estradiol implants and fed melengestrol acetate, while a second group was not treated with growth promoters. Manure was sampled in the pens during feeding, run-off was collected during rainfall events, after feeding manure was collected, and either composted or stockpiled overwinter. In the  following summer both composted and stockpiled manure was spread on a field, with plots subjected three tillage practices. Following application, two rainfall simulation events were conducted: one day (1 DAT) and one month later (30 DAT) to determine the effects of rainfall timing, manure handling (treated compost, untreated compost, treated stockpile and untreated stockpile) and tillage (no-till, moldboard plow+disk and disk) on the runoff losses of steroids.

What Have We Learned?

Simulated rainfall apparatus.

Results from the manure composting showed reduction in steroid concentrations over stockpiling for some compounds in manure samples such as 4-androstenedione, a-zearalenol, and progesterone, though not for all steroids. Very low concentrations of steroids were found in most runoff samples, approaching or below detection limits. Considering only detection frequency, fewer runoff samples showed traces of steroids on the 1 DAT in comparison to the 30 DAT simulations.  The amount of  rainfall  before runoff was initiated was affected by tillage, and was different for the 1 DAT and 30 DAT events. A second year’s study with a smaller set of treatments, and use of a surrogate estrogen applied at known mass showed that disking significantly reduced runoff losses of the steroids. Runoff risk is affected by the storm event needed to initiate runoff, and also the time since manure application.

Soil during rain simulation and tube to take runoff to collection point.

Future Plans

From both the steroid runoff and general manure applications risk perspectives, how the soil receives rainfall changes during the first month after tillage. Therefore, this process needs to be investigated more closely and models predicting runoff have to take these changes into account.

Authors

Charles A. Shapiro, Professor, Department of Agronomy and Horticulture, University of Nebraska-Lincoln, Haskell Agricultural Laboratory, Concord, NE cshapiro@unl.edu

Sigor Biswas, Research Assistant, William L. Kranz, Associate Professor, David P. Shelton, Professor, Simon J. van Donk, Assistant Professor, Biological Systems Engineering; Daniel D. Snow, Associate Professor, Schol of Natural Resources; Shannon L. Bartelt-Hunt, Assistant Professor, Tian C. Zhang, Professor, Civil Engineering; Terry L. Mader, Professor, Animal Science, University of Nebraska-Lincoln; David D. Tarkalson, Soil Scientist, USDA-ARS, Kimberly-ID. 

Additional Information

Bartelt-Hunt, S., D. Snow, W. Kranz, T. Mader, C. Shapiro, S. van Donk, D. Shelton, D. Tarkelson, and T.C. Zhang. 2012. Effect of growth promotants on the occurrence of steroid hormones on feedlot soils and in runoff from beef cattle feeding operations. Environ. Sci. Technol. 46(3): 1352-1360.

Biswas, S., C. A. Shapiro, W. L. Kranz, T. L. Mader, D. P. Shelton, D.D. Snow, S. L. Bartell-Hunt, D. D. Tarkalson, S. J. van Donk, T. C. Zhang, S. Enslay. Current knowledge on the environmental fate, potential impact and management of growth promoting steroids used in the US beef cattle industry. J. of Soil and Water Cons. (In press, July 2013 issue).

Acknowledgements

This research was funded by US-EPA Science to Achieve Results (STAR) grant R833423.


The authors are solely responsible for the content of these proceedings. The technical information does not necessarily reflect the official position of the sponsoring agencies or institutions represented by planning committee members, and inclusion and distribution herein does not constitute an endorsement of views expressed by the same. Printed materials included herein are not refereed publications. Citations should appear as follows. EXAMPLE: Authors. 2013. Title of presentation. Waste to Worth: Spreading Science and Solutions. Denver, CO. April 1-5, 2013. URL of this page. Accessed on: today’s date.

The Arkansas Discovery Farm Program: Connecting Science to the Farm

Waste to Worth: Spreading science and solutions logoWaste to Worth home | More proceedings….

Why Create the Arkansas Discovery Farm Program?

Agriculture in Arkansas is under increasing pressure to manage nutrients and sediment in an environmentally sustainable manner.  In many sectors of the farming community, this has created severe constraints to remaining economically viable and competitive in today’s global market place.  In northwest Arkansas, home to the nation’s second largest broiler poultry production, farmers have been under intense scrutiny and litigation over the last decade, due to downstream water users (i.e., Oklahoma) questioning the role of agriculture in water quality impairment.  Also, increasing national attention is being focused on reducing nutrients to the Gulf of Mexico, which will further increase the need of agricultural producers to increase nutrient efficiency while declining groundwater levels in crop producing areas of eastern Arkansas will increase the need for greater water efficiency.  The Arkansas Discovery Farm Program was initiated in 2009 to document the effectiveness of conservation practices on “real-world” private farms across the diverse forage, livestock, and row crop agricultural setting across the State.

What Did We Do?

We are monitoring runoff quality from seven farms as we are quantify sediment and nutrient losses from all major row crop and livestock commodities including rice, soybean, corn, cotton, poultry and beef cattle.  We are currently monitoring the quality of runoff from 19 fields using automated water quality samplers that are now equipped modems that contact us via cell phone when sampling is initiated.    On our row crop fields, we have increased our efforts to monitor irrigation water use and needs.  All fields are equipped with turbine-type irrigation flow meters that utilize dataloggers to automatically records flow data.  On two farms, we split fields in half and monitored evapotranspiration with atmometers (ET gages) and compared to our computer irrigation scheduler to calibrate the ET gages as an easier field method for irrigation scheduling.

What Have We Learned?

Due to the fact that we have been monitoring runoff since mid-2011 at the longest, we have limited reliable information to present.  As our first year, 2011 produced several severe flood-stage storms and 2012 provided a record breaking drought, it is difficult to quantify impact at this point.  While the water quality monitoring is a cornerstone, empowering agricultural producers to take ownership in finding solutions to minimize environmental impact is paramount to protecting voluntary efforts for the industry.  Our major findings to date have been the willingness of Arkansas farmers in general to embrace the Program, to be environmentally accountable for their actions, and to be proactive rather than reactionary.   

Future Plans

We have plans to develop another Discovery Farm in the litigated Illinois River Watershed, Northwest Arkanas.   While there is a great deal of interest in developing a commerical forestry Discovery Farm, a lack of potneital funding has limited those plans to date.  As we continue to collect data, we hope we can provide timely information on both economic and natural resource sustainability on behalf of Arkansas Agriculture to regulators, lawmakers and other decision makers. 

Authors

Andrew Sharpley, Professor, Division of Agriculture, University of Arkansas System, sharpley@uark.edu

Mike Daniels, Professor, Cooperative Extension, Division of Agriculture, University of Arkansas System

Neal Mays, Program Technician, Division of Agriculture, University of Arkansas System

Cory Hallmark, Program Technician, Cooperative Extension, Division of Agriculture, University of Arkansas System

Additional Information

http://discoveryfarms.uark.edu/

Acknowledgements

Arkansas Association of Conservation Districts, Arkansas Conservation Commission, Arkansas Natural Resource Conservation Service, Arkansas Farm Bureau


The authors are solely responsible for the content of these proceedings. The technical information does not necessarily reflect the official position of the sponsoring agencies or institutions represented by planning committee members, and inclusion and distribution herein does not constitute an endorsement of views expressed by the same. Printed materials included herein are not refereed publications. Citations should appear as follows. EXAMPLE: Authors. 2013. Title of presentation. Waste to Worth: Spreading Science and Solutions. Denver, CO. April 1-5, 2013. URL of this page. Accessed on: today’s date.

Software For Evaluating the Environmental Impact of Dairy and Beef Production Systems

Waste to Worth: Spreading science and solutions logoWaste to Worth home | More proceedings….

Why Model Environmental Impacts of Livestock?

Quantifying the long term environmental impacts of dairy and beef production is complex due to the many interactions among the physical and biological components of farms that affect the amount and type of emissions that occur. Emissions are influenced by climate and soil characteristics as well as internal management practices. Software models are needed to perform an integrated and comprehensive assessment of all important environmental and economic effects of farm management and mitigation strategies. Related: Manure value & economics

What Did We Do?

Figure 1. The Integrated Farm System Model simulates the performance, determines the economics, and predicts the air and water emissions of farm production systems.

Software tools were created that perform whole-farm analyses of the performance, economics and environmental impact of dairy and beef production systems. The Integrated Farm System Model (IFSM) is a comprehensive research tool that simulates production systems over many years of weather to quantify losses to the environment and the economics of production. From the simulated performance and losses, environmental footprints are determined for carbon, energy use, water use and reactive nitrogen loss. Crop, dairy and beef producing farms can be simulated under different management scenarios to evaluate and compare potential environmental and economic benefits. The Dairy Gas Emissions Model (DairyGEM) provides a simpler educational tool for studying management effects on greenhouse gas, ammonia and hydrogen sulfide emissions and the carbon, energy and water footprints of dairy production systems.

What Have We Learned?

Analyses with either the IFSM or DairyGEM tools illustrate the complexity of farming systems and the resultant effect of management choices. Although IFSM was primarily developed and used as a research tool, it is also used in classroom teaching and other education applications. DairyGEM provides an easier and more graphical tool that is best suited to educational use.

Future Plans

Figure 2. DairyGEM is an educational tool for evaluating management effects on air emissions and environmental footprints of dairy production systems.

Development of these software tools continues. Work is currently underway to add the simulation of VOC emissions to both models. Routines are also being implemented to better represent the performance and emissions of beef feed yards.

Authors

C. Alan Rotz, Agricultural Engineer, USDA/ARS; al.rotz@ars.usda.gov

Additional Information

The IFSM and DairyGEM software tools are available through Internet download [https://www.ars.usda.gov/research/software/?modeCode=80-70-05-00] for use in individual, workshop and classroom education. Reference manuals and other detailed information on the models is also available at this website.

Acknowledgements

Many people have contributed to the development of these models and software tools. Although they can not all be listed here, they are acknowledged in each software program.

The authors are solely responsible for the content of these proceedings. The technical information does not necessarily reflect the official position of the sponsoring agencies or institutions represented by planning committee members, and inclusion and distribution herein does not constitute an endorsement of views expressed by the same. Printed materials included herein are not refereed publications. Citations should appear as follows. EXAMPLE: Authors. 2013. Title of presentation. Waste to Worth: Spreading Science and Solutions. Denver, CO. April 1-5, 2013. URL of this page. Accessed on: today’s date.

Environmental Footprints of Beef Produced At the U.S. Meat Animal Research Center

Waste to Worth: Spreading science and solutions logoWaste to Worth home | More proceedings….

Why Study the Environmental Footprint of Beef?

As a major contributor in food production, beef production provides a major service to our economy that must be maintained. Production of cattle and the associated feed crops required also impact our environment, and this impact is not well understood. Several studies have determined the carbon footprint of beef, but there are other environmental impacts that must be considered such as fossil energy use, water use, and reactive nitrogen loss to the environment. Because of the large amount of data available to support model evaluation, production systems of the U.S. Meat Animal Research Center were simulated with the Integrated Farm System Model for the purpose of evaluating the environmental impact of the beef cattle produced.

What Did We Do?

The environmental footprints of beef produced at the U.S. Meat Animal Research Center (MARC) in Clay Center, Nebraska were determined with the objective of quantifying improvements achieved over the past 40 years. Relevant information for MARC operations was used to establish parameters representing their production system with the Integrated Farm System Model. The MARC farm, cow calf and feedlot operations were each simulated over recent historical weather to evaluate performance, environmental impact and economics. The current farm operation included 2,078 acres of alfalfa and 2,865 acres of corn to produce feed predominately for the beef herd of 5,500 cows, 1200 replacement heifers and 3,724 cattle finished per year. Spring and fall cow calf herds were fed on 24,000 acres of pastureland supplemented through the winter with hay and silage produced by the farm operation. Feedlot cattle were backgrounded 3 mo on hay and silage and finished over 7 mo on a diet high in corn grain and wet distiller’s grain.

What Have We Learned?

Model simulated predictions for weather year 2011 were within 1% of actual records for feed production and use, energy use, and production costs. A 25-year simulation of their current production system gave a carbon footprint of 10.9 lb of CO2 equivalent units per lb body weight (BW) sold, and the energy required to produce that beef was 11,400 Btu/lb BW. The total water required was 2,560 gallon/lb BW sold, and the water footprint excluding that obtained through precipitation was 335 gallon/lb BW. Reactive N loss was 0.09 lb/lb BW, and the simulated total cost of producing their beef was $0.96/lb BW sold. Simulation of the production practices of 2005 indicate that the use of distiller’s grain in animal diets has had a small impact on environmental footprints except that reactive N loss has increased 10%. Compared to 1970, the carbon footprint of beef produced has decreased 6% with no change in the energy footprint, a 3% reduction in the reactive N footprint, and a 6% reduction in the real cost of production. The water footprint, excluding precipitation, has increased 42% due to greater use of irrigated corn production.

Future Plans

Now that the modeling approach has been shown to appropriately represent beef production systems, further simulation analyses are planned to evaluate beef production systems on a regional and national scale.

Authors

C. Alan Rotz, Agricultural Engineer, Pasture Systems and Watershed Management Research Unit, USDA/ARS al.rotz@ars.usda.gov

B.J. Isenberg, Research Assistant, The Pennsylvania State University

K.R. Stackhouse-Lawson, Director of Sustainability Research, National Cattlemen’s Beef Association

E.J. Pollak, Director, Roman L. Hruska U.S. Meat Animal Research Center, USDA / ARS

Additional Information

C. Alan Rotz, al.rotz@ars.usda.gov

Acknowledgements

Funded in part by The Beef Checkoff and the USDA’s Agricultural Research Service


The authors are solely responsible for the content of these proceedings. The technical information does not necessarily reflect the official position of the sponsoring agencies or institutions represented by planning committee members, and inclusion and distribution herein does not constitute an endorsement of views expressed by the same. Printed materials included herein are not refereed publications. Citations should appear as follows. EXAMPLE: Authors. 2013. Title of presentation. Waste to Worth: Spreading Science and Solutions. Denver, CO. April 1-5, 2013. URL of this page. Accessed on: today’s date.

Water Quality Initiatives for Small Iowa Beef and Dairy Feedlot Operations (Small Feedlot Project)

Waste to Worth: Spreading science and solutions logoWaste to Worth home | More proceedings….

Abstract

Traditionally, small feedlots and dairies have not been engaged in environmental regulations and awareness in Iowa due to the environmental focus being directed at large feedlots and confinement feeding operations.  Many small feedlot and dairy managers do not even recognize or admit that regulations do apply to their livestock operation. This effort primarily uses traditional extension outreach methods, field days and publications, to raise awareness.  Unique to this outreach effort are the goal to provide a producer network to share information and ideas to learn more about manure runoff control structures and best management practices to reduce impacts on water quality, and the focus on controls beyond minimum rule requirements, but tailored to small operations.

This talk will discuss some of the challenges faced by small feedlot producers, identification of parameters to help producers overcome some of these challenges, and methods and educational materials aimed at helping raise environmental awareness and foster action among these producers.

Purpose

The Small Feedlot Project is a cooperative effort between state and federal regulatory agencies, public research and extension, technical agencies and the private sector in Iowa.  The primary objectives are to 1) educate producers to better understand the pollution potential of open feedlot runoff, 2) train producers to accurately assess the water pollution potential of their own feedlots, 3) assist producers to identify and evaluate appropriate runoff control alternatives, and 4) provide technical assistance to producers to implement solutions that improve the environmental performance of their feedlots.  

What Did We Do?

The first focus in regards to raising awareness about potential impacts of runoff from open feedlots was the development of two producers guides that specifically talk about open lot runoff and impacts on water quality,  applicable regulations,  the importance and how to assess risk, structural solutions, management solutions and a list of appropriate resources.  The guides, PM 3018, Small Open Beef Feedlots in Iowa- a producer guide and PM 3019, Small Open Lot Dairies in Iowa- a producer guide, were both written and printed in 2012.  These publications were peered reviewed by internal and external partners to the Small Feedlot Plan.  Two-thousand copies of each publication were printed and have been widely distributed via field days, workshops and meetings.  The publications have been in such demand that as of February 2013, only 26 copies of the beef publication and 630 copies of the dairy pub remain in stock. 

The second focus to raising awareness was to offer multiple field days that showcased structural or management practices put in place by feedlot owners to address runoff from their farms.  It is well-known that livestock producers respond well to field days where they can observe physical site conditions that impact runoff, see structural (i.e. settling basins, pumping demonstration, clean-water diversions) or management practices (i.e.  pen scraping, manure removal) put in place by other producers; can ask management and cost of implementation questions to other producers; and can discuss regulations and other management decisions with Extension and agency staff. 

Three field days were held in 2012 to provide options to look at different sizes of feedlots, dirt versus concrete lots and structural and management practices on farms.  The first field day was a three-stop tour held on August 7 near Larchwood, IA with 26 people in attendance; the second field day was held on October 29 near Wall Lake, IA, with 22 people in attendance; and the third field day was held on October 31 near Andover, IA with 26 people in attendance.


What Have We Learned?

A post-field day evaluation was offered to attendees at the Wall Lake and Andover Field Days.  A summary of the evaluations completed follows:

  • 29% reported their understanding of impact of feedlot runoff on stream water quality “increased a lot”; while 56% reported their understanding “increased a little”.
  • 38% reported their understanding of lost-cost methods to better control and manage feedlot runoff “increased a lot”; while 52% reported their understanding “increased a little”.
  • 29% reported their understanding of the value of feedlot manure for crop production “increased a lot”; while 60% reported their understanding “increased a little”.
  • 31% reported their understanding of available technical and financial assistance for feedlot runoff control improvement “increased a lot”; while 58% reported their understanding “increased a little”. 
  • 35% reported they are more likely to plan and install additional improvements to feedlot runoff controls on their farms as a result of attending a field day. 

Future Plans

Future plans include the development of fact sheets that address specific practices small open lot dairy and beef operations can use to protect water quality and additional field days throughout 2013.  New materials will be posted to a Web page specifically created to host resources for small open lots. 

Authors

Angela Rieck-Hinz, Extension Program Specialist, Iowa State University, amrieck@iastate.edu

Shawn Shouse, Extension Field Ag Engineer, Iowa State University

Additional Information

Small Feedlots and Dairy Operations Web Page

Acknowledgements

Partners in the Water Quality Initiatives for Small Iowa Beef and Dairy Feedlot Operations

The authors are solely responsible for the content of these proceedings. The technical information does not necessarily reflect the official position of the sponsoring agencies or institutions represented by planning committee members, and inclusion and distribution herein does not constitute an endorsement of views expressed by the same. Printed materials included herein are not refereed publications. Citations should appear as follows. EXAMPLE: Authors. 2013. Title of presentation. Waste to Worth: Spreading Science and Solutions. Denver, CO. April 1-5, 2013. URL of this page. Accessed on: today’s date.

Using Soil Moisture to Predict the Risk of Runoff on Non-Frozen Ground

Waste to Worth: Spreading science and solutions logoWaste to Worth home | More proceedings….

Why Study Risk and Runoff Potential?

Identifying time periods when land application of manure is likely to contribute to surface runoff contamination is important for making proper management decisions and reducing the risk of surface water contamination.  Recently, a great deal of attention has been focused on reducing nutrient and sediment losses from the winter period.  However, sediment and nutrient losses during the late spring period can be significant and it is important to understand landscape and weather conditions that lead to elevated runoff risk during this time period. 

What Did We Do?

Surface runoff and weather data were gathered at multiple edge-of-field Discovery Farm monitoring stations in Wisconsin.  Soil moisture data were also collected.  Data were analyzed by each storm event during the non-frozen ground period to determine the impact of antecedent soil moisture on surface runoff generation.

What Have We Learned?

Data from the Wisconsin Discovery Farms Program has identified two key time periods with an elevated risk of surface runoff from agricultural fields: the late winter period (February – March) and the late spring period (May – June).  Eighty-one percent of the average annual surface runoff was observed during these two time periods with the late winter period accounting for 50% and the late spring period accounting for 31%.  Data collected over the past 12 years of the Wisconsin Discovery Farm Program indicate that the vast majority (86%) of non-frozen ground runoff occurs when soil moisture is in excess of 35%.   High antecedent soil moisture can indicate risk for surface runoff in agricultural watersheds and can also influence the quantity of surface runoff generated during rainfall events. Avoiding manure applications during time periods with a high probability of rainfall and when soil moisture is at or near threshold levels decreases the risk of surface water contamination. Agricultural producers can utilize soil moisture measurement to guide the timing and rate of manure application to further reduce environmental risk.

Future Plans

Producer education and outreach

Authors

Tim Radatz, Research Specialist , Discovery Farms MN & WI, radatz@mawrc.org

Anita Thompson, Associate Professor, University of Wisconsin – Madison

Fred Madison, Professor, University of Wisconsin – Madison

Additional Information

Radatz, T. F., Thompson, A. M. and Madison, F. W. (2012), Soil moisture and rainfall intensity thresholds for runoff generation in southwestern Wisconsin agricultural watersheds. Hydrol. Process.. doi: 10.1002/hyp.9460

Acknowledgements

UW Discovery Farms Program and Staff

UW-Platteville Pioneer Farm Program and Staff


The authors are solely responsible for the content of these proceedings. The technical information does not necessarily reflect the official position of the sponsoring agencies or institutions represented by planning committee members, and inclusion and distribution herein does not constitute an endorsement of views expressed by the same. Printed materials included herein are not refereed publications. Citations should appear as follows. EXAMPLE: Authors. 2013. Title of presentation. Waste to Worth: Spreading Science and Solutions. Denver, CO. April 1-5, 2013. URL of this page. Accessed on: today’s date.

Photometric measurement of ground-level fugitive dust emissions from open-lot animal feeding operations.

Waste to Worth: Spreading science and solutions logoWaste to Worth home | More proceedings….

Abstract

Fugitive dust from confined livestock operations is a primary air quality issue associated with impaired visibility, nuisance odor, and other quality-of-life factors.  Particulate matter has conventionally been measured using costly scientific instruments such as transmissometers, nephelometers, or tapered-element, oscillating microbalances (TEOMs).  The use of digital imaging and automated data-acquisition systems has become a standard practice in some locations to track visibility conditions on roadways; however, the concept of using photometry to measure fugitive dust concentrations near confined livestock operations is relatively new.  We have developed a photometric method to estimate path-averaged particulate matter (PM10) concentrations using digital SLR cameras and high-contrast visibility targets.  Digital imaging, followed by automated image processing and interpretation, would be a plausible, cost-effective alternative for operators of confined livestock facilities to monitor on-site dust concentrations.  We report on the development and ongoing evaluation of such a method for use by cattle feeders and open-lot dairy producers.

Purpose

To develop a low-cost practical alternative for measurement of path-averaged particulate matter (PM10) concentrations downwind of open-lot animal feeding operations.

What Did We Do?

Working downwind of a cattle feedyard under a variety of dust conditions, we photographed an array of high contrast visibility targets with dSLR cameras and compared contrast data extracted from the photographs with path-averaged particulate matter (PM10) concentration data collected from several TEOMs codeployed alonside the visibility targets.

What Have We Learned?

We have developed a photometric method to estimate path-averaged particulate matter (PM10) concentrations using digital SLR cameras and high-contrast visibility targets.  Using contrast data from digital images we expect to predict PM10 concentrations within 20% of TEOM values under the dustiest conditions.  Digital imaging, followed by automated image processing and interpretation, may be a plausible, cost-effective alternative for operators of open-lot livestock facilities to monitor on-site dust concentrations and evaluate the abatement measures and management practices they put in place.

Future Plans

We intend to improve the prediction accuracy of the photometric method and automate it such that it can be easily adapted for use as a cost-effective alternative for measuring path-averaged particulate matter (PM10) concentrations at cattle feedyards and open-lot dairies.

Authors

Brent Auvermann, Professor of Biological and Agricultural Engineering, Texas A&M AgriLife Research.  b-auvermann@tamu.edu

Sharon Preece, Senior Research Associate, Texas A&M AgriLife Research; Brent W. Auvermann, Professor of Biological and Agricultural Engineering, Texas A&M AgriLife Research; Taek M. Kwon, Professor of Electrical and Computer Engineering, University of Minnesota-Duluth; Gary W. Marek, Postdoctoral Research Associate, Texas A&M AgriLife Research; Kevin Heflin, Extension Associate, Texas A&M AgriLife Research; K. Jack Bush, Research Associate, Texas A&M AgriLife Research.

Additional Information

Please contact Brent W. Auvermann, Professor of Biological and Agricultural Engineering, Texas A&M AgriLife Research, 6500 Amarillo Boulevard West, Amarillo TX, 79106, Phone: 806-677-5600, Email: b-auvermann@tamu.edu.

Acknowledgements

This research was underwritten by grants from the USDA National Institute on Food and Agriculture (contract nos. 2010-34466-20739 and 2009-55112-05235).

The authors are solely responsible for the content of these proceedings. The technical information does not necessarily reflect the official position of the sponsoring agencies or institutions represented by planning committee members, and inclusion and distribution herein does not constitute an endorsement of views expressed by the same. Printed materials included herein are not refereed publications. Citations should appear as follows. EXAMPLE: Authors. 2013. Title of presentation. Waste to Worth: Spreading Science and Solutions. Denver, CO. April 1-5, 2013. URL of this page. Accessed on: today’s date.

Designing Structures to Remove Phosphorus from Drainage Waters

Waste to Worth: Spreading science and solutions logoWaste to Worth home | More proceedings….

Abstract

Several groups have developed P removal structures, which are units filled with P sorbing materials and designed to channel runoff water through them while retaining the filter material and P.  The goal is to prevent P from entering a surface water body and allow filtered P to be removed from the watershed after the P-saturated material is removed.  The P sorbing materials utilized are typically by-products from various industries and include steel slag, FGD gypsum, drinking water treatment residuals, and acid mine drainage residuals.  A modeling tool has been developed for (1) sizing a structure based on filter media properties and watershed characteristics, (2) predicting the lifetime of a P removal structure, and (3) estimating total P removal.  In addition to the modeling tool, data from full scale filters will be presented.

Why Are We Concerned About Phosphorus in Water?

Excessive phosphorus (P) in surface waters can result in algae growth, fish kills, eutrophication, and overall poor water quality.  This problem is especially evident in the Illinois River Basin and Chesapeake Bay.  Sources of P to aquatic ecosystems include wastewater treatment plants and also non-point runoff sources (agriculture, horticulture, urban/suburban landscapes).

Soils that have continuously received excess P beyond plant needs typically become “built up” to high levels of soil P.  These soils release dissolved P during rainfall/runoff events.  Current best management practices (BMPs) mostly address particulate P (i.e. P bound to soil particles) transport, not dissolved P.  Dissolved P is more damaging than particulate P because it is immediately 100% available to aquatic life.  Even if all P applications to high P soils are ceased and BMPs are implemented to reduce erosion (i.e. particulate P transport), dissolved P transport will continue to occur for at least 15 years, assuming that plants are harvested from the site.  If plants are not harvested and removed from the site, then dissolved P concentrations may remain elevated in runoff for much longer.

Because soil P levels will remain high for many years, even if P applications cease and efforts are made to “mine” the soil P using plants, the system will continue to “leak” dissolved P during every runoff event.  This has resulted in the need to develop a new BMP that can reduce the transport of dissolved P.

What Did We Do?

Through use of various industrial by-products, we constructed landscape “filters” that remove dissolved P in runoff from “hot spots” before it reaches streams and lakes.  Many industrial by- products that are typically land-filled, including materials produced during drinking water treatment, power generation, and steel production have a beneficial re-use in improving surface water quality by adsorbing P from passing water.

Phosphorus removal structure located at Stillwater Country Club, which utilizes steel slag as the P sorbing material

Several P removal structures were constructed in residential and agricultural watersheds.  Industrial by-products such as flu gas desulfurization gypsum and steel slag were used as P sorbents in the filters.  These filters can be placed in locations known to produce high dissolved P concentrations in runoff; the materials are contained within the structure, which allows them to be removed after they are no longer effective at filtering P (i.e. “saturated” with P).  The materials can then be replaced with fresh materials.  This represents a true removal of P from the system instead of simply tying up the P temporarily.

Automatic samplers and flow meters were used to monitor flow rates and collect samples for measurement of dissolved P and other parameters.  Samples were collected throughout runoff events at both inlet (pre-treatment) and outlet (post-treatment) of structures.  Based on flow volumes and measured P concentrations at the inlet and outlet of structures, P load and P load reductions were calculated.

In addition, approximately 16 different P sorbing materials were tested under flow-through conditions in the laboratory in order to quanitify P removal under different inflow P concentrations and retention times.  With this data set, we have produced a user-friendly model to aid in construction of P removal structures, predict how much P they will remove, and how long they will last until the material is saturated with P.

Phosphorus box filters designed to treat runoff from a poultry farm located in Maryland

What Have We Learned?

Over 8 months of monitoring at the Stillwater site, dissolved P concentrations varied from 0.3 to 1.5 mg L-1 for a residential watershed.  The structure located at that site was able to remove 25% of all the dissolved P that entered the structure over a time period of 8 months.  Other materials can adsorb much more P, but the hydraulic conductivity is much lower, therefore limiting the amount of water that can be treated.  Depending on the material and conditions, P removal structures can pay for themselves if a P trading credit program is ever implemented for non-point source total maximum daily loading (TMDLs).

Future Plans

The computer program model will eventually be made available on the web for practitioners, especially the Natural Resources Conservation Service (NRCS), to aid in P removal structure design.  We are also developing a new P sorbing material that will have greater P sorption capacity and a large hydraulic conductivity, enabling it to both remove P and treat large amounts of water. A large P removal structure is under construction on an eastern Oklahoma poultry farm, where it will capture and treat runoff from areas directly around the poultry houses.

Canister filters placed in a drainage ditchlocated in Maryland

Authors

Chad Penn, Associate professor of soil and environmental chemistry, Oklahoma State University,  chad.penn@okstate.edu

Josh Payne,  Area animal waste management specialist, Oklahoma State University

Chad Penn, Associate professor of soil and environmental chemistry, Oklahoma State University

Josh McGrath, Associate professor of soil fertility, University of Maryland

Jeff Vitale, Associate professor of agricultural economics, Oklahoma State University

Additional Information

Stoner, D., C.J. Penn, J.M. McGrath, and J.G. Warren.  2012.  Phosphorus removal with by-products in a flow-through setting.  J. Environ. Qual.  41:654-663.

Penn, C.J., J.M. McGrath, E. Rounds, G. Fox, and D. Heeren.  2012.  Trapping phosphorus in runoff with a phosphorus removal structure.  J. Environ. Qual. 41:672-679.

Grubb, K.L., J.M. McGrath, C.J. Penn, and R.B. Bryant. 2012. Effect of land application of phosphorus saturated gypsum on soil phosphorus. Applied and Environmental Soil Science. vol. 2012, Article ID 506951, 7 pages, 2012. doi:10.1155/2012/506951

Grubb, K.L., J.M. McGrath, C.J. Penn, and R.B. Bryant. 2011. Land application of spent gypsum from ditch filters: Phosphorus source or sink? Agricultural Sciences: 2:364-374.

Penn, C.J. and J.M. McGrath.  2011. Predicting phosphorus sorption onto normal and modified slag using a flow-through approach.  J. Wat. Res. Protec. 3:235-244.

Penn, C.J., R.B. Bryant, M.A. Callahan, and J.M. McGrath.  2011. Use of industrial byproducts to sorb and retain phosphorus.  Commun. Soil. Sci. Plant Anal.  42:633-644.

Penn, C.J., R.B. Bryant, P.A. Kleinman, and A. Allen.  2007.  Removing dissolved phosphorus from drainage ditch water with phosphorus sorbing materials.  J. Soil Water Cons.  62:269-276.

Penn, C.J., J.M. McGrath, and R.B. Bryant.  2010.  Ditch drainage management for water quality improvement. In “Agricultural drainage ditches: mitigation wetlands for the 21rst century”.  Ed. M.T. Moore.  151-173.

Acknowledgements

The authors are grateful to the NRCS, the National Slag Association, The United States Golf Association, and the USDA-ARS for their support of this work.

The authors are solely responsible for the content of these proceedings. The technical information does not necessarily reflect the official position of the sponsoring agencies or institutions represented by planning committee members, and inclusion and distribution herein does not constitute an endorsement of views expressed by the same. Printed materials included herein are not refereed publications. Citations should appear as follows. EXAMPLE: Authors. 2013. Title of presentation. Waste to Worth: Spreading Science and Solutions. Denver, CO. April 1-5, 2013. URL of this page. Accessed on: today’s date.

Case Study: Poultry Lagoon Closure in Texas

Waste to Worth: Spreading science and solutions logoWaste to Worth home | More proceedings….

Abstract

The closure of earthen lagoons associated with a caged egg-laying operation was used as a case study.  This case study presents information on the steps taken to close the lagoons, including topographic survey needs, analysis of sludge and wastewater at different times during the closure process, methods for excavating and removing the sludge, and the costs associated with the closure of earthen lagoons.  The sludge has a high fertilizer value for P2O5 and other micro- and macro-nutrients.  The cost of the closure for this case exceeded the expected cost for the earthwork for the construction of a new facility

Why Present a Case Study on Propoer Lagoon Closure?

Provide the steps taken to close the lagoons, including topographic survey needs, analysis of sludge and wastewater at different times during the closure process, methods for excavating and removing the sludge, and the costs associated with the closure of earthen lagoons.  These steps will hopefully assist others in the future closure of lagoons.

What Did We Do?

Performed closure of earthen lagoons for a caged egg-laying operation that existed for over 35 years in Gonzales County, Texas.  The 100 ft by 400 ft football field sized lagoon area with 5 – 12 ft deep sludge had accumulated approximately 20,000 cubic yards of sludge.  The photo below depicts the three lagoon areas (Infrared photograph of site depicting two lagoons and smaller wastewater storage area (USDA-NAPP, 1983).

Multiple different options for closure of the lagoon were evaluated.  Sampling in-situ materials to determine if the existing system had a realistic potential for seepage.  Detailed analysis of the sludge and wastewater were performed throughout the project.  A detailed survey of the site determined the existing volumes of sludge and wastewater.  Civil 3D and Eagle Point software programs assisted in development of a final grading plan for the site.

Construction drawings and specifications were developed to place the site into pre-existing conditions. The construction project was split into four phases:  Phase 1 – Sludge and Wastewater Removal; Phase 2 – Removal of Sludge to Nearby Agricultural Operation; Phase 3 – Demolition of Concrete Slabs and Final Grading; and Phase 4 – Establishing Vegetation on Site

Site plan generated for construction plans depicting the natural grade compared to the constructed grade of the poultry houses. (USDA-NRCS, Poultry Lagoon Closure Construction Drawings, March 2008)

Irrigation pump for the removal of wastewater (TSSWCB, 22 June 2009)

Use of field conveyor belts to stack sludge on-site.  (TSSWCB, 28 June 2009)

What Have We Learned?

Formal contracting potentially increases the cost of the project; however, observance of worker safety laws is more likely .  Initially this project was sent for bid as a turn key project consisting of 18,500 CY of sludge to be removed and land applied, removal of concrete slabs, placement of 27,000 CY of compacted earthfill, final grading and establishment of vegetative cover.  As part of the bid, the contractor was to secure a location for the sludge to be land applied or find another use for the sludge.  The bids received ranged from $1.8M up to $3M.  This level of funding was not available, so the project was split into different phases.  By breaking into phases, the cost of the project was reduced by over 75%.  Costs for application or hauling of sludge can be reduced by having an agreement in place prior to contracting.

The cost of the project was close to $250,000 for construction and sludge hauling without consideration of other costs, such as engineering design work, sample analysis, and staff time.  The earthwork associated with the construction of this site for a new facility with the excavation and placement of 27,200 CY of compacted earthfill would have been completed for approximately $70,000.

With flexible scheduling, it was possible to find a landowner that was willing to pay for the hauling and land application of sludge, which reduced the out-of-pocket expenses for the closure by more than $90,000.

The amount of Phosphorus present in the sludge was compared to the cost of commercial fertilizer.  As of February 2011, Rock Phosphate with 32% P2O5 was selling at $160/metric ton (Index Mundi, 11 June 2012), therefore P2O5  was $500 per metric ton.  Using the hauled weight of 12,100 tons with a moisture content of 25.9% and 5.66% P and a conversion factor of 2.29 for P to P2O5, there was 1,160 tons (1,054 metric tons) of P2O5.  At the rate of $500 /metric ton, the P2O5 in the sludge would have a value of $525,000.  There is additional fertilizer value for the other constituents that are not included.

Future Plans

This case study provides much needed data for the closure of similar operations across the United States.  The data collected will be used for future closures under the NRCS Environmental Quality Incentives Program (EQIP).  The construction specifications that were developed for this project can be adapted into general specifications for future closure projects.  Additional work is needed to compare the value of the sludge to a fertilizer value.  The potential for a portable pelletizing and bagging system for recycling sludge from lagoons warrants further research.

Authors

Catherine Nash, Water Resources Engineer, USDA – Natural Resources Conservation Service Catherine.nash@tx.usda.gov

Additional Information

“Case Study:  Closure of Earthen Lagoon”, An ASABE Meeting Presentation, Paper No. 1336921

Archived webinar  – Poultry Lagoon Closure – Case in Progress

Acknowledgements

Contributions from Texas Poultry Federation, Gonzales Soil and Water Conservation District, Texas State Soil and Water Conservation Board (TSSWCB), USDA – Natural Resources Conservation Service (NRCS), Texas Water Resources Institute, Farm Pilot Project Corporation, Inc. (FPPC) and others made this project possible. A special thanks to:  John Foster, TSSWCB, and James Grimm, Texas Poultry Federation, for initiating the project and keeping it moving forward;  Lee Munz, TSSWCB for assistance with surveying and taking the lead on his first construction project; John Mueller, NRCS for his support and guidance through the process; Ace Fairchild, NRCS, for his enthusiasm and support throughout the project; Wayne Gabriel, NRCS, for assistance with soils identification; Tom Beach, NRCS, for evaluating feasibility of other options for closure; Shawn Higgins for assistance, endurance and encouragement with the development of Engineering Drawings and Specifications.  Thanks to Gonzales County Soil and Water District Employees who helped throughout the project, including:  Jeremiah Ford, Abigail Lindsey, Shari Johnson, Jessi Goodson and Wain Fairchild.  Thanks to TSSWCB staff including: Lawrence Brown, Jeff Cerny, Amy Devereaux, TJ Helton, Dawna Winkler, and Kenny Zajicek.  Thanks to USDA-NRCS staff including:  James Davis, Andria Heiges, Jeff Porter, Doug Sharer, James Smith, and Millie Stevens.  Thanks to AgriLife Extension members:  Saqib Mukhtar, Biological and Agricultural Engineering Department; and Sam Feagley, Department of Soil and Crop Sciences.  Every person that was asked for assistance responded graciously and enthusiastically in a timely manner.

The authors are solely responsible for the content of these proceedings. The technical information does not necessarily reflect the official position of the sponsoring agencies or institutions represented by planning committee members, and inclusion and distribution herein does not constitute an endorsement of views expressed by the same. Printed materials included herein are not refereed publications. Citations should appear as follows. EXAMPLE: Authors. 2013. Title of presentation. Waste to Worth: Spreading Science and Solutions. Denver, CO. April 1-5, 2013. URL of this page. Accessed on: today’s date.