Pathways for Effective Manure Nutriment Management Information Sharing and Education Between Agriculture Professionals: A South Dakota Pilot Test


Why Look at Barriers in Nutrient Management Information Flow?


The issue of manure nutrient management has been the subject of controversy and new policies in recent years as the non-point source discharge of nutrients and bacteria is substantial if manure is not managed properly. Unfortunately, there are barriers between organizations and individuals that prevent the flow of important, timely information between audience types and limits the impact and usefulness of research results. These barriers may be in the form of institutional language differences, job descriptions, or a mismatch between information outputs and inputs.

What did we do?

A national team of researchers, Extension specialists, consultants and government staff developed a survey to quantify the role, programming, and barriers to information flow between organizations and individuals regarding manure nutrient management. The electronic survey was disseminated via cooperating agencies, organizations and personal contacts to technical service providers, producers, university personnel, regulatory personnel, private sales or service enterprises and other professionals who contribute to manure nutrient management in South Dakota. Respondents were asked to indicate the relevance of information sources (inputs), information products (outputs) and collaborators (links), as well as barriers to their use. The relevance selections were transformed into scalar data and an analysis of variance was performed on the average relevance scores to test for differences based on input/output/link type and organization type.

What have we learned?

There were 139 surveys started, and 80 surveys completed. Data from partially completed surveys were, however, included in the analysis. The main categories of self-identified respondents were NRCS (n=36), Producers (n=29), University personnel (n=15) and Regulatory personnel (n=9). The remaining categories respondents were grouped into an Other category (n=22). The average relevance score for each of the information sources, information products and collaborations listed in the survey were consistent (no significant difference between organization types). As sources of information, consultation, eXtension and field days were ranked most relevant, with classroom and social media being least relevant. Similarly, consultation, field days and eXtension were ranked the most relevant means of sharing information; social media was ranked least relevant. Barriers to information sources and products were specific to the activity or product. The select ion “No barriers to use” was not an indicator of relevance. All organization types deemed producers the most relevant collaborator, followed by state, university and federal agencies.

Future Plans

The South Dakota-based survey was a pilot test for a nationwide survey being conducted in 2015. From feedback and data review, the survey has been refined and shortened to elicit the key input, output and collaborator data. With the national data in hand later in 2015, the project team looks forward to linking information producers and users in effective pathways for manure nutrient management information transmission, and ultimately, adoption.

Authors

Erin Cortus, Assistant Professor and Environmental Quality Engineer at South Dakota State University erin.cortus@sdstate.edu

Nichole Embertson, Nutrient Management Specialist, Sustainable Livestock Production Program, Whatcom Conservation District; Jeffrey Jacquet, Assistant Professor, Sociology and Rural Studies, South Dakota State University

Additional information

Anyone interested in participating on the Pathways Project team are invited to contact Erin Cortus (erin.cortus@sdstate.edu) or Nichole Embertson (NEmbertson@whatcomcd.org).

Acknowledgements

The nationwide team who contribute to and guide the Pathways project are gratefully acknowledged. Funding provided through the South Dakota SARE Mini-Grant Program supported data collection and analysis for the survey pilot test.

The authors are solely responsible for the content of these proceedings. The technical information does not necessarily reflect the official position of the sponsoring agencies or institutions represented by planning committee members, and inclusion and distribution herein does not constitute an endorsement of views expressed by the same. Printed materials included herein are not refereed publications. Citations should appear as follows. EXAMPLE: Authors. 2015. Title of presentation. Waste to Worth: Spreading Science and Solutions. Seattle, WA. March 31-April 3, 2015. URL of this page. Accessed on: today’s date.

 

Existing Equine Pasture Best Management Survey Findings from NE-1441 States


Purpose

Pasture is a good source of nutrition and 94% of U.S. equine operations allow horses to access pastures [8]. Proper management of equine operations requires the adoption of Best Management Practices (BMPs) to balance nutrient production and prevent erosion. Government agencies are concerned about non-point sources of water pollution and have focused on agriculture, including equine operations, as a major contributor to water quality issues. Many states’ laws have regulated equine farms, requiring farm managers to incorporate BMPs. Best Management Practice utilization on horse farms needs to be quantified before regulations are adopted. The objectives of these various states’ surveys were to quantify and assess the use of the equine industry’s BMPs in pasture management and erosion control and to examine potential environmental impacts. The object of this abstract is to compare and look for some similarities in the ways horse farms are managed to mitigate negative environmental impacts. Few studies have investigated horse BMPs in the regions. More research is needed to assess the effect of horse farm management on the nation’s water quality.

What did we do?

Over the past five years, state university extension equine specialist participating on the NE-1441: Environmental Impacts of Equine Operations, multi-state project, have conducted surveys of their state equine industry. Many of the state surveys were conducted to quantify and assess the use of the equine industry’s BMPs in pasture management and erosion control and to examine potential environmental impacts.

In all cases a written survey instrument was developed and the questions were reviewed by experts in the field for content and face validity. Some of the surveys used the multiple waves, (postage) mailing techniques, while some used online survey mailings, and others used an SRS clicker feedback style quiz during a program or event [1,3,7,10]. Several states developed a large list of names and email addresses consisting of horse owners/farm managers from within their state. All used follow-up reminders sent to non-responding addresses to increase return rates. All of the state’s surveys analyzed the data for descriptive statistics. Frequencies and percentages were determined for all surveys. Cross tabulations were used to determine the relationship between management practices and farm management demographics. There is difficulty in comparing the different surveys because they are all different in methodology and in the way they were conducted and analyzed.

What have we learned?

Size and scope of the equine industry-

The New Jersey equine industry consists of 7,200 horse farms with 29% having 8 or more horses. In NJ more than 50% of the farms had 5 or fewer horses and 56% of the farms had 4.05 hectors (10 ac) or less and 18.6% had more than 8.09 ha. [10] The Maryland Equine Industry consists of 87,000 horses located on 20,200 operations, averaging 11.6 ha of pasture [3].  The Pennsylvania study averaged housing 13.4 horses on 21 ha (52.7 ac) of pasture and has 32,000 operations [7].  The Tennessee study reported the average herd size of 5, with 25.6 ac designated for pasture [6]. Forty-two percent of Vermont’s horse operation house over 9 horses on 25 ac of land.

Methods horse farms used to manage pasture quality-

Results of a Pennsylvania horse farm survey showed, that during the growing season, as many as 65% reported using a rotational pasture system and 25% continuously grazing horses [7].  A Maryland survey found that only 30% of horse farm operators used rotational grazing on their farms [3].  In a Tennessee survey, continuous grazing was practiced by 51.5% of respondents. Only 23.8% of TN respondents allowed pasture to recover to a recommended grazing height and 45.3% reported sometimes resting pastures [6].  The New Jersey survey reported 54% practicing some form of rotational grazing [9].  A study conducted on farms in Minnesota and Wisconsin revealed farms had an average stocking density of 1.75 acres per horse [1].  Designated sacrifice lots were present on 84% of farms, while the average ground cover was 88% in NJ [10]. The PA study, reported 23.8% allowed pasture to recover to a recommended grazing height and 45.3% reported sometimes resting pastures. Most respondents, 75.4% assessed their pasture vegetative cover at 80% or better, and 5% reported poor vegetative cover [7].

Methods horse farms used to manage soil and weeds-

Pasture weed problems were reported to be a major issue by 78.1% of TN owners. Half of TN farm operators (49.8%) indicated they have never performed soil fertility tests [6]. While in NJ, 31% of horse farms indicated they soil test [10]. PA horse farm operators (49.8%) indicated they have never performed soil fertility tests on their pastures, with only 25.4% testing soil every 1-3 yrs [7].  In the NJ survey 89% reported mowing pastures [10].

Methods horse farms used to manage manure-

The PA survey reported that farms composting and using compost on the farm (34.1%), hauled off the farm fresh (10.9%), spread fresh on crop/pasture fields daily (10.6%), composted and hauled off farm (7.7%), horses pastured 24 hr/d with manure harrowed or removed (16.4%), horses pastured 24 hr/d with manure never managed (7.1%) [7]. New Jersey farms, 54% indicated they spread manure on their farmland, and 74% indicated that they have a designated area for storing manure. NJ farm with greater pasture acreage were positively correlated with having manure storage [10].  The TN survey, reported, that stall waste was stored on bare ground in uncovered piles (89.8%) and either stored indefinitely or spread regularly on pastures [6].

How do farm managers receive/obtain information-

Several studies showed, horse managers are receiving most of their educational information from publications, magazine articles and the internet [7].  Therefore, Extension needs to reach horse farm managers with what we do best, factsheets, popular press articles and meetings. In the PA survey, resources participants used for information included books, magazines, publications (79.4%), internet resources (79.1%), acquaintances (65%), agencies (60.5%), multi-media (27.8%), private businesses (15.7%), and 2% reported using none. Participants indicated that the primary limitation to them altering current management practices was finances (75%), knowledge (37.5%), regulations (13.7), and an inability to obtain services (11.7%) [7].

In a South Dakota study, 29% of participants indicated that their primary need for information was regarding horse pasture management and 12% wanted to figure out how to increase grazing for horses as a primary goal. Many new SD landowners were present at an Extension event with 38% having owned their acreage for less than 3 years, and only 19% had owned their acreages for more than 10 years [5].

Future Plans

Knowledge of the current scope and nature of equine industry management practices are important when developing regulations and laws that will govern land management on equine operations. Recently, several state environmental regulations are having a direct impact on equine operations. However, horse farms frequently manage horses on fewer acres per animal unit and have the potential to pose a significant environmental risk. A NJ study reported that the rate of spreading manure decreased on farms with over 20 horses [10].

Most states surveys data shows that many horse farms are utilizing BMPs to help reduce environmental impact. However, many of these studies determined that landowners of small acreages have little knowledge of natural resources management [2,5,7].  There are several areas, such as soil testing and the use of sacrifice loafing areas in pasture management, where educational programming and cost share funding are needed to target specific BMPs underutilized by the equine industry. Nearly all survey respondents reported having some pasture and nutrient management questions [2,5,7,10].

In order to help stable managers understand the principles of sustainable best management practices, Cooperative Extension can conduct state-wide “Environmental Stewardship Short Courses.” These educational programs need to be a comprehensive series of educational programs (face-to-face meeting or webinars) to promote adoption of best management practices on equine operations. In addition, what is really needed is a comparative surveys instrument that can be used nation-wide to quantify and assess the use of the equine industry’s BMPs on horse farms.

Authors

Ann Swinker, Extension Horse Specialist, Pennsylvania State University aswinker@psu.edu

Betsy Greene, Extension Equine Specialist, University of Vermont

Amy Burk, Extension Horse Specialist, University of Maryland

Rebecca Bott, Extension Equine Specialist, South Dakota State University

Bridget McIntosh, Extension Equine Specialist, Virginia

Additional information

  1. Earing J, Allen E, Shaeffer CC, Lamb JA, Martinson KL. Best Management Practices on Horse Farms in Minnesota and Wisconsin. J Anim. Sci. 2012; 90:52.
  2. Fiorellino, N., McGrath , J., Momen, B., Kariuki, S., Calkins, M., Burk, A., 2014. Use of Best Management Practices and Pasture and Soil Quality on Maryland Horse Farms, J. Eq. Vet. Sci. 34:2, 257-264.
  3. Fiorellino, N.M., K.M. Wilson, and A.O. Burk. 2013. Characterizing the use of environmentally friendly pasture management practices by horse farm operators in Maryland. J. Soil Water Conserv. 68:34-40.
  4. Henning J, Lacefield G, Rasnake M, Burris R, Johns J, et al. Rotational grazing. University of Kentucky, Cooperative Extension Service 2000; (IS-143).
  5. Hubert, M., Bott, R.C., Gates, R.N., Nester, P.L., May 2013. Development and Branding of Educational Programs to Meet the Needs of Small Acreage Owners in South Dakota, J. of NACAA. 6:1, 2158-9429.
  6. McIntosh, B. and S. Hawkins, Trends in Equine Farm Management and Conservation Practices ASAS, Phoenix, AZ. 2/13/12.
  7. Swinker, A., S. Worobey, H. McKernan, R. Meinen, D. Kniffen, D. Foulk, M. Hall, J. Weld, F. Schneider, A. Burk, M. Brubaker, 2013, Profile of the Equine Industry’s Environmental, Best Management Practices and Variations in Pennsylvania, J. of NACAA. 6:1, 2158-9429.
  8. USDA: Aphis” VS, (1998). National Animal Health System, Highlights of Equine: part III, p. 4.
  9. Westendorf, M. L., T. Joshua, S. J. Komar, C. Williams, and R. Govindasamy. 2010. Manure Management Practices on New Jersey Equine Farms. Prof. Anim. Sci. 26:123-129.
  10. Westendorf, M. L., P. Venkata, C. Williams, J. Trpu and R. Govindasamy. 2012. Dietary and Manure Management Practices on Equine Farms in Two New Jersey Watersheds, Eq. Vet. Sci. 33:8,601-606.

Acknowledgements

The State University Extension Equine Specialist that make up the NE-1441: Environmental Impacts of Equine Operations, Multi-State Program. USDA, NRCS-CIG grant for funding the Pennsylvania project.

The authors are solely responsible for the content of these proceedings. The technical information does not necessarily reflect the official position of the sponsoring agencies or institutions represented by planning committee members, and inclusion and distribution herein does not constitute an endorsement of views expressed by the same. Printed materials included herein are not refereed publications. Citations should appear as follows. EXAMPLE: Authors. 2015. Title of presentation. Waste to Worth: Spreading Science and Solutions. Seattle, WA. March 31-April 3, 2015. URL of this page. Accessed on: today’s date.
Identify and Synthesize Methods to Refine Phosphorus Indices from Three Regional Indexing Efforts

Purpose

This project was started to work with regional CIG projects to calibrate and harmonize Phosphorus Indices across the U.S., demonstrate their accuracy in identifying the magnitude and extent of phosphorus loss risk, and provide suggestions to refine or improve existing Indices. This research is important to provide consistency among state Phosphorus Indices and their subsequent recommendations.  

What did we do?

We will combine and compare results from each of the four regional and state Phosphorus Index CIG-funded projects, in order to synthesize, summarize, and describe the science-based information and lessons learned from the individual Phosphorus Index assessment projects (i.e., Chesapeake Bay Watershed, Heartland Region, Southern States and Ohio Lake Erie Basin) and build a harmonized framework that yields consistent Phosphorus-based risk assessment across the U.S. by doing this, we plan to ensure that the refinement of Phosphorus Indices is grounded in the best available science, reflects local environmental and agronomic conditions, anticipates impacts to water quality and farm management, and provides consistent recommendations within and across varied physiographic regions of the U.S.

What have we learned?

Despite the success of the Phosphorus Index concept in state-level nutrient management planning strategies as part of the NRCS 590 Standard, there remain concerns about the effectiveness of the Indexing approach for attaining water quality goals. Different versions of the Phosphorus Index have emerged to account for regional differences in soil types, land management, climate, physiographic and hydrologic controls, manure management strategies, and policy conditions. Along with this development, differences in Phosphorus Index manure management recommendations under relatively similar site conditions have also emerged. To date, we have learned that the individual projects with slightly differing objectives have shown there to be a paucity of field measured runoff, against which to reliably compare Index performance. Thus, several off-the shelf and pre-calibrated models (e.g., APEX) were tested to provide adequate phosphorus runoff information to validate Indices. Use of off-the-shelf models can provide unreliable estimates of phosphorus runoff, while calibrate models can provide more reliable estimates when given adequate site information.

Future Plans

It is planned to have extend the research for one more year to the end of 2016 to continue model assessment, compile field runoff databases, conduct statistical and uncertainty analyses, and compile cross project findings.

Authors

Andrew Sharpley, Distinguished Professor, Division of Agriculture University of Arkansas System sharpley@uark.edu

Deanna Osmond, Professor and Soil Science Department Extension Leader; David Radcliff, Professor; Peter Kleinman, Research Leader; Doug Beegle, Distinguished Professor of Agronomy; John Lory, Associate Professor of Extension; and Nathan Nelson, Professor.

Additional information

Sharpley, A.N., D. Beegle, C. Bolster, L. Good, B. Joern, Q. Ketterings, J. Lory, R. Mikkelsen, D. Osmond, and P. Vadas. 2011. Revision of the 590 Nutrient Management Standard: SERA-17 Recommendations. Southern Cooperative Series Bulletin No. 412. Published by SERA-IEG-17, Virginia Tech. University, Blacksburg, VA. Available at https://sera17dotorg.files.wordpress.com/2015/02/590-sera-17-recommendations.pdf 2011.

Sharpley, A.N., D. Beegle, C. Bolster, L. Good, B. Joern, Q. Ketterings, J. Lory, R. Mikkelsen, D. Osmond, and P. Vadas. 2011. Revision of the 590 Nutrient Management Standard: SERA-17 Supporting Documentation. Southern Cooperative Series Bulletin No. 412. Published by SERA-IEG-17, Virginia Tech. University, Blacksburg, VA. Available at https://sera17dotorg.files.wordpress.com/2015/02/590-sera-17-recommendations.pdf

Sharpley, A.N., D.G. Beegle, C. Bolster, L.W. Good, B. Joern, Q. Ketterings, J. Lory, R. Mikkelsen, D. Osmond, and P.A. Vadas. 2012. Phosphorus indices: Why we need to take stock of how we are doing. J. Environ. Qual. 41:1711-1718.

Osmond, D.L., A.N. Sharpley, C. Bolster, M. Cabrera, S. Feagley, B. Lee, C. Mitchell, R. Mylavarapu, L. Oldham, F. Walker, and H. Zhang. 2012. Comparing phosphorus indices from twelve southern USA states against monitored phosphorus loads from six prior southern studies. J. Environ. Qual. 41:1741-1750.

The authors are solely responsible for the content of these proceedings. The technical information does not necessarily reflect the official position of the sponsoring agencies or institutions represented by planning committee members, and inclusion and distribution herein does not constitute an endorsement of views expressed by the same. Printed materials included herein are not refereed publications. Citations should appear as follows. EXAMPLE: Authors. 2015. Title of presentation. Waste to Worth: Spreading Science and Solutions. Seattle, WA. March 31-April 3, 2015. URL of this page. Accessed on: today’s date.


Extension Recognizes Pennsylvania Farms that Adopt Sound Management Practices Protecting Water Quality and the Environment

penn state extension environmental friendly farm signPurpose

The Environmentally Friendly Farm program was developed by Penn State Equine Extension and is designed to recognize farms that adopt environmentally sound management practices that protect water quality and the environment. The program is supported by funds from the USDA Natural Resource Conservation Service (NRCS), Conservation Innovation Grant. Strategies are employed on Environmentally Friendly Farms to maintain productive pastures, reduce soil erosion, limit nutrient runoff from animal facilities and barnyards, safely store manure, recycle nutrients, and control animal access to surface waters. Excess sediment and nutrient runoff from manure poses health threats not only to the environment, but also to animals and people. Farm managers who practice environmental stewardship maintain healthy environments for their animals, their families, and their community.

What did we do?

Farm managers can apply for the program by request a copy of the application from Penn State Equine Extension by visiting us online at http://www.extension.psu.edu/equine, emailing or calling our extension office. Second, complete the Environmentally Friendly Farm application requesting background information about the farm operation.

Next, complete the Environmentally Friendly Farm Self-Assessment Checklist. Each statement is checked “yes” if the practice is in place on the farm, “no” if the practice is not in place or “non-applicable if the statement does not pertain to the farm operation. The checklist consists of a series of statements that identify potential on-farm practices in the following areas: Environmentally Sensitive Areas, Pastures, Animal Concentration Areas, Manure Storage, and Mechanical Manure Application.

Once the paperwork has been received, a farm site visit will be scheduled. Personnel from Penn State Extension, the County Conservation District, or the Natural Resource Conservation District (NRCS) will visit farms to verify that statements made in the application and checklists are accurate. At the same time, additional information and assistance will be provided to help improve farm management and develop any necessary plans for the farm.

The farm will be recognized by the public, conservation and agricultural agencies, and other farm managers as an operation that is committed to clean water and a healthy environment. Each farm manager will receive an Environmentally Friendly Farm sign that can be displayed on the farmstead. Farms that qualify will also be given permission to use the Environmentally Friendly Farm artwork on their website, brochure, and other marketing materials. Approved farms will be listed on the Penn State Equine Extension website.

This recognition will reflect the commitment of the farm manager to environmental stewardship and can serve as a marketing tool for the farm.

What have we learned?

After personnel visited farms to verify that statements made in the application and checklists are accurate. At the same time, additional information and assistance is provided to help improve farm management and develop any necessary plans for the farm. In addition, agency personal developed a personal relationship with the farm manager. The farm managers who practice environmental stewardship maintain healthy environments for their animals, their families, and their community.

Future Plans

This program will be continued through 2016. We hope to provide additional information and assistance to help improve farm management.

Authors

Ann Swinker, Extension Horse Specialist aswinker@psu.edu

Donna Foulk, Helene McKernan, Pennsylvania State University, University Park, PA 16802

Additional information

Farms can request a copy of the application from the Penn State Extension Equine Team by visiting us online at http://www.extension.psu.edu/equine

Acknowledgements

This program was funded partly by a USDA NRCS-CIG grant.

The authors are solely responsible for the content of these proceedings. The technical information does not necessarily reflect the official position of the sponsoring agencies or institutions represented by planning committee members, and inclusion and distribution herein does not constitute an endorsement of views expressed by the same. Printed materials included herein are not refereed publications. Citations should appear as follows. EXAMPLE: Authors. 2015. Title of presentation. Waste to Worth: Spreading Science and Solutions. Seattle, WA. March 31-April 3, 2015. URL of this page. Accessed on: today’s date.

Relationship between Surface Waters and Underlying Stream and Ditch Sediment in Selected Eagle Creek Tributaries


Why are stream and ditch sediment important to water quality?

Best management strategies implemented in most watersheds to reduce phosphorus (P) loads to surface waters have been successful, however, internal P loading within streams and ditches may still provide P to overlying water. Phosphorus retention and release by sediments is important for understanding sediment P status and buffering capacity and for determining the potential environmental fate of sediment bound P in flowing water systems.

What did we do?

Eight headwater streams and drainage ditches within Eagle Creek Watershed in central Indiana were selected to evaluate soluble P (SP). Stream and drainage ditch water and sediment were collected monthly from 8 selected locations within the Eagle Creek watershed in central Indiana for two consecutive years to estimate if there were any seasonal and/or land use trends. Sediments and water were analyzed for soluble P, and 24-hour P isotherms were performed to determine the P sorption capacity and to calculate the equilibrium P concentration (EPC0). The relationship between  EPC0 and SP in the water column allows for the prediction of the potential for sediments to either release P to or retain P from the water column.

What have we learned? 

Surface water P concentrations varied seasonally and were consistently greater during summer (P<0.05). Surface water SP concentrations increased with the percentage of land classified as urban (P<0.0001). Generally, we observed lower P concentrations in sediment during summer and greater P concentrations during winter and spring. We also observed greater P concentrations in areas that had a greater percentage of land used for agriculture and in some cases, sub-catchment area influenced the P content that was observed. Sediment EPC0 concentrations were not related to water column SP, however, when sediments were separated as ‘sinks’(r = 0.49) or ‘sources’(r = 0.65), a strong correlation was found between sediment EPC0 and water column SP (P<0.0001).

Future Plans    

Information from this study will assist managers and planners in targeting areas with the greatest potential for loss of P from sediments to overlying water. These results will also assist in improving nutrient criteria thresholds for the watershed.

Authors      

Candiss O. Williams, Research Soil Scientist, USDA NRCS Kellogg National Soil Survey Laboratory & Research Candiss.Williams@lin.usda.gov

Brad Joern, Professor, Department of Agronomy, Purdue University Douglas R. Smith, Research Soil Scientist, USDA ARS Grassland, Soil, and Water Research Laboratory

The authors are solely responsible for the content of these proceedings. The technical information does not necessarily reflect the official position of the sponsoring agencies or institutions represented by planning committee members, and inclusion and distribution herein does not constitute an endorsement of views expressed by the same. Printed materials included herein are not refereed publications. Citations should appear as follows. EXAMPLE: Authors. 2015. Title of presentation. Waste to Worth: Spreading Science and Solutions. Seattle, WA. March 31-April 3, 2015. URL of this page. Accessed on: today’s date.

Small to Mid-Sized Dairies: Making Compact Anaerobic Digestion Feasible

Why Consider Small or Medium Digester Projects?

Anaerobic digestion (AD) is an environmentally-friendly manure management process that can generate renewable energy and heat, mitigate odors, and create sustainable by-products such as bedding or fertilizer for dairies and farmers. However, due to economics, a majority of commercially available AD technologies have been implemented on large farming operations. Since the average herd size of dairies across the country is below 200 head of milking cows, there is a need for small-scale AD systems to serve this market.

eucolino allen farmsWhat did we do?

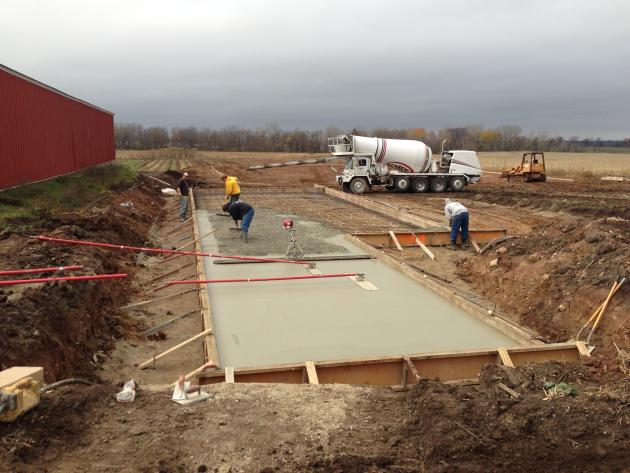
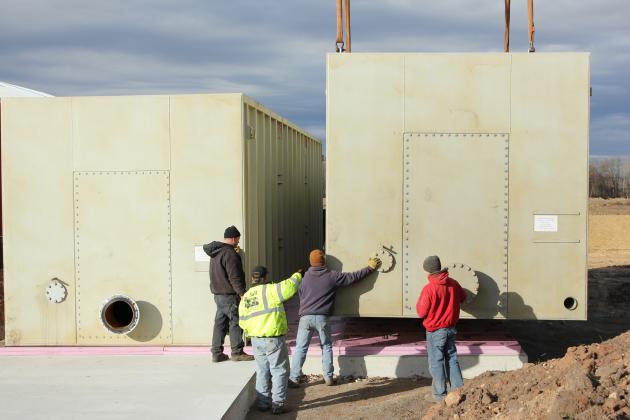
The University of Wisconsin-Oshkosh, in collaboration with BIOFerm™ Energy Systems, installed the EUCOlino—a small-scale, mixed, plug-flow digester—onto on a 136 milking head Wisconsin Dairy. The system is pre-manufactured, containerized and requires very limited on-site construction.   This includes grading, pouring a concrete pad for the containers and electrical services installation.

Start-up and commissioning were performed after the delivery of the 64 kWe combined heat and power (CHP). The input materials consist of bedded-pack dairy manure (corn or bean stover and straw), parlor wash water, and minor additional substrates such as lactose or fats, oils, and grease.

Solid materials are dumped via bucket tractor into a hopper feeder system that uses an auger to feed substrate into the anaerobic digestion tank. Additional parlor water is piped directly into the anaerobic digestion tank and mixed with the solids to make a feedstock of approximately 13% total solids. The solids are fed hourly, which is controlled by the PLC system.

The digester has a ~30-day retention time and the biogas produced is stored in a bag above the fermenters. Biogas produced is conditioned and combusted in a CHP mounted on a separate skid. Effluent from the system is pumped directly to an open pit lagoon for storage and subsequently land applied as fertilizer. The system produces approximately 25 – 33 m3/hour of biogas, with a raw biogas quality of 52-60% CH4 and less than 700 ppm H2S.

concrete pads for installation
installation
input

What have we learned?

This project has been an important step forward in developing future small-scale anaerobic digesters across the U.S.  Notably, our installation has given us insight into balancing system economics with the size of small-scale models; the energy output of the system must exceed pre-processing energy requirements and the digester must still be large enough for the designed residence time. Our experience has shown that, while reducing the size of a digester, these requirements remain essential for an installation to economically make sense.

Additionally, challenges involved in AD at the small-scale are related to pre-processing or feedstock conveyance. Once suitable consistence or size for conveyance, anaerobically digesting the organic fraction can be relatively easy. Inconsistency of incoming feedstocks is very detrimental to the system’s stability. Additionally, exterior feedstock storage and above ground piping can limit processing potential when severe cold weather settles in. While all of these are challenges that are easily overcome with engineering, they come at a cost and that can make or break the economics at this scale.

Future Plans

For the small-scale EUCOlino to be effective in the United States, it is key to establishing a U.S.- based manufacturing location. Pre-processing needs to be well-suited to the incoming feedstock. Post-digestion products need established off-takers, for electricity generation, bedding, fertilizer, etc.

Authors

Steven Sell, Manager Application Engineer, BIOFerm™ Energy Systems beaw@biofermenergy.com

Whitney Beadle, Marketing Communications, BIOFerm™ Energy Systems

Additional information

The following publications offer additional information on the Allen Farms digester:

Readers interested in this topic can also visit our website for more information on the Allen Farms digester and other BIOFerm projects. We can also be found on Facebook, Twitter, and LinkedIn.

The authors are solely responsible for the content of these proceedings. The technical information does not necessarily reflect the official position of the sponsoring agencies or institutions represented by planning committee members, and inclusion and distribution herein does not constitute an endorsement of views expressed by the same. Printed materials included herein are not refereed publications. Citations should appear as follows. EXAMPLE: Authors. 2015. Title of presentation. Waste to Worth: Spreading Science and Solutions. Seattle, WA. March 31-April 3, 2015. URL of this page. Accessed on: today’s date.

The Great Biogas Gusher


Why Pursue Bio-Energy?

The great Texas Oil Boom, also referred to as the Gusher Age, provided for dramatic economic growth in the US in the early 20th century, and ushered in rapid development and industrial growth. Although we typically think of the Middle East when we consider the impacts of oil discoveries on local economies (reference Dubai), at the time of its discovery, the oil finds in Texas were unprecedented; and the US quickly became the world’s top producer of petroleum.

As we all know, the rest of the world came to the party, and the US was soon falling in the ranks of top petroleum producers. Though the US oil reserves are vast, increasing concerns over the environmental impacts of finding, mining, extracting, refining, and consuming fossil fuels has incentivized the development of renewable energy resources, such as solar, wind, hydro, and bioenergy. Of these forms of renewable energy, bioenergy holds the promise for replacement of fossil fuels for transportation use.

a biogas collection systemWhat did we do?

Bioenergy may be described as fuels derived from organic materials, such as agricultural wastes, through processes like anaerobic digestion. The US has even more organic resources above the Earth’s surface than are identified in the petroleum and natural gas deposits yet to be exploited, yet the development of agricultural bioenergy systems seems to be progressing at a snail’s pace, as compare to the great Oil Boom. There is enormous potential in producing biogas from agricultural, industrial, municipal solid waste, sewage and animal byproducts which can be used to fuel vehicles. The EPA estimates that 8,200 US dairy and swine operation could support biogas recovery systems, as well as some poultry operations. Biogas can be collected from landfills and used to power natural gas vehicles or to produce energy. Wastewater treatment plants are estimated by the EPA to have the potential of about 1 cubic foot of digester gas per 100 gallons of wastewater, this energy could potentially meet 12% of the US electricity demand. Industrial, commercial and institutional facilities provide another source of biogas, in particular supermarkets, restaurants, and educational facilities with food spoilage.

What have we learned?

This presentation compares and contrasts the historical development of fossil fuel reserves with the potential for development of bioenergy from agricultural sources, such as animal wastes and crop residues. The US energy potential from these sources is grossly quantified, and current development inhibitions are identified and discussed. Opportunities for gathering biogas and bioenergy from multiple regional sources, similar to the processes used in the Texas oil fields, are discussed. The presentation offers insight into overcoming these obstacles, and how the US may once again rise to the top of the energy development rankings through efficient use and stewardship of our organic resources.

Percentage of waste water treatment plants that send solids to anaerobic digestion broken out by state

Future Plans

Biogas and bioenergy resources present an enormous opportunity for renewable energy development, and progression toward energy independence for the U.S. The U.S. currently has more than 2,000 active biogas harvesting sites, but claims more than 11,000 additional sites can be developed in the U.S., with the potential to power more than 3 million American homes if used to fuel electricity generating power plants. The USDA, EPA and DOE recently created a US Biogas Opportunities Roadmap which is off to a good start, which hopefully will initiate biogas programs, and foster investment in biogas systems to improve the market vitality in each state. To move the process forward, policy-makers, investors and the public need to have improved collaboration and communication on the state level. We need to develop a clear plan and strategy for developing these valuable biogas resources to promote environmental sustainability and economic growth of our b ioenergy sector.

Author

Gus Simmons, P.E., Director of Bioenergy, Cavanaugh & Associates, P.A. gus.simmons@cavanaughsolutions.com

Additional Information           

http://www.cavanaughsolutions.com 1-877-557-8924

http://www.epa.gov/climatechange/Downloads/Biogas-Roadmap.pdf

Acknowledgements      

USDA/DOE/EPA US Bioenergy Roadmap

The authors are solely responsible for the content of these proceedings. The technical information does not necessarily reflect the official position of the sponsoring agencies or institutions represented by planning committee members, and inclusion and distribution herein does not constitute an endorsement of views expressed by the same. Printed materials included herein are not refereed publications. Citations should appear as follows. EXAMPLE: Authors. 2015. Title of presentation. Waste to Worth: Spreading Science and Solutions. Seattle, WA. March 31-April 3, 2015. URL of this page. Accessed on: today’s date.

Money to Burn: How to Capitalize on BioCNG at Your Wastewater Plant

Purpose  

Across the globe, units of government are struggling with the balance of deriving clean energy with economics and environmental protection. This struggle has led to the development of many renewable energy innovations and inventions, such as rapid improvement in the cost and efficiencies of photovoltaic solar (PV) systems and the development of large off-shore wind turbine systems. The challenges imposed on energy utilities associated with managing grid variability leads emphasis on the development of ‘baseload’ alternative energy systems, like bioenergy systems. We should recognize, however, that we have a bounty of organic wastes generated by society each day, and systems that are able to recycle these organic resources into energy are capable of more consistent energy generation, as compared to the intermittency of solar and wind. In this regard, such bioenergy systems hold promise for balancing our energy needs.

Waste to worth mtb figure 1.What did we do?  

Bioenergy systems based on the utilization of organic wastes, such as municipal wastes, food wastes, and crop residues provide the additional benefits of supporting improved pollution prevention and waste treatment systems.

Of the organic wastes available for us in bioenergy systems, one may be directly correlated to the increasing energy needs and clean energy desires of the global population – waste organics associated with municipal wastewater treatment. Municipal wastewater treatment strategies vary by geography, climate, and level of development across our globe. However, in all cases, opportunities exist to utilize these waste as feedstocks for the creation of biogas that may be used to fuel electricity generators, farm implements, and the transportation needs of our population.

****the above writing doesn’t explain the work that was conducted as requested

What have we learned?  

Many municipal and industrial wastewater treatment plants (WWTP) across the U.S. already utilize anaerobic digestion as a primary treatment process to reduce sludge or reduce organic loading, expressed as Biochemical Oxygen Demand (BOD), to subsequent aerobic treatment processes. However, most of these facilities presently flare the biogas that is produced from the digestion process. Most often, these managers report the following reason for lack of implementation of energy harvesting. WHAT REASON???

We continue to seek clean, renewable energy sources across the globe to reduce our dependency on fossil fuels for improved air quality and economic stability. While solar, wind, and other renewable energy sources play a vital role in a diversified energy strategy, the development of bioenergy systems that continuously operate in ‘base load’ fashion is very important for grid stability. Additionally, unlike solar and wind, bioenergy systems that convert organic wastes into fuels have opportunities to positively impact transportation fuel needs. The development of systems that harvest biogas from anaerobic digesters employed at municipal wastewater plants can serve to fill a portion of this need, and create improved revenues for the wastewater treatment utility. Often, anaerobic digesters serving municipal wastewater treatment plants are operating well under their optimum capacity, creating opportunities for municipalities to engage in partnerships with private sector waste generators, such as food and beverage processors, restaurants, and farmers.

Many commercial fleets are converting to natural gas fuel to realize the cost savings and participate in programs that reward cleaner air quality through reduced emissions. Each commercial waste truck that is converted to natural gas from diesel has a comparable impact to removing 325 cars from the road. Currently the costs of natural gas-fueled vehicles are slightly higher (10-15%) than conventionally-fueled vehicles. However, as the costs of fossil fuels rise, and more CNG vehicles are manufactured, the costs are likely to become very similar.


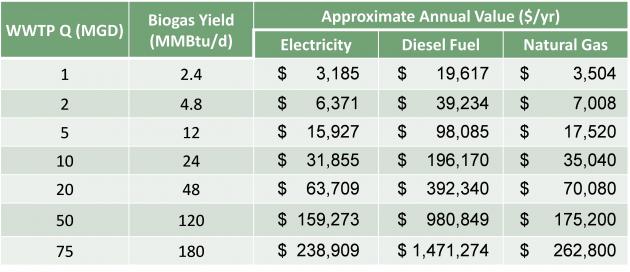
****An explanation of the table below would be useful.. You should use this document to outline how you conducted the study and what you found, most of the information contained is introductory in nature.

Table 1.

Table 2.Future Plans    

Unlike fossil fuels, which are finite in quantity, bioenergy and biogas systems convert the organic wastes that are generated each day into fuel; often in only a few days’ time. In this regard, bioenergy systems offer a truly infinite resource for renewable energy, while providing the added benefit of pollution reduction and additional revenues to support existing wastewater treatment infrastructure systems.

Author

Gus Simmons, Director of Bioenergy, Cavanaugh & Associates, P.A. gus.simmons@cavanaughsolutions.com

Additional information

www.cavanaughsolutions.com

1-877-557-8924

Acknowledgements      

Clean Water Needs Survey, 2008

Loyd Ray Farms, Yadkinville, NC

Duke University Carbon Offsets Initiative

The authors are solely responsible for the content of these proceedings. The technical information does not necessarily reflect the official position of the sponsoring agencies or institutions represented by planning committee members, and inclusion and distribution herein does not constitute an endorsement of views expressed by the same. Printed materials included herein are not refereed publications. Citations should appear as follows. EXAMPLE: Authors. 2015. Title of presentation. Waste to Worth: Spreading Science and Solutions. Seattle, WA. March 31-April 3, 2015. URL of this page. Accessed on: today’s date.


Removing Phosphorus from Drainage Water: The Phosphorus Removal Structure

Purpose

To illustrate a case study design and construction of a phosphorus removal structure on a poultry farm, and to present the basics of how to properly design a structure.

What did we do?

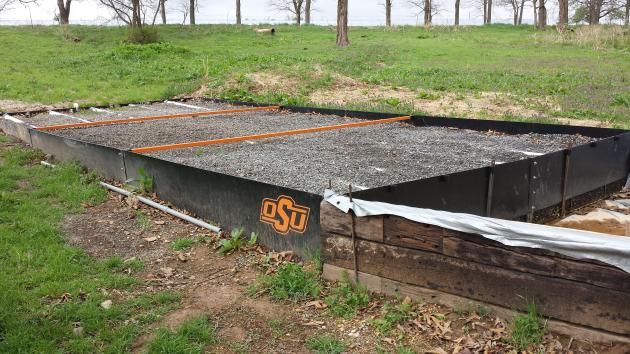
We constructed a phosphorus (P) removal structure on a poultry farm in Eastern OK; this is a BMP that can remove dissolved P loading in the short term until soil legacy P concentrations decrease below levels of environmental concern. A P removal structure contains P sorbing materials (PSMs) and are placed in a location to intercept runoff or subsurface drainage with high dissolved P concentrations. As high P water flows through the PSMs, dissolved P is sorbed onto the materials by several potential mechanisms, allowing low P water to exit the structure. While they vary in form, P removal structures contain three main elements: 1) use of a filter material that has a high affinity for P, 2) containment of the material, and 3) the ability to remove that material and replace it after it becomes saturated with P and is no longer effective.

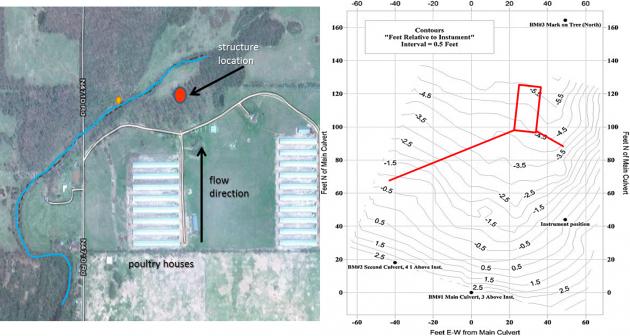
A site was identified which met all criteria for justification of construction of a P removal structure: 1) elevated dissolved P concentrations in runoff (>0.2 ppm), 2) hydraulic connectivity between the runoff/drainage produced and a surface water body, and 3) flow convergence: the site possessed potential to channel the runoff water to a single point in order to treat the water. This site was located on a poultry farm in Eastern OK.
The site was surveyed in order to obtain the necessary inputs for properly designing the P removal structure. This involved a basic NRCS survey to estimate watershed size, peak flow rates, and average annual runoff volume. In addition, several runoff grab samples were taken and analyzed for dissolved P. This information was used to determine the average annual dissolved P load, which was 45 lbs.

Knowing flow and P load parameters, we additionally chose P removal targets and desired lifetime of the structure. We chose to design a structure that would remove 20 lbs of dissolved P during the first year and be able to handle 700arial site view and map gpm flow rate. Several hypothetical designs were made based on the available P sorbing materials (PSMs), such as drinking water treatment residuals, acid mine residuals, and gypsum. We chose to use a treated steel slag material as the PSM in the structure; this required about 35 tons of material.
After construction, the performance of the structure was monitored by measuring flow rates and dissolved P concentrations at the inlet and outlet. In addition, we developed software to aid in proper design of a site specific P removal structure using any PSM, in order to meet desired P removal goals and lifetime. Alternatively, this software can be used to predict the performance and lifetime of a P removal structure that has been already constructed. Licensing of software is available for private industry.

completed p removal structureWe constructed a P removal structure on a poultry farm in Eastern OK; this is a BMP that can remove dissolved P loading in the short term until soil legacy P concentrations decrease below levels of environmental concern. A P removal structure contains P sorbing materials (PSMs) and are placed in a location to intercept runoff or subsurface drainage with high dissolved P concentrations. As high P water flows through the PSMs, dissolved P is sorbed onto the materials by several potential mechanisms, allowing low P water to exit the structure. While they vary in form, P removal structures contain three main elements: 1) use of a filter material that has a high affinity for P, 2) containment of the material, and 3) the ability to remove that material and replace it after it becomes saturated with P and is no longer effective.
A site was identified which met all criteria for justification of construction of a P removal structure: 1) elevated dissolved P concentrations in runoff (>0.2 ppm), 2) hydraulic connectivity between the runoff/drainage produced and a surface water body, and 3) flow convergence: the site possessed potential to channel the runoff water to a single point in order to treat the water. This site was located on a poultry farm in Eastern OK.

The site was surveyed in order to obtain the necessary inputs for properly designing the P removal structure. This involved a basic NRCS survey to estimate watershed size, peak flow rates, and average annual runoff volume. In addition, several runoff grab samples were taken and analyzed for dissolved P. This information was used to determine the average annual dissolved P load, which was 45 lbs.

Knowing flow and P load parameters, we additionally chose P removal targets and desired lifetime of the structure. We chose to design a structure that would remove 20 lbs of dissolved P during the first year and be able to handle 700 gpm flow rate. Several hypothetical designs were made based on the available P sorbing materials (PSMs), such as drinking water treatment residuals, acid mine residuals, and gypsum. We chose to use a treated steel slag material as the PSM in the structure; this required about 35 tons of material.

After construction, the performance of the structure was monitored by measuring flow rates and dissolved P concentrations at the inlet and outlet. In addition, we developed software to aid in proper design of a site specific P removal structure using any PSM, in order to meet desired P removal goals and lifetime. Alternatively, this software can be used to predict the performance and lifetime of a P removal structure that has been already constructed. Licensing of software is available for private industry.

What have we learned?

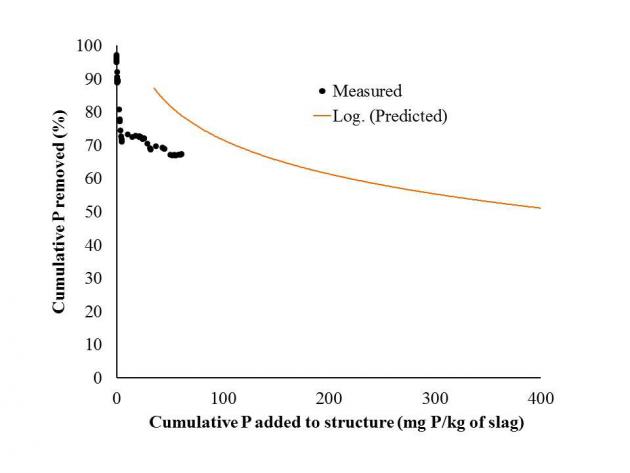
p removal performanceThe P removal structure has removed approximately 67% of all dissolved P that has flowed into it over a 16-month time period. In addition, it has handled all flow volume from every event, including a runoff event that resulted in 600 gpm. That single event delivered 2/3 lb of dissolved P, in which the structure removed 66%. While the structure is removing P as predicted based on P loading, the structure has greatly outlasted the goal of removing 45% of cumulative dissolved P in one year. This is due to the below average rainfall received over the last two years.

We also learned about the potential positives and negatives of using certain PSMs. For example, although we could have used other PSMs, in much smaller quantities (2-10 tons) that would remove equal amounts of P, we would have had to build a structure that was much larger in surface area, due to the fact that the hydraulic conductivity of these PSMs is relatively low. It is also possible to build these structures with other materials for the frame, such as concrete, earth, or wood. Structures can be constructed in ditches or potentially in the subsurface to treat tile drainage.

Last, we have some sense of economics for P removal structures and the general cost of P removal compared to other BMPs.

Future Plans

phrog design softwareWe will continue to monitor the structure. In addition, we are cooperating with several people throughout the US in helping to design P removal structures. We are also releasing design software for licensing in an attempt to promote commercialization of this BMP through private industry. A NRCS standard is currently underway and the goal is for this BMP to become cost-shared. Last, we are continuing to investigate the economics of P removal structure over a large scale area.

Authors

Chad Penn, Associate professor of agricultural and environmental chemistry, Oklahoma State University chad.penn@okstate.edu

Josh Payne, Animal waste specialist, Oklahoma State University; James Bowen, graduate assistant; Stuart Wilson, senior research specialist, Oklahoma State University; Josh McGrath, associate professor of nutrient management, University of Kentucky

Additional information

Chad Penn; chad.penn@okstate.edu; 405 744 2746

www.p-structure.blogspot.com

http://www.jswconline.org/content/69/2/51A.full.pdf

http://pods.dasnr.okstate.edu/docushare/dsweb/Get/Document-9345/L-447%20Phosphorus%20Removal.pdf

Acknowledgements

NRCS for funding of this demonstration

The authors are solely responsible for the content of these proceedings. The technical information does not necessarily reflect the official position of the sponsoring agencies or institutions represented by planning committee members, and inclusion and distribution herein does not constitute an endorsement of views expressed by the same. Printed materials included herein are not refereed publications. Citations should appear as follows. EXAMPLE: Authors. 2015. Title of presentation. Waste to Worth: Spreading Science and Solutions. Seattle, WA. March 31-April 3, 2015. URL of this page. Accessed on: today’s date.

University and Anaerobic Digestion Industry Partnerships – Laboratory Testing

The anaerobic digestion (AD) industry often is in need of laboratory testing to assist them with issues related to project development, digester performance and operation, and co-digestion incorporation. This presentation will highlight laboratory procedures that can be carried out through a University partnership, including biochemical methane productivity (BMP), specific methane activity assays (SMA), anaerobic toxicity assays (ATA), solids, nutrient and elemental proximate analysis for inputs, outputs and co-products, as well as a host of other activities. The presentation will illustrate the lessons that can be learned from the results of these tests, using real-life examples of testing already completed for industry partners.

Why Provide Guidance on Laboratory Testing for Anaerobic Digestion?

Laboratory testing allows characterization of anaerobic digestion (AD) inputs, outputs, and process stability. Testing can be carried out within AD industry laboratories, and they can also be carried out through partnerships with active AD research laboratories at academic institutions. The purpose of this project was to provide a document that summarizes common laboratory procedures that are used to evaluate AD influents, effluents, and process stability and to illustrate real-life examples of laboratory test results.

What did we do? 

The overview of common laboratory procedures was written based on the need to introduce third-party AD developers and government agencies to evaluating AD outputs and process stability. The authors are practiced at performing AD laboratory tests and have expertise and valuable information concerning these types of evaluations. Following a description of each test, we included the purpose of the test and an example of how the test results can be interpreted.

What have we learned? 

Laboratory testing of AD samples is performed to determine the concentration of certain constituents such as organic carbon, volatile fatty acids, ammonia-N, organic-N, phosphorus, and methane. Contaminants can be tested for such as fecal coliform indicator pathogens, pesticides, and pharmaceuticals. Understanding the concentration of specific constituents enables informed decisions to be made about appropriate effluent management.

Biochemical methane potential (BMP) and specific methanogenic activity (SMA) tests are used to estimate the biogas and methane that can be produced from an organic waste or wastewater during AD. These tests are often used by industry during the design phase to predict total biogas output, allowing for correct sizing of engines and estimation of potential revenue.

Anaerobic toxicity assays (ATAs) test the effect of different materials on biogas production. Unknown inhibitors may reside within new feedstock materials which can lead to an unanticipated reduction in digester performance, so it is important to use ATAs to test the effect of new feedstock material on the AD system before it is used. A common example is when energy-rich organic materials are added to a digester that practices co-digestion.

Future Plans 

Future plans are to prepare an extension fact sheet about the basics of anaerobic digestion effluents and processes, including the overview of common laboratory testing used to evaluate AD influents, effluents, and process stability.

Authors

Shannon Mitchell, Post-doctoral Research Associate at Washington State University shannon.mitchell@email.wsu.edu

Jingwei Ma, Post-doctoral Research Associate at Washington State University

Liang Yu, Post-doctoral Research Associate at Washington State University

Quanbao Zhao, Post-doctoral Research Associate at Washington State University

Craig Frear, Assistant Professor at Washington State University

Additional information 

Craig Frear, PhD

Assistant Professor

Center for Sustaining Agriculture and Natural Resources

Department of Biological Systems Engineering

Washington State University

PO Box 646120

Pullman WA 99164-6120

208-413-1180 (cell)

509-335-0194 (office)

cfrear@wsu.edu

www.csanr.wsu.edu

Acknowledgements

This research was supported by funding from USDA National Institute of Food and Agriculture, Contract #2012-6800219814; and by Biomass Research Funds from the WSU Agricultural Research Center.

The authors are solely responsible for the content of these proceedings. The technical information does not necessarily reflect the official position of the sponsoring agencies or institutions represented by planning committee members, and inclusion and distribution herein does not constitute an endorsement of views expressed by the same. Printed materials included herein are not refereed publications. Citations should appear as follows. EXAMPLE: Authors. 2015. Title of presentation. Waste to Worth: Spreading Science and Solutions. Seattle, WA. March 31-April 3, 2015. URL of this page. Accessed on: today’s date.