
Digested Solids – Forms, Markets and Trends


Are Digested Solids a Viable Product?

Anaerobic digesters for U.S. livestock operations are becoming more complex. A study of livestock-based digesters in 2003 found they were built largely to meet on-farm needs for power or gas. Digester residuals were mostly land applied as nutrients for crop production. A few used fibrous solids as animal bedding (King, 2003). In recent years, more livestock-based digester projects have been built by third-party developer/managers. Projects increasingly employ a systems approach, where individual product streams are managed in concert for greatest profit by the project manager. This approach holds the promise that digestate residuals, especially fiber solids, will no longer be neglected, but instead play a larger role in offsetting weak performance in energy revenues.

What did we do?

Looking closely at dairy-based digesters, the solids recovered after separation from the digester eflluent have unique characteristics. Most notably, these solids tend to be fibrous with high cellulose, hemicellulose, and lignin content. Digestion also reduces pathogenic contaminants, volatile solids, odor, and viable weed seeds (MacConnell, 2010). These qualities can be influenced by the makeup of an animal’s feed and the use of co-digestion feedstocks, such as municipal or industrial wastes or other agricultural manures or byproducts

Table 1 shows the characteristics of dairy AD solids compared to raw manure and raw separated solids (MacConnell, 2010).

Table 1. Fiber Characteristics

Table 1.

As is. In bulk. Sold to a wholesale buyer—this is the easiest way to sell digested dairy fiber. Through a combination of literature search and expert interviews, this presentation looks at the methods project managers might use to add more value to their digested fiber.

What have we learned?

Composting. Perhaps the most basic way to add value to digested dairy fiber is simply to apply basic compost processing methods—aerating the material under controlled conditions for sufficient time to reduce odor and stabilize the organic matter. While already low in pathogens, hot composting practices can give additional assurance of pathogen reduction. In co-digestion situations, screening the material to remove contaminants and assure consistency and uniformity is desired. Even wholesale buyers will pay more for material that is already composted (King 2003)

Processing to compete – replacing peat. Because of its physical similarity, researchers have explored using digested dairy fiber as a direct replacement for peat moss in nursery and horticulture mixes. WSU was an early source of research and growth trials on such uses. Their research showed that with minimal post-digestion treatment, amended digested dairy fiber performed as well or better than peat in soilless mixes. (MacConnell, 2007, and Kruger, 2008) In 2007, Organix, a Washington company, announced the first shipments of RePeat, using their patent-pending FibreRite production system. Since then several new varieties of these peat replacements have hit the market nationwide, under such brands as Magic Dirt, EnerGro, and MooFiber.

Organic certification. Organic gardening and food production is growing rapidly in Washington state and around the nation. Getting an organic certification for organic matter and nutrients that have been digested and composted will add significant value to the final product (King, 2003).

Branding and marketing for retail. Moving away from bulk and wholesale are the next steps in moving material up the value chain. However, putting product in bags and selling into retail markets requires significant investments in packaging, branding, marketing and sales. This is like adding an additional business onto the back end of a digester project and demands its own feasibility analysis.

Vermicomposting. Using earthworms, especially redworms, to further process fiber solids and excrete earthworm castings, produces another specialty soil product. Vermicomposts and earthworm castings are well-known and appreciated in some growers in some markets. They are often used as a small additive in specialty soil mixes to allow the use of “earthworm castings” on the list of ingredients. Two commercial examples of vermicompost production lie on opposite coasts—Sonoma Valley Worm Farm in California and Worm Power in New York. Sonoma Valley Worm Farm direct markets high-quality vermicompost to a variety of growers throughout their region, with special emphasis on vineyards. Worm Power topped 2 million pounds of production in 2012 and signed an agreement with Rochester, NY-based Harris Seeds to market its vermicompost products regionally.

Specialty products produced from the separated fiber materials are another area of interest. Perhaps the best known of such products are the biodegradable planting nursery pots sold as Cow Pots by the Fruend Dairy Farm in Connecticut.

Biochar. This is another specialty product from a fledgling industry that fits in niche markets. It could be used to process digested fiber. It has received a strong research focus in the Pacific Northwest. The value of biochar in landscape or agricultural uses is still being studied, though at present it appears to have less to do with agronomic benefit, than on measured benefits for carbon sequestration and the value given to these benefits through carbon credits or other mechanisms (Galinato, 2011). On the other hand, replacing biochar for conventional forms of activated carbon for filtering stormwater or wastewaters shows some promising results and is getting a lot of attention.

Future Plans      

We will continue to evaluate methods to add value and publish the full results in a Anaerobic Digestion technology brief on this topic.

Authors        

Jim Jensen, Sr. Bioenergy & Alt Fuel Specialist, Washington State University Energy Program jensenj@energy.wsu.edu

Craig Frear, Chad Kruger, and Georgine Yorgey, Center for Sustaining Agriculture and Natural Resources, Washington State University

Additional information  

References:

Galinato, S., Yoder, J., Granatstein, D., 2011. The economic value of biochar in crop production. Energy Policy.

King, 2003. Study to Evaluate the Price and Markets for Residual Solids from a Dairy Cow Manure Anaerobic Digester—Final Report, King County Solid Waste, Seattle, WA.

Kruger, Chad, et.al., 2008. High-quality fiber and fertilizer as co-products from anaerobic digestion. Journal of Soil and Water Conservation.

MacConnell, C.B., Collins, H.P., 2007. Utilization of re-processed anaerobically digested fiber from dairy manure as a container media substrate. Proceedings of the International Symposium on Growing Media, Nottingham, UK.

MacConnell, C., Frear, C., Liao W., 2010. Pretreatment of AD-treated fibrous solids for value-added container media market, Center for Sustaining Agriculture and Natural Resources, Pullman, WA.

Acknowledgements      

This research was supported by funding from USDA National Institute of Food and Agriculture, Contract #2012-6800219814; Biomass Research Funds from the Washington State University Agricultural Research Center; and the Washington State Department of Ecology, Waste 2 Resources Program.

The authors are solely responsible for the content of these proceedings. The technical information does not necessarily reflect the official position of the sponsoring agencies or institutions represented by planning committee members, and inclusion and distribution herein does not constitute an endorsement of views expressed by the same. Printed materials included herein are not refereed publications. Citations should appear as follows. EXAMPLE: Authors. 2015. Title of presentation. Waste to Worth: Spreading Science and Solutions. Seattle, WA. March 31-April 3, 2015. URL of this page. Accessed on: today’s date.
 

Using Solar Power to Provide Animals with Water while Protecting Water Quality


Why Consider Solar Power for Watering Livestock?

The purpose of this paper and presentation is to show how we have been using solar powered watering stations to provide a clean water supply to livestock while also protecting water resources. The project was started as a way to assist farmers who had received funding from some federal or state agencies to improve water quality on and through their land. One way to improve water quality is to fence livestock out of local waterbodies. As a result of this practice, the farmer may lose the ability to water his/her livestock.  A secondary reason for the project was, since livestock did not have direct access to water, the farmer had to either carry water to the watering stations or use some form of energy (diesel, gasoline, electric) to provided needed water.

What did we do?

To help solve the problem, funding was received from USDA-NRCS through the Conservation Innovation Grant Program (CIG) to install solar powered livestock watering stations. Farmers were selected based on information from NRCs field personnel, County Extension Agents and other groups working with farmers to fence livestock out of the waterbodies. The first steps were to visit with the farmers to determine need for a solar powered watering station.

Through a first set of questions, it was determined: 1) if the farmer needed the watering station; 2) where the watering station would be located; 3) was there an existing well and pump and what was the source of energy?;  4) what would be the preferred energy source based on available electricity; and 5) would there be a solar system that could be designed to meet the need of the farmer (an initial design).

To further discuss these steps, we looked to see if the farmer needed the watering station. Was there was a means to put in a limited access watering spot so water was still available on a limited basis and still help with protecting water quality? The location of the watering station was determined based on plans to rotationally graze the pasture where the livestock would be located. If the livestock were to be rotated through a number of different paddocks, the suggestion would be to locate the watering station in the center of a rotation. Alternatively, could a solar powered pumping system be located in one place and pump water to various watering stations on the property? The third aspect of the initial planning process was to determine if there was an existing well or pump. If there was an existing well and pump, what was the source of power for the pump? If diesel or gasoline was being used, what was the cost of such a system on an annual basis? The next aspect asked if there was available electric power for a pump? If the answer was “Yes, there is power less than one-quarter mile” then it was suggested the farmer consult with the local power utility to determine the cost of running power to the proposed pumping location. Another aspect of this step in the process was where would the water source be and would solar even be viable due to shade or tree cover? The last aspect of the determination of using solar power was the ability of us to design a system based on the number of livestock that had or needed to be watered and the depth of the well (if currently in place), expected depth to groundwater, height from a surface water source to highest and most distant watering station, and distance of having to run pipe from water source to most distant watering station. If after going through all of these aspects with the farmer, it was determined that a solar powered watering system was a good option for the farmer, we worked with him or her to fully design a solar powered watering system, ordered the solar components and helped the farmer install the system.

What have we learned?

From this project we have learned that there are some locations that are not good for a solar powered watering systems due to location, distance to available power and economics. Most of the times when the system was determined to be non-economical, it was due to there being electric power within a short distance of the proposed solar installation site. Short distance here is defined as any distance that makes running electricity to the proposed water source location economically preferable to that of installing solar power. Sometimes location was not a good fit in that there was very little open space to install a solar powered system for pumping the water. Another thing we have learned is that the solar powered system needs to be protected or at least in a location where livestock cannot get to the panels and control boxes. In cases where small livestock are being watered, having the solar panels on poles above their height can be beneficial in providing maintenance for grass control. However, for larger livestock, the support structure and solar panels themselves can become scratching posts which can result in broken solar panels. One other thing we have learned is that based on the needs or direction of the local NRCS working groups, solar powered watering systems may or may not be included in the cost share options for farmers.

Future Plans  

Future plans are to work with County Extension Agents, NRCS, farmers and other groups promoting the use of solar powered systems for watering livestock in areas where this technology can protect water quality.

Author     

Gary L. Hawkins, Water Resource Management and policy Specialist and Assistant Professor, University of Georgia, Crop and Soil Science ghawkins@uga.edu

Additional information                

For more information please contact ghawkins@uga.edu

Sun-powered water source. Angus Journal. July 2013. Anderson, B.B.

Acknowledgements     

Thanks to Mr. Gary Murphy for his assistance in installing and demonstrating the solar system in many different venues. Thanks also is extended to USDA-NRCS for funding the projects through the CIG program.

The authors are solely responsible for the content of these proceedings. The technical information does not necessarily reflect the official position of the sponsoring agencies or institutions represented by planning committee members, and inclusion and distribution herein does not constitute an endorsement of views expressed by the same. Printed materials included herein are not refereed publications. Citations should appear as follows. EXAMPLE: Authors. 2015. Title of presentation. Waste to Worth: Spreading Science and Solutions. Seattle, WA. March 31-April 3, 2015. URL of this page. Accessed on: today’s date.
Food Waste and Food Processing Waste for Renewable Energy Production


Purpose *          

This high efficient and low-cost eggshell catalyst could make the process of biodiesel production economic and fully ecologically friendly. The ecologically friendly and economic process could effectively reduce the processing cost of biodiesel, making it competitive with petroleum diesel.

What did we do? 

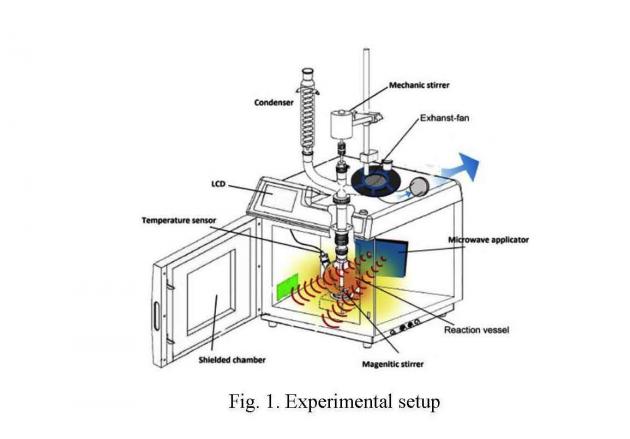
The acid value of Jatropha oil was more than 2 mg of KOH g-1. The methanol, sodium hydroxide (NaOH), and sodium methoxide (CH3-ONa) were high-performance liquid chromatography (HPLC) grade. The experimental setup is shown in Fig. 1.

Fig. 1. Experimental setup

A microwave synthesis reactor (NN-S235, Panasonic Co., Ltd., Taiwan), equipped with a mechanical stirrer and a condenser (LC-10, Hi-point Co., Ltd, Taiwan) was used for microwave reactions. The stirrer was operated at 600 rpm with a magnetic nucleus. Various catalysts (CH3ONa and NaOH), reaction times (1–6 min), methanol to oil molar ratios (3–15), and reaction powers (200–750 W) were tested. The analytic method of methyl ester content in this study followed Taiwan CNS15051 (Chinese National Standards). A GC (gas chromatography; GC-6890, Agilent, USA) system equipped with a FID (flame ionization detector) was used to determine methyl ester content.

What have we learned? 

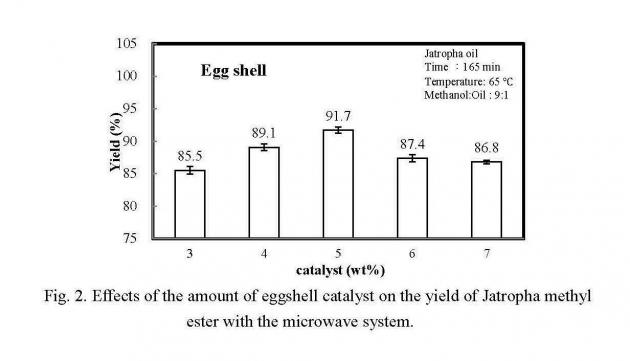
Experiments were carried out using different catalysts in order to investigate their influence on the methyl ester yield. The microwave system was operated with a reaction time of 165 min, microwave power of 750 W, and methanol to oil molar ratio of 9. eggshell and oystershell were used as the catalysts. The fractions of the catalysts were 3, 4, 5, 6, and 7 wt%.

Fig. 2. Effects of the amount of eggshell catalyst on the yield of Jatropha methyl ester with the microwave system

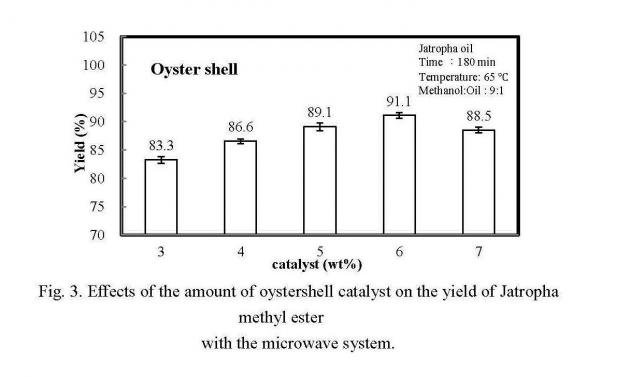
As shown in Fig. 2, the yields of methyl ester were 85.5%, 89.1%, 91.7%, 87.4%, and 86.8% for 3, 4, 5, 6, and 7 wt% eggshell catalysts, respectively. The best performances were with 5 wt% eggshell catalysts. Comparing the eggshell as catalyst, operational condition addition of 6 wt% oystershell catalysts as shown in Fig. 3, the reaction time was 180 min, reaction temperature was 65 ℃, and the methanol-to-oil ratio was 9:1.

Fig. 3. Effects of the amount of oystershell catalyst on the yield of Jatropha methyl ester with the microwave system.

The results indicated that the catalysts derived from eggshells showed yield better than oystershell for biodiesel production.These results indicate that although excess catalyst might increase the biodiesel yield, the amount of glycerin also increased due to saponification, causing a reduction in biodiesel yields.

Future Plans 

High active, reusable solid catalyst was obtained by just calcining eggshell and oytershell. Calcined eggshell and oytershell exhibited high activity towards the transesterification of jatropha oil with methanol to produce biodiesel. The method of reusing eggshell waste and oystershell to prepare catalyst could recycle the waste, minimizing contaminants, reducing the cost of catalyst, and making the catalyst environmentally friendly. This high efficient and low-cost eggshell catalyst could make the process of biodiesel production economic and fully ecologically friendly. Future, the ecologically friendly and economic process could effectively reduce the processing cost of biodiesel, making it competitive with petroleum diesel.

Authors   

Yuan-Chung Lin, Prof. at Inst. Environ. Eng., National Sun Yat-Sen University. Taiwan Deputy Executive Officer at Environ. Protec. & Safety Center yuanchung.lin@gmail.com

Syu-Ruei Jhang1, Yuan-Chung Lin*, Chin-En Chen, Po-Ming Yang, Shang-Cyuan Chen, I-Wei Wang

Additional information                

Yuan-Chung (Oliver) Lin Ph.D.

Prof. at Inst. Environ. Eng., National Sun Yat-Sen University. Taiwan

Deputy Executive Officer at Environ. Protec. & Safety Center

TEL: +886-7-5252000 ext 4412

+886-7-5254412

FAX: +886-7-5254412

Cell: +886-935795228

yclin@faculty.nsysu.edu.tw

yuanchung.lin@gmail.com

The authors are solely responsible for the content of these proceedings. The technical information does not necessarily reflect the official position of the sponsoring agencies or institutions represented by planning committee members, and inclusion and distribution herein does not constitute an endorsement of views expressed by the same. Printed materials included herein are not refereed publications. Citations should appear as follows. EXAMPLE: Authors. 2015. Title of presentation. Waste to Worth: Spreading Science and Solutions. Seattle, WA. March 31-April 3, 2015. URL of this page. Accessed on: today’s date.


An NE-1441 Project: Proposed Methodologies for Administering a Multi-State Environmental Best Management Practices Survey of Equine Properties


*Purpose 

Several states have reported that equine are the fastest growing segment of the livestock industry. Nationwide, equine has increased by 77% since 1997; and it is reported there are approximately 9.5 million horses in the United States (AHC, 2005). Proper management of equine operations requires the adoption of Best Management Practices (BMPs) to balance nutrient production and prevent erosion. Government agencies are concerned about non-point sources of water pollution and have focused on agriculture, including equine operations, as a major contributor to water quality issues. Many states’ laws have regulated equine farms, requiring farm managers to incorporate BMPs. The objectives of this proposed national (multi-state) survey are to quantify and assess the use of the equine industry’s BMPs in pasture management, erosion control and to examine potential environmental impacts. Few state studies have investigated horse BMPs in the U.S, and more research is needed to assess the effect of horse farm management on U.S. water quality. Knowledge of the current scope and nature of equine industry management practices are important when developing regulations, laws, and educational programs to enhance the stewardship and govern land management on equine operations.

What did we do? 

The methodology to assess horse property manager/owner practices consists of gathering a minimum of 150-2,000 names and email addresses of horse owners/farm managers from the 15 states involved in the NE-1441 project. Some of the N. E. states have fewer equine operations. An email containing survey information and a link to the 40 question online survey will be sent to horse farm managers in 2016. Three follow-up reminders will be sent to non-responding addresses. It is hoped to have a 40% response rate. Data will analyzed using SPSS 16.0 (SPSS Inc., Chicago, IL) for descriptive statistics, determining response frequencies and percentages.

The Questionnaire Instrument will include the following areas:

Part I General: Involved in the horse industry? Are you the owner or manager of a horse operation? If No, then you are finished taking the survey. Business or Hobby?

Part II Demographics: Location, State, County, Survey participants gender, age, Size of farm total acreage, Confinement areas, Pasture areas, primary and 2nd use of operation, Highest average number of horses on property? On average, how many hours per day do your horses spend grazing pastures by seasons?

Part III Horse Pasture Management Rotational Grazing, unlimited access,Pasture Management Plan, Agricultural Erosion and Sedimentation Plan weed control and type, mowing, resting pastures,Sacrifice lots, pasture topography, surface water, Sheds and barns,divert runoff, roof gutters.

Part IV: Horse Pasture Applications and/or Evaluation: Line, Fertilizer, Herbicide use, Seeding practices, Lime, Soil testing.

Part V: Horse Manure Management: Nutrient Management Plan, primary manure management, collection, storage, uses, removal.

Part VI: Conclusion: What are your limitations in altering the management of your horse operation? What information resources do you use for your equine farm operations?

What have we learned? 

The questions for an equine related APHIS/USDA animal agriculture survey need to be more specific to the activities and needs of the horse industry. Whereas most animal agriculture operations do not deal directly with the general public as a necessary component of their business plan, the horse industry depends on active and engaged clientele. If we are able to gather national data through a single effort survey, the resulting information could be compared and sorted in a consistent and statistically reliable manner, allowing educational materials and opportunities to be tailored to area or regional needs.

Future Plans 

A survey will be conducted by the NE-1441 (a northeast regional Hatch research group focusing on environmental impacts of equine operations) participating states to determine the use of the following best management practices: managed storage area, composted manure storage, stream crossings, buffers and vegetative filter strips, heavy use pads and sacrifice areas, soil testing, and fertility management on fields receiving manure. Develop means of determining the impact of equine outreach programs, more specifically determination of BMP adoption rate.This will allow us to chart progress among producers who use extension services and/or implement BMPs with the assistance of extension or other service providers such as NRCS, state departments of agriculture, and etc. We will work with social scientists to determine adoption rates, what the reasons for resistance to adoption are, and how to develop programs to overcome this resistance.

Corresponding author, title, and affiliation 

Betsy Greene, Professor/Equine Extension Specialist, University of Vermont

Corresponding author email 

betsy.greene@uvm.edu

Other authors

Ann Swinker, Extension, Pennsylvania State University Amy Burk, Extension, University of Maryland Rebecca Bott, Extension, South Dakota State University Carey Williams, Extension, Rutgers, State University of New Jersey

Additional information 

Westendorf, M. L., T. Joshua, S. J. Komar, C. Williams, and R. Govindasamy. 2010. Manure Management Practices on New Jersey Equine Farms. Prof. Anim. Sci. 26:123-129.

Swinker, A., S. Worobey, H. McKernan, R. Meinen, D. Kniffen, D. Foulk, M. Hall, J. Weld, F. Schneider, A. Burk, M. Brubaker, 2013, Profile of the Equine Industry’s Environmental, Best Management Practices and Variations in Pennsylvania, J. of NACAA. 6:1, 2158-9429.

Fiorellino, N.M., K.M. Wilson, and A.O. Burk. 2013. Characterizing the use of environmentally friendly pasture management practices by horse farm operators in Maryland. J. Soil Water Conserv. 68:34-40.

Acknowledgements

The State University Extension Equine Specialists that make up the NE-1441: Environmental Impacts of Equine Operations, Multi-State Program. USDA.

The authors are solely responsible for the content of these proceedings. The technical information does not necessarily reflect the official position of the sponsoring agencies or institutions represented by planning committee members, and inclusion and distribution herein does not constitute an endorsement of views expressed by the same. Printed materials included herein are not refereed publications. Citations should appear as follows. EXAMPLE: Authors. 2015. Title of presentation. Waste to Worth: Spreading Science and Solutions. Seattle, WA. March 31-April 3, 2015. URL of this page. Accessed on: today’s date.
Analysis of total Carbon, Nitrogen, and Phosphorus Contents in Soil Cores Over 10+ Years from Horicon Marsh in Dodge County, Wisconsin


Why Look at Marsh Soil Nutrients?

The purpose of this project was to evaluate changes in carbon (C), nitrogen (N), and phosphorus (P) in samples from identical locations taken ten years apart from Horicon Marsh in Dodge County, Wisconsin.

The area surrounding the marsh is primarily agricultural and has the potential to contribute nutrients to the marsh, affecting the fertility of the soils and changing the ecosystem.

What did we do?  

We hypothesized that carbon, nitrogen, and phosphorus would show significant increases over the ten-year interval between samplings.

Sample sites were positioned every ¼ mile along east-west transects throughout the marsh. A soil core was obtained at each sample site in the winter of either 2002 or 2003. The same sites were revisited and new samples collected in winter of either 2012 or 2013, ten years after the initial visits. The top five centimeters of each soil core were oven dried at 105°C for 72 hours.

Total carbon and nitrogen were analyzed by combustion using a PerkinElmer 2400 series II CHNS/O Analyzer. Total phosphorus was analyzed by the Olsen P-extraction method on a QuikChem FIA+ 8000 series Lachat analyzer.

A paired t-test (α=0.05) was used to compare nitrogen and phosphorus values. Carbon data were compared with a Mann-Whitney ranked sum test at the 95% confidence interval.

What have we learned?  

Carbon and nitrogen did not increase significantly over the time period. Carbon is generally bound in soil organic matter; in histic wetland soils, changes attributable to land use might be difficult to detect due to the already high organic matter content. Nitrogen accumulation was likely mitigated by denitrification processes.

Phosphorus concentrations were greater in the second set of samples. Phosphorus adsorbs tightly to sediment and organic material, which would prevent its removal by flowing water. Changes in land use, especially row crop agriculture in the Horicon marsh area, could contribute runoff inputs of soil particles carrying phosphorus with them. This may explain significantly increased phosphorus levels between the start and end of the study period.

Future Plans  

Future studies might quantify land use changes, their extent, and their impacts on the marsh ecosystem; analyze spatial patterns of phosphorus accretion to determine if it is cycling equally throughout the marsh; and determine the impact of denitrifying bacteria and anaerobic conditions on nitrogen accumulation. Additional research could include testing the water column of the marsh for dissolved nutrients; and sampling the Rock River at its inlet to and outlet from the Horicon Marsh to determine nutrient flux to the stream from the marsh.

Authors

Ashley Hansen, University of Wisconsin-Stevens Point ashleyhansen891@gmail.com

Anna Radke, University of Wisconsin-Stevens Point; Sarah Shawver, University of Wisconsin-Stevens Point

Additional information

Ashley Hansen, ahans891@uwsp.edu; Anna Radke, aradk591@uwsp.edu; Sarah Shawver, sshaw497@uwsp.edu

Acknowledgements

Dr. Robert Michitsch

Soils Professor and Research Advisor

Dr. Kyle Herrman

Water Resource Professor and Research Advisor

The authors are solely responsible for the content of these proceedings. The technical information does not necessarily reflect the official position of the sponsoring agencies or institutions represented by planning committee members, and inclusion and distribution herein does not constitute an endorsement of views expressed by the same. Printed materials included herein are not refereed publications. Citations should appear as follows. EXAMPLE: Authors. 2015. Title of presentation. Waste to Worth: Spreading Science and Solutions. Seattle, WA. March 31-April 3, 2015. URL of this page. Accessed on: today’s date.

Evaporation Ponds – Waste Storage Facility Design Spreadsheet

Purpose

An assessment tool was developed to simplify the process of determining minimum waste storage pond (WSP) dimensions in conjunction with assuring adequate evaporation of stored runoff over time. In contrast to typical WSP designs that require intermittent pumping and handling of waste water, evaporation ponds (EPs), as waste storage facilities used to contain storm runoff from feedlots, offer long-term passive management and may be acceptable alternatives where annual evaporation exceeds rainfall and where landowners deem typical WSP designs as impractical.

What did we do?

EPs are passive management structures that allow landowners to avoid having to periodically evacuate accumulated water from typical WSPs via pumping or other means (active management). Both EP and WSP systems are designed to collect and store contaminated runoff and sediment from feedlots, but it is assumed that the use or disposal of the contaminated water is practical in the case of WSPs. It is not always practical. Some ranchers operating in arid areas who manage small feedlots during the winter have expressed interest in EPs over WSPs stating that the passive management method will keep their costs low while fitting better with their current operating systems.

At the onset of our first EP project, we found no NRCS tool specific to the design of EPs. The principles outlined in our Agricultural Waste Management Handbook (United States Department of Agriculture, NRCS, 1999) regarding waste storage facility design and our guidance for runoff produced during a 25-year, 24-hour precipitation event using the NRCS Curve Number Method (United States Department of Agriculture, NRCS, 2004) still apply. Next, we chose to build a spreadsheet that allows the designer to perform the multitude of computations needed to consider distinct EP geometric configurations, time periods, and hydrology in the design of EPs. In a nutshell, the model consists of estimating amounts of water and sediment that the EP retains while accounting for water losses due to evaporation and any periodic removal of sediment (Figure 1) over time. For any given EP geometry, the design is considered viable so long as the water level does not supersede the elevation of the embankment top minus freeboard.

The mathematical functions applied are deterministic and follow Natural Resource Conservation Service (NRCS) guidelines (United States Department of Agriculture, NRCS, 1999). Mean monthly evaporation and precipitation data are available via the National Oceanic and Atmospheric Administration website, and runoff from the 25-year, 24-hour precipitation event is estimated using the NRCS Curve Number Method (United States Department of Agriculture, NRCS, 2004).

What have we learned?

1) The design of evaporation ponds, to be used as waste storage facilities, is complex, entails many variables, and typically requires multi-year tests.

2) Simulation of waste storage pond storage levels over time provides visual results that allow the designer to observe expected behavior of these systems and judge whether or not evaporation ponds are viable alternative systems to typical waste storage facilities in which frequent evacuation of storage materials is required.

3) Calculations using a spreadsheet are simplified to the extent that dozens of scenarios can be assembled and executed within a reasonable timeframe. This allows designers to study the results from such sensitivity analyses where one or more variables must be examined at numerous levels/values due to uncertain data at particular sites.

Future Plans

1) Train NRCS field staff regarding the potential pros and cons pertinent to these systems in comparison to others.

2) Encourage landowners to consider evaporation ponds as viable alternatives in areas with low precipitation/runoff.

3) Monitor site input variable values and the evaporation pond sediment and water levels over time to assess whether or not the models applied forecast overall evaporation pond behavior.

Author

Donald Hanson, Design Engineer, Natural Resources Conservation Service donald.hanson@wa.usda.gov

Additional information                

Author’s contact via telephone: (509) 323-2949.

References

United States Department of Agriculture, NRCS (1999). National Engineering Handbook, Part 651, Agricultural Waste Management Field Handbook. Washington D.C.: Author. Retrieved 3/14/2014 at: http://directives.sc.egov.usda.gov/RollupViewer.aspx?hid=17092.
United States Department of Agriculture, NRCS (2004). National Engineering Handbook, Part 630, Estimation of Direct Runoff from Storm Rainfall. Washington D.C.: Author. Retrieved 1/6/2015 at: http://directives.sc.egov.usda.gov/RollupViewer.aspx?hid=17092.

Acknowledgements

I extend thanks to these NRCS cohorts for their cooperation and assistance during development of the tool and their comments and suggestions during reviews of this technical paper: Larry Johnson (State Conservation Engineer, Washington State), Joe Gasperi (State Geologist, Washington State), Sally Bredeweg (Environmental Engineer, West National Technical Service Center, Oregon State), Leigh Nelson (Water Management Engineer, National Water Management Center, Arkansas), and Noller Herbert (Director, Conservation Engineering Division, Washington, D.C.).

Waste storage pond sediment accumulation and water dynamics (10 years) chart

Waste storage pond sediment accumulation and water dynamics (10 years) chart

The authors are solely responsible for the content of these proceedings. The technical information does not necessarily reflect the official position of the sponsoring agencies or institutions represented by planning committee members, and inclusion and distribution herein does not constitute an endorsement of views expressed by the same. Printed materials included herein are not refereed publications. Citations should appear as follows. EXAMPLE: Authors. 2015. Title of presentation. Waste to Worth: Spreading Science and Solutions. Seattle, WA. March 31-April 3, 2015. URL of this page. Accessed on: today’s date.

The Importance of Nitrogen Stabilization

This session will highlight the importance of nitrification inhibitors and how they help delay the conversion of the ammonium form of nitrogen into the nitrate form which then can lead to leaching and denitrification. By using a nitorgen stabilizer, the plant has access to the ammonium form of nitrogen for a longer period of time in the root zone, where it needs it the most.

What Did We Do?

The active ingredient in Instinct II and N-Serve, nitrapyrin, is formulated to put the bacteria known as nitrosomonas, which convert the ammonia form of nitorgen to nitrate nitrogen in the soil, in a static state so that the ammonia form can be uptaken by the plant in the most stable form of nitrogen. Our product treats the soil, not the nitrogen, but uses nitrogen as the carrier, to prevent leaching and denitrification that can occur from warm, wet soils in the spring season. Our product has been tested and approved by the EPA for 40 years and has have numerous (189+) 3rd party and university data that supports that it does what we say it does, inhibits nitrification. In addition, there are other advantages to protecting your nitrogen investment which can lead to higher yields, faster dry down, higher test weight in corn and wheat and in addition, has no negative effect on protein on wheat. Instinct II can be used in UAN, Urea, or Liquid Manure. N-Serve is used on anhydrous ammonia.

What Have We Learned?

Based on the 189+ different 3rd party and university trials, plus the meta-anaylsis published in 2004, we have proven to increase crop yield by 7%, increase soil retention by 28%, decrease nitrogen leaching by 16%, and decease greenhouse gas emission by 51%. Our retention is extremely high on his product, and has proven to be a significant benefactor when used in manure (this year along, our averages on yield increase have been 12+ bushels). Future plans further expansion to outside of US markets, Canada, China, UK, and Australia alongside other EU countries. Further market expansion in the United States into other crops such as specialty crops markets, improvement on formulation for newer, expanding markets.

Author

Tiffany Galloway tlgalloway@dow.com

Additional Information

The authors are solely responsible for the content of these proceedings. The technical information does not necessarily reflect the official position of the sponsoring agencies or institutions represented by planning committee members, and inclusion and distribution herein does not constitute an endorsement of views expressed by the same. Printed materials included herein are not refereed publications. Citations should appear as follows. EXAMPLE: Authors. 2015. Title of presentation. Waste to Worth: Spreading Science and Solutions. Seattle, WA. March 31-April 3, 2015. URL of this page. Accessed on: today’s date.

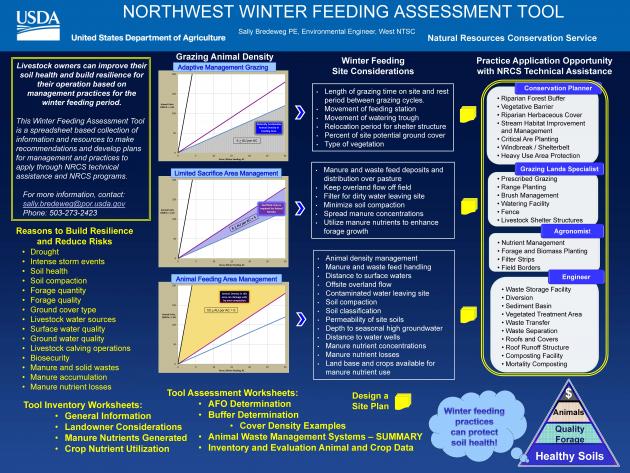
Northwest Winter Feeding Assessment Tool


Can Grazing Operations Be an AFO Based on Winter Feeding Practices?

Assessment of and protection for water quality resource concerns impacted by livestock winter feeding practices

Grazing lands management assistance with NRCS focuses on forage and range conditions for livestock producers and management practices during the growing season. Animal waste management system installations with NRCS have focused on water quality protection associated with confined animal feeding operations. The winter feeding management strategies of grazed livestock can also have a significant seasonal impact on the quality of nearby surface water resources.

In northern regions, winter is a dormant season for forage and a time when significant precipitation can occur. In recent years EPA has clarified the regulatory definition of an Animal Feeding Operation (AFO). The winter feeding management practices employed by grazing operations may risk water quality resource concerns and meet the EPA definition of an AFO.

A planning tool to identify sites where livestock density during the winter feeding period could create a resource concern can facilitate addressing this water quality issue. This assessment tool can review the applicability of NRCS practices for an animal waste management system and if appropriate move the planning process forward for a site design to protect surface water quality resources as needed for the seasonal feeding period.

What did we do? 

As the Environmental Engineer at the West National Technology Support Center I am developing the planning tool for livestock winter feeding sites. The landowner can participate in developing the concerns to be considered for their natural resources and operational practices. Animal manure and the nutrient balance with forage crops can be checked. A review is made if the winter feeding operation approaches the EPA definition of an AFO. The buffer quality conditions can be checked between the feeding site and the surface water sources. This tool can help engage the landowner in a conversations about adaptive management options for pasture or waste storage facility structures as might be recommended for higher animal density management over winter.

What have we learned?             

Resource planning must include the concerns and values of the landowner and the practice must fit with the characteristics of their operation. Animal production and natural resource management is ultimately effected by landowner decisions for the management of livestock and protection of natural resources.

Northwest winter feeding assessment tool

Northwest winter feeding assessment tool

Future Plans    

Continue to test the winter feeding assessment tool and make revisions for utilization.

Authors   

Sally Bredeweg PE, Environmental Engineer, NRCS West National Technology Support Center sally.bredeweg@por.usda.gov

Additional information                

NRCS – Agricultural Waste Management Field Handbook

NRCS – Comprehensive Nutrient Management Planning Procedure

EPA – Animal Feeding Operation (AFO) as defined in the EPA Technical Manual for Concentrated Animal Feeding Operations, EPA 833-F12-001, February 2012

Acknowledgements      

NRCS Range Management Consortia West Region

NRCS staff in WA, CO, UT, CA

EPA region 10

Growing Forward, British Columbia Init

The authors are solely responsible for the content of these proceedings. The technical information does not necessarily reflect the official position of the sponsoring agencies or institutions represented by planning committee members, and inclusion and distribution herein does not constitute an endorsement of views expressed by the same. Printed materials included herein are not refereed publications. Citations should appear as follows. EXAMPLE: Authors. 2015. Title of presentation. Waste to Worth: Spreading Science and Solutions. Seattle, WA. March 31-April 3, 2015. URL of this page. Accessed on: today’s date.

Getting Along With the Neighbors – Some Suggestions from Farmers


University of Wisconsin Extension hosted a meeting and part of the agenda was a discussion on neighbor relations. The farms represented at the meeting were large animal operations. They shared ideas on how they build or repair relationships with the community.

* During a recent power outage, we stopped by all of the neighbors with small children, offered the conference room at the farm as a warming shelter, as we have a generator on site that kept our power going.

* I provide a business card with my number to all of the neighbors and ask them to call me anytime with questions or concerns, allowing them to
also give me advance notice if they have a get together or event that our crews should be aware of. I say to call anytime they have a question
or concern. I stop by once per year, even to the neighbors who don’t like me.

* We do an annual training with our manure haulers, reviewing both the regulations we are under (243)/our maps, but also how we expect them to
act when representing our farm–etiquette expectations on the road-Jake braking, speed, being polite

* My clients are designating one person who does marking of setbacks in the field — biodegradable flags, spray paint, cones, even tillage that
shows where the setbacks area

* When a valve was left open on a tanker last fall, we bought car wash tokens and gave them to anyone driving through the area and those who
may not even have left home yet but lived on that road.

* We bought an industrial street sweeper and use it to clean mud and manure from the road

* After LISTENING to what the neighbors said in the hearing, some in my region are volunteering to observe larger setbacks to address neighbor
concerns. These can not be put into the permit and become enforcable, but it does show that they are open to the neighbor concerns.

* In January, I buy certificates for a maid service and hand deliver them to the neighbors. That way if our operations create dust, they can use it anytime during the year when they want to.

* We sponsor a local baseball team/soccer team, put the farm name on the back of the shirts, and after each game, provide chocolate milk to the winners “and non winners”

* We plow the snow from the ends of our neighbor’s driveways after each storm. It takes 5 minutes but they really appreciate it.

For More Information

For more on neighbor relations, working with industry (especially insurers), and professional training, contact Kevin Erb, University of Wisconsin. kevin.erb@uwex.edu

Biosecurity for Livestock and Poultry Manure Management

Most biosecurity plans are meant to protect animal and human health by preventing the spread of bacteria or other pathogens. Indirectly, effective biosecurity practices can reduce the likelihood of multiple or catastrophic mortalities which is an issue of environmental concern. While not usually discussed under the umbrella of “biosecurity”, manure handling should not be ignored when considering your plan. Related: Manure Pathogens

Avian Influenza | Swine PEDv | Pumping & Land Application | Inspectors | Mortalities | Recommendations by Species

Avian Influenza Resources

Since 2015, millions of birds have either died or had to be euthanized because of highly pathogenic avian influenza (HPAI). The approved methods of disposal for large-scale (catastrophic) mortalities include: burial, incineration, and composting.

PEDv (Porcine Epidemic Diarrhea virus) Resources

The swine industry has experienced significant losses as a result of PEDv, which can be transmitted through contact with manure of infected pigs. It is possible to move the virus between farms on vehicles, pumps, manure handling equipment, clothing, or any other item that comes in contact with manure and is not thoroughly disinfected between farms/fields. The low amount of viral exposure required to cause illness means that even tiny amounts of residual manure pose significant biosecurity risks.

Preventing Manure Pathogen Dispersal Between Farms or Field

Restricting access of off-farm equipment and personnel involved in manure pumping or manure application and thorough cleaning of equipment between farms are among the recommendations to follow to reduce risks of spreading manure-borne pathogens.

    • North Dakota State Biosecure Nutrient Management. This fact sheet does an especially nice job describing how to manage and clean equipment used in manure handling around the farm.
    • The National Pork Board released fact sheets on Biosecure Manure Pumping Procedures for farmers (pg 20), commercial manure haulers (pg 22), and land owners (pg 20).
    • The Maryland Department of Agriculture developed a brochure related to transporting manure and set out some guidelines to prevent the spread of pathogens.

Biosecurity for Inspectors or Technical Service Providers

What should regulatory inspectors do when traveling between farms to prevent the spread of disease? What requests can farmers make of inspectors to protect their farm biosecurity?

Biosecure Mortality Management

One of the best collections on composting animal mortalities comes from the Cornell Waste Management Institute. Check out their sections on health and safety and animal mortality composting for research on pathogen destruction and other safety considerations.

The following fact sheet was developed in response to the PEDv (porcine epidemic diarrhea virus), although these guidelines should be effective for reducing the risks related to other pathogens. It focuses on the use of rendering as the main mortality disposal method. Biosecure Mortalities Removal (pg 10)

Farmer & Farm Worker Biosecurity Resources

The following resources are not focused on managing manure but give a great overview of the larger biosecurity issue and practices on livestock and poultry farms.

Swine

farm worker in a confined swine barn
This farm worker follows the farm biosecurity protocol and is wearing coveralls and boots that are cleaned and laundered on-site.

Poultry

Dairy

Beef Cattle

Goats and Sheep