
Antibiotic Degradation During Anaerobic Digestion and Effects of Antibiotics on Biogas Production


Purpose 

The purpose of this research was to investigate the degradation of four animal husbandry antibiotics during anaerobic digestion (AD) and study biogas inhibition from the antibiotics. This study was designed to fill information gaps related to AD inhibition by different antibiotic classes in diluted manures received by anaerobic digesters, particularly cattle manure, and the need to more thoroughly investigate antibiotic degradation products from the AD process.

What did we do? 

We conducted AD bench-scale experiments that investigated biogas inhibition and antibiotic degradation. First, cattle manure was added to glass bottles. A known amount of antibiotic standard was added to the manure. A small amount of dilution water was added and the manure-antibiotic slurry was mixed briefly. Then, anaerobic digestion inoculum was added to the bottle. The air in the bottle was purged with nitrogen gas. Finally, the bottles were sealed and placed in an incubator set at 37°C. Biogas measurements and small liquid samples for antibiotic analysis were taken daily. At the end of the 40 day AD study, the solids were extracted to determine the amount of antibiotic adsorbed to the solids.

What have we learned? 

Results from our research showed that three out of four antibiotics degraded within 5 days of AD. Several degradation products were detected, some of which could be biologically active. The antibiotic that did not degrade was mostly found in the liquid phase of the AD reactor slurry and a small portion was adsorbed to the solids. Our results suggest that when antibiotic contaminated feedstocks are added to AD reactors, persistent antibiotics and transformation products may contaminate the liquid and solid effluents.

Our results showed the one of the antibiotics tested was more toxic to the AD process. Approximately 6.4-36 mg/L florfenicol lowered biogas production by 5-40%. Greater than 91 mg/L of the other antibiotics was needed to lower biogas production. These higher concentrations can be found in urine and feces of treated animals but they are not typical for the AD reactor following the addition of multiple feedstocks, inoculum, and dilution water. Our results suggest that there is little concern for these antibiotics to lower biogas production when cattle manure is used as an AD feedstock because the antibiotic concentration should be below inhibitory concentrations.

Future Plans 

Future research plans are to investigate the microbial population change in anaerobic digesters due to antibiotic contaminated cattle manure.

Authors

Shannon Mitchell, Post-doctoral Research Associate at Washington State University shannon.mitchell@email.wsu.edu

Craig Frear, Assistant Professor at Washington State University

Additional information 

http://www.ncbi.nlm.nih.gov/pubmed/24113548

Acknowledgements

This research was supported by Biomass Research Funds from the WSU Agricultural Research Center; and by the BioAg (Biologically Intensive Agriculture and Organic Farming) Grant Program of the Washington State University Center for Sustaining Agriculture and Natural Resources.

The authors are solely responsible for the content of these proceedings. The technical information does not necessarily reflect the official position of the sponsoring agencies or institutions represented by planning committee members, and inclusion and distribution herein does not constitute an endorsement of views expressed by the same. Printed materials included herein are not refereed publications. Citations should appear as follows. EXAMPLE: Authors. 2015. Title of presentation. Waste to Worth: Spreading Science and Solutions. Seattle, WA. March 31-April 3, 2015. URL of this page. Accessed on: today’s date.

Rotational Grazing Effects on Pasture Nutrient Content


Why Look at Rotations Grazing in Horse Pastures?

Rotational grazing is a recommended strategy to improve pasture health and animal performance. Previous studies have reported improved forage quality in rotationally grazed pastures compared to those continuously grazed by cattle, but data are limited for horse pastures.

What did we do?

A study at the University of Tennessee was conducted to evaluate the effects of rotational grazing on the nutrient content of horse pastures. A 2.02 ha rotational grazing pasture (RG) and a 2.02 ha continuous grazing pasture (CG) were each grazed by three adult horses at a stocking rate of 0.6 ha/horse over a two year period. The RG system was divided into four 0.40 ha paddocks and a heavy use area. Pastures were maintained at uniform maximum height of 15 to 20 cm by mowing. Horses were rotated between the RG paddocks every 10 to 14 d, or when forage was grazed to a height of approximately 8 cm. Pasture forage samples (n = 520) were collected and composited monthly (n = 14) during the growing season (April to November) by clipping forage from randomly placed 0.25 m2 quadrates from RG and CG, as well as before and after grazing each RG paddock. Botanical composition and percent ground cover were visually assessed. Forage samples were oven dried at 60°C in a forced air oven for 72 h to determine DM. Forage biomass yield (kg/ha), digestible energy (DE, Mcal/kg), crude protein (CP), acid detergent fiber (ADF), neutral detergent fiber (NDF), lignin, calcium (Ca), phosphorous (P), potassium (K), magnesium (Mg), ash, fat, water soluble carbohydrates (WSC), sugar and fructan were measured using a FOSS 6500 near-infrared spectrometer. Data were analyzed using paired T-tests and differences were determined to be significant at P < 0.05. Data are reported as means ± SEM as a percent of DM.

What have we learned?

Table 1. Nutrient content of continuously grazed (CG) pasture and rotationally grazed (RG) pasture. Data are summarized as means ± SE.
Nutrient Continuous Rotational
DM, % 91.72 ± 0.36 91.89 ± 0.34
DE, Mcal/kg 2.31 ± 0.064 2.42± 0.039*
CP, % 14.92 ± 0.77 15.79 ± 0.64
ADF, % 33.16 ± 1.21 30.81 ± 0.82*
NDF, % 56.80 ± 1.75 53.53 ± 1.65*
Lignin, % 3.47 ± 0.38 2.88 ± 0.32*
Ca, % 0.69 ± 0.11 0.68 ± 0.11
P, % 0.25 ± 0.009 0.27 ± 0.008*
K, % 1.92 ± 0.10 2.11 ± 0.087*
Mg, % 0.25 ± 0.009 0.26 ± 0.007
Ash, % 9.35 ± 0.83 9.39 ± 0.66
Fat, % 2.65 ± 0.12 2.83 ± 0.08
WSC, % 4.95 ± 0.60 6.72 ± 0.71*
Sugar, % 3.33 ± 0.50 4.86 ± 0.55*
Fructan, % 1.61 ± 0.15 1.59 ± 0.16
*means within rows differ; P < 0.05

Forage biomass yield did not differ between RG and CG (2,125 ± 52.2; 2,267 ± 72.4 kg/ha, respectively). The percentage of grass species was greater in RG compared to CG (81.7 ± 3.9; 73.9 ± 4.5, respectively) and the percentage of weed species was lower in RG compared to CG (3.4 ± 0.8; 12.0 ± 1.5, respectively). Tall fescue, kentucky bluegrass, bermudagrass and white clover were the dominant forage species. Rotational grazing increased forage quality compared to continuous grazing. The RG system was higher in DE (Mcal/kg), phosphorous (P), potassium (K), water soluble carbohydrates (WSC), and sugar compared to the CG system (Table 1). While there wasn’t a significant difference in crude protein (CP) content between RG and CG, the numerical difference could potentially affect animal performance. The RG pasture was lower in acid detergent fiber (ADF), neutral detergent fiber (NDF) and lignin compared to the CG pasture. Within the RG pasture, forage nutrient content declined following a grazing period, but recovered with rest. Paddocks were lower in DE, CP, P, K, Fat, WSC and sugar while they were higher in ADF and NDF after grazing compared to before grazing (Table 2).

Table 2. Nutrient content of rotational grazing (RG) paddocks before and after grazing. Data are summarized as means ± SE.
Nutrient Before After
DM, % 91.84 ± 0.27 91.84 ± 0.39
DE, Mcal/kg 2.34 ± 0.03 2.21 ± 0.02*
CP, % 14.98 ± 0.39 13.71 ± 0.43*
ADF, % 32.24 ± 0.54 34.33 ± 0.48*
NDF, % 55.97 ± 0.88 59.24 ± 0.89*
Lignin, % 2.79 ± 0.20 3.41 ± 0.25*
Ca, % 0.58 ± 0.05 0.59 ± 0.05
P, % 0.28 ± 0.004 0.25 ± 0.006*
K, % 2.11 ± 0.08 1.72 ± 0.07*
Mg, % 0.26 ± 0.007 0.26 ± 0.009
Ash, % 8.76 ± 0.19 8.79 ± 0.21
Fat, % 2.64 ± 0.05 2.45 ± 0.06*
WSC, % 6.05 ± 0.47 4.85 ± 0.39*
Sugar, % 4.40 ± 0.38 3.22 ± 0.30*
Fructan, % 1.67 ± 0.15 1.69 ± 0.16
*means within rows differ; P < 0.05

Future Plans

Rotational grazing may be a preferred alternative to continuous grazing as it favors grass production, suppresses weeds and increases energy and nutrient content of pastures. While rotational grazing may be beneficial from an environmental and animal production standpoint, an increase in DE and WSC may pose a risk for horses prone to obesity and metabolic dysfunction. Appropriate precautions should be taken in managing at risk horses under rotational grazing systems. This work is being continued at Virginia Tech and other universities to further understand the use of rotational grazing systems for horses.

Authors

Bridgett McIntosh, Equine Extension Specialist, Virginia Tech bmcintosh@vt.edu

Matt Webb, Ashton Daniel, David McIntosh and Joe David Plunk, University of Tennessee

Additional information

http://www.arec.vaes.vt.edu/middleburg/

Acknowledgements

The authors thank the University of Tennessee Middle Tennessee Research and Education Center and the Tennessee Department of Agriculture’s Nonpoint Source Pollution 319 Water Quality Grant for their support of this project.

The authors are solely responsible for the content of these proceedings. The technical information does not necessarily reflect the official position of the sponsoring agencies or institutions represented by planning committee members, and inclusion and distribution herein does not constitute an endorsement of views expressed by the same. Printed materials included herein are not refereed publications. Citations should appear as follows. EXAMPLE: Authors. 2015. Title of presentation. Waste to Worth: Spreading Science and Solutions. Seattle, WA. March 31-April 3, 2015. URL of this page. Accessed on: today’s date.

The North American Partnership for Phosphorus Sustainability: Creating a Circular P Economy as Part of a Sustainable Food System


Purpose           

To promote and foster the implementation of sustainable P solutions in both the private and public sectors

People standing in the formation of a &#039;P&#039;What did we do? 

Recently, a team of Phosphorus researchers initiated the North American Partnership for Phosphorus Sustainability (NAPPS) with seed funding from Arizona State University. The goal of North American Partnership for Phosphorus Sustainability (NAPPS) is to actively engage stakeholders (e.g. corporations, national and local policy makers, planners and officials, representatives of agriculture, industry) to promote and foster the implementation of sustainable P solutions in both the private and public sectors. NAPPS seeks to engage partners in identifying key bottlenecks and strategies for decision-making, policy, and implementation of P efficiency and recycling technologies.

What have we learned? 

Phosphorus is necessary for life, and is essential for agricultural production, and so for food security. The growing world population, changing diets of humans to more meat and dairy and growing use of phosphate additives, and biomass production for energy or industrial uses result in an increasing need for phosphorus input, and the world is today heavily dependent on non-renewable, finite phosphate rock reserves that which are concentrated in a small number of countries, posing geopolitical vulnerability. These trends lead to the depletion of phosphate rock resources, pressure on and instability in phosphate prices, decreasing quality and increasing contaminant loads of remaining reserves, and unstable, insecure P supply for regions without local rock resources, especially in the developing world. At the same time, excess P is lost from the food system at multiple points. The result is eutrophication of freshwater and coastal ecosystems – lo ss of the amenity value of lakes and rivers as well as toxic algal blooms and impacts on fisheries.

Phosphorus stewardship is therefore essential, and we must use P more efficiently in the agri-food system, and actively develop phosphorus reuse and recycling technologies and practices. At the same time, the issue of contaminants, both in phosphate rock and in recycled phosphates must be addressed, as well as the need to reduce phosphate inputs to surface waters where these are problematic. We can reduce the use of mined P by producing and applying fertilizer from recycled sources. By using improved practices and smarter crops, we can reduce the demand for P fertilizer and reduce the runoff to surface water bodies. By reducing and re-using food waste and eating food with lower P footprints we can lower our phosphorus consumption and demand. Collectively, these will also lessen the impacts of P runoff on precious water resources.

Future Plans 

NAPPS activities and stakeholder recruitment will be organized around four main sectors: P Recycling; P Efficiency in Food Production; BioEnergy and Food Choice; and Water Quality. Projects and activities will be decided by the Board of Directors, but may include:

1. Develop a common vision for creating a sustainable P cycle in North America

2. Identifying and helping businesses and other organizations respond to opportunities offered by challenges in P management and emerging research in P sustainability

3. Building networks between different interest groups and sectors related to phosphorus management and recycling

4. Evaluating new P efficiency and recycling technologies, including feasibility, availability of suppliers, inventory of existing technologies and companies, cost/benefit analysis, and life cycle analyses

5. Fostering implementation of new technologies by improving the efficiency of business value chains

6. Assessing and facilitating regulatory development pertaining to phosphorus management, including waste, environmental, discharge, and agriculture to improve P sustainability

7. Representing North American phosphorus managers and innovators in international meetings and initiatives

8. Preparing funding RFPs for demonstration projects and integration and dissemination of new technologies and concepts

Authors

Helen Ivy Rowe, Assistant Research Professor, School of LIfe Sciences, Arizona State University hirowe@asu.edu

James J. Elser, Regents Professor, School of LIfe Sciences, Arizona State University

Additional information                

http://sustainablep.asu.edu

Acknowledgements      

We thank Arizona State University for providing funds to launch this initiative.


Logo for Sustainable Phosphorus Initiative

The Sustainable Phosphorus Initiative - farm, food, fertilizer

The authors are solely responsible for the content of these proceedings. The technical information does not necessarily reflect the official position of the sponsoring agencies or institutions represented by planning committee members, and inclusion and distribution herein does not constitute an endorsement of views expressed by the same. Printed materials included herein are not refereed publications. Citations should appear as follows. EXAMPLE: Authors. 2015. Title of presentation. Waste to Worth: Spreading Science and Solutions. Seattle, WA. March 31-April 3, 2015. URL of this page. Accessed on: today’s date.

Environmental Footprints of Beef Production in the Kansas, Oklahoma and Texas Region

Why Look at the Environmental Footprint of Livestock?

Both producers and consumers of animal products have concern for the environmental sustainability of production systems. Added to these concerns is the need to increase production to meet the demand of a growing population worldwide with an increasing desire for high quality protein. A procedure has been developed (Rotz et al., 2013) that is now being implemented by the U.S. beef industry in a comprehensive national assessment of the sustainability of beef. The first of seven regions to be analyzed consisted of Kansas, Oklahoma and Texas.

What did we do? 

A survey and visits of ranch and feedyard operations throughout the three state region provided data on common production practices. From these data, representative ranch and feedyard operations were defined and simulated for the climate and soil conditions throughout the region using the Integrated Farm System Model (USDA-ARS, 2014). These simulations predicted environmental impacts of each operation including farm-gate carbon, energy, water and reactive nitrogen footprints. Individual ranch and feedyard operations were linked to form 28 representative cattle production systems. A weighted average of the production systems was used to determine the environmental footprints for the region where weighting factors were determined based upon animal numbers obtained from national agricultural statistics and survey data. Along with the traditional beef production systems, Holstein steers and cull animals from the dairy industry in the region were a lso included.

What have we learned?             

The carbon footprint of beef produced was 18.4 ± 1.7 kg CO2e/kg carcass weight (CW) with the range in individual production systems being 13.0 to 25.4 kg CO2e/kg CW. Footprints for fossil energy use, non precipitation water use, and reactive nitrogen loss were 51 ± 4.8 MJ/kg CW, 2450 ± 450 liters/kg CW and 138 ± 12 g N/kg CW, respectively. The major portion of the carbon, energy and reactive nitrogen footprints was associated with the cow-calf phase of production (Figure 1).

Beef footprints

Beef footprints

Future Plans   

Further analyses are planned for the remaining six regions of the U.S. which will be combined to provide a national assessment. Cattle production data will be combined with processing, marketing and consumer data to complete a comprehensive life cycle assessment of beef production and use.

Authors       

C. Alan Rotz, Agricultural Engineer, USDA-ARS al.rotz@ars.usda.gov

Senorpe Asem-Hiablie and Kim Stackhouse-Lawson

Additional information                

Rotz, C. A., B. J. Isenberg, K. R. Stackhouse-Lawson, and J. Pollak. 2013. A simulation-based approach for evaluating and comparing the environmental footprints of beef production systems. J. Anim. Sci. 91:5427-5437.

USDA-ARS. 2014. Integrated Farm System Model. Pasture Systems and Watershed Mgt. Res. Unit, University Park, PA. Available at: http://www.ars.usda.gov/Main/docs.htm?docid=8519. Accessed 5 January, 2015.

Acknowledgements    

This work was partially supported by the Beef Checkoff.

The authors are solely responsible for the content of these proceedings. The technical information does not necessarily reflect the official position of the sponsoring agencies or institutions represented by planning committee members, and inclusion and distribution herein does not constitute an endorsement of views expressed by the same. Printed materials included herein are not refereed publications. Citations should appear as follows. EXAMPLE: Authors. 2015. Title of presentation. Waste to Worth: Spreading Science and Solutions. Seattle, WA. March 31-April 3, 2015. URL of this page. Accessed on: today’s date.


Industrial Scale Production of Amino Acid Fertilizer from Fish Waste and Under-Utilized Fish

Are Seafood By-Products a Potential Fertilizer?

With a dramatically increasing world population and a world catch of fish of more than 140 million tons per year, there is obviously an increased need to utilize our marine sources with more intelligence and foresight. Large amounts of protein-rich by-products from the seafood industry along with under-utilized fish are discarded or processed into fish meal and fertilizer. Novel processing methods are needed to convert seafood by-products into more profitable and marketable products. Proteins from fish processing by-products can be modified to improve their quality, functional characteristics and nutritional value by enzymatic and chemical hydrolysis. Protein from fish by-products and under-utilized species, are rich in amino acids and could be used as fertilizer.

What did we do? 

In current study, fish amino acid fertilizer (FAAF) (Amino-Hirkan) was produced from Anchovy sprat, an under-utilized pelagic fish in the Caspian Sea using a commercial protease (Alcalase) at a commercial scale. In order to produce FAAF, whole anchovy fish samples were first minced using an industrial mixer, and mixed with water (1:2 w/v). With Alcalase added to the samples in a ratio of 1%, the enzymatic hydrolysis was conducted for 5 h at 50 °C. The samples were then heated at 90 °C for 10 min to inactivate the enzyme. After filtration and removing the solid particles, the liquid was used as the fertilizer. A comparison of the FAAF with four commercial fertilizers on Roshan wheat cultivar growth, chlorophyll levels, and resistance to the salt stress were measured.

What have we learned? 

The FAAF induced better growth compared to the commercial fertilizers (P < 0.05). Higher total chlorophyll was observed in wheat seedling in FAAF group (P < 0.05). Total chlorophyll was 4.48 mg g-1 wet weight for the FAAF compared to 3.86-4.11 mg g-1 wet weight for the commercial fertilizers. To study the influence of the FAAF on the salt tolerance in wheat, two enzymes whose activity increases in response to stress, catalase and peroxidase levels were tested at two salinity levels (40 and 80 mM). Catalase was not affected by salinity stress (P > 0.05), but peroxidase increased with increasing salt exposure from 8.84 (control) to 11.23 at 40 mM, and to 13.54 unit mg protein-1 at 80 mM salinity in FAAF group. The peroxidase level was higher in the FAAF compared to commercial fertilizers which were 8.9-9.13 unit mg protein-1 at 40 mM and 9.05-10.22 unit mg protein-1 at 80 mM salinity.

This study indicates that fish based fertilizers can have beneficial impact for wheat and potentially other crops resulting in an increase in yield and improved stress response. FAAF can be produced to organic standards, and in a sustainable manner, providing additional market advantages.

Examples of practical fish hydrolysate plants that have been built in various locations in Alaska and worldwide for the production of fertilizers and feed ingredients are included in the presentation.

Future Plans    

We are optimizing the procedure of fertilizer production from fish wastes and under-utilized fish species to increase the yield of production by applying different enzymes, temperatures, separation methods, and from different sources.

Also, different plants will be subjected to the FAAF to study the influence of the FAAF on them. ((Not sure what this means, please revise))

Authors       

Mahmoudreza Ovissipour, Ph.D. School of Food Science, Washington State University mrovissi@yahoo.com

Gleyn E. Bledsoe, Ph.D. University of Idaho; Barbara Rasco, Ph.D. JD, School of Food Science, Washington State University

Additional information                

We have not published the results yet.

The authors are solely responsible for the content of these proceedings. The technical information does not necessarily reflect the official position of the sponsoring agencies or institutions represented by planning committee members, and inclusion and distribution herein does not constitute an endorsement of views expressed by the same. Printed materials included herein are not refereed publications. Citations should appear as follows. EXAMPLE: Authors. 2015. Title of presentation. Waste to Worth: Spreading Science and Solutions. Seattle, WA. March 31-April 3, 2015. URL of this page. Accessed on: today’s date.

Estimation of phosphorus loss from agricultural land in the Southern region of the USA using the APEX, TBET, and APLE models

Purpose

The purpose of our work was to determine, within the southern region (AL, AR, FL, GA, KY, LA, MS, NC, OK, SC, TN, and TX), the feasibility of using different models to determine potential phosphorus loss from agricultural fields in lieu of phosphorus indices.

What did we do? 

We have collected water quality and land use data from plot- and field-scale experiments throughout the South (AR, GA, MS, NC, OK, and TX). The water quality data provide information on runoff rates, phosphorus concentrations, and phosphorus loads. The land use data provide information on both management practices, including the amount of phosphorus applied as fertilizer and/or manure and tillage, as well as inherent properties such as rainfall, soil series, etc. Once we obtained this information, we used the data to run the Agricultural Policy / Environmental eXtender (APEX), Texas BMP Evaluation Tool (TBET), and Annual Phosphorus Loss (APLE) models, in both uncalibrated and calibrated modes.

What have we learned?            

Models predicted runoff accurately, but were unable to predict sediment or phosphorus losses accurately in many cases. Not surprisingly, models performed better when calibrated but even so predictions were problematic for particular locations and constituents (e.g. runoff in NC under no-tillage conditions and sediment at many sites).

Future Plans

We continue to determine factors affecting the poor predictions of certain constituents (e.g. sediment or phosphorus) in different data sets and models. Calibration will continue for APEX and TBET. In addition, state phosphorus indices are being run for each data set. The results from each state’s phosphorus index will be compared against the modeled data as well as other state indices in order to learn if models such as APEX, TBET, and/or APLE can better determine field phosphorus losses than the indices. Final recommendations will be provided to USDA-NRCS.

Authors

Deanna Osmond, Professor, NC State University, Soil Science Department deanna_osmond@ncsu.edu

David Radcliffe and Adam Forsberg (University of GA), John Ramirez-Avila (MSU), Carl Bolster (ARS); Dan Storm and Aaron Mittelstet (OSU)

Additional information              

This is part of a symposium.

Acknowledgements      

Thanks to our sponsor, USDA-NRCS grant 69-3A75-12-182.

The authors are solely responsible for the content of these proceedings. The technical information does not necessarily reflect the official position of the sponsoring agencies or institutions represented by planning committee members, and inclusion and distribution herein does not constitute an endorsement of views expressed by the same. Printed materials included herein are not refereed publications. Citations should appear as follows. EXAMPLE: Authors. 2015. Title of presentation. Waste to Worth: Spreading Science and Solutions. Seattle, WA. March 31-April 3, 2015. URL of this page. Accessed on: today’s date.

Phosphorus Indices: What is the water quality goal?

Phosphorus indices provide relative loss ratings that then have a corresponding management response.  Because most state Phosphorus Indices are qualitative it is not clear how the relative loss rating corresponds to actual phosphorus inputs into the receiving water and how the receiving water would react to these additions.  Even with qualitative Phosphorus Indices, unless the water resource has a specific Total Maximum Daily Load, it is not clear how losses correspond to water quality outcomes.  These issues will be discussed in the context of the 590 Natural Resources Conservation Standard for nutrient management.

Why Examine the Phosphorus Index?

The purpose of our work was to determine, within the southern region (AL, AR, FL, GA, KY, LA, MS, NC, OK, SC, TN, and TX), the relationship between state P-Index ratings to measured water quality P losses, and each other.

What did we do? 

We have collected water quality and land use data from plot- and field-scale studies throughout the South (AR, GA, MS, NC, OK, and TX). The water quality data provide information on runoff and P concentrations and loads. Land use data provide information on management practices, including the amount and timing of P applied as fertilizer and/or manure and tillage, as well as site characteristics such as rainfall, soil series, and crop or forage management. This information was used to run each southern P Index. Four of the indices are considered component, in that the rating is in lbs P/ac/year. The remaining eight P Indices are either additive or multiplicative and final ratings are qualitative. We then compared the state ratings against each other and against the total and soluble P loads that were measured from each study site. In order to compare load losses with qualitative P indices, measured total P loads were transformed based on USDA-NRCS tentative guidelines of Low (0-2 lb P/ac), Medium (2-5 lb P/ac), and High (>5 lb P/ac) P loss.

What have we learned?            

When we compared the data, there were expected differences between state-P Indices for the same set of data, but there was often considerable uniformity. However, what was less clear is what the P-Index ratings mean for water quality protection. The analysis left us with many difficult questions on how to relate edge-of-field P loss to more complex in-stream or lake P criteria and thresholds.

Future Plans 

To answer these questions, we are going to run state P Indices in different modes: against annual water quality and land treatment data; against averaged water quality and land treatment data; using erosion rates from sediment generated from the experiment, and; using erosion rates using RUSLE2. We will compare these P Index ratings against each other, the water quality data, USDA-NRCS ratings, and EPA ecosystem nutrient criteria, to help us better understand the relative value of P Indices in protecting water resources.

Authors

Deanna Osmond, Department Extension Leader, NC State University Soil Science Department deanna_osmond@ncsu.edu

C. Bolster, M. Cabrera, S. Feagley, B. Haggard, C. Mitchell, R. Mylavarapu, L. Oldham, A. Sharpley, F. Walker, and H. Zhang

Acknowledgements      

Thanks to our sponsor, USDA-NRCS grant 69-3A75-12-182.

The authors are solely responsible for the content of these proceedings. The technical information does not necessarily reflect the official position of the sponsoring agencies or institutions represented by planning committee members, and inclusion and distribution herein does not constitute an endorsement of views expressed by the same. Printed materials included herein are not refereed publications. Citations should appear as follows. EXAMPLE: Authors. 2015. Title of presentation. Waste to Worth: Spreading Science and Solutions. Seattle, WA. March 31-April 3, 2015. URL of this page. Accessed on: today’s date.

Ammonia and Nitrous Oxide Model for Open Lot Cattle Production Systems

Purpose 

Air emissions, such as ammonia (NH3) and nitrous oxide (N2O), vary considerably among beef and dairy open lot operations as influenced by the climate and manure pack conditions. Because of the challenges with direct measurements, process-based modeling is a recommended approach for estimating air emissions from animal feeding operations. The Integrated Farm Systems Model (IFSM; USDA-ARS, 2014), a whole-farm simulation model for crop, dairy and beef operations, was previously expanded (version 4.0) to simulate NH3 emissions from open lots. The model performed well in representing emissions for two beef cattle feedyards in Texas (Waldrip et al., 2014) but performed poorly in predicting NH3 emissions measured at an open lot dairy in Idaho.

What did we do? 

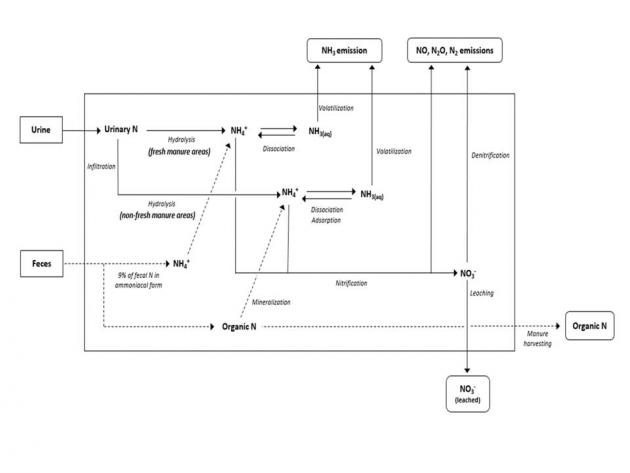
The open lot nitrogen routine of IFSM was revised to better represent the effects of climate on lot and manure pack conditions. Processes affecting the formation and emission of NH3 and N2O from open lots were revised and better integrated. These processes included urea hydrolysis, surface infiltration, ammonium-ammonia association/dissociation, ammonium sorption, NH3 volatilization, nitrification, denitrification, and nitrate leaching (Figure 1). The soil water model in IFSM was also modified and used to represent an open lot. The accuracy of the revised model (version 4.1) was evaluated using measurements from two beef cattle feedyards in Texas (Todd et al., 2011; Waldrip et al., 2014) and an open lot dairy in Idaho (Leytem et al., 2011). Comparing the two regions, Idaho typically has much drier conditions in summer and wetter conditions in winter.

Lot model

Figure 1. The revised Integrated Farm Systems Model (IFSM)

What have we learned? 

The revised model predicted NH3 emissions for the Texas beef cattle feedyards similar to the previous version with model predictions having 59 to 81% agreement with measured daily emissions. Simulated NH3 emissions for the Idaho open lot dairy improved substantially with 56% agreement between predicted and measured daily NH3 emissions. For the Idaho open lot dairy, IFSM also predicted daily N2O emissions with 80% agreement to those measured. These results support that IFSM can predict NH3 and N2O emissions from open lots as influenced by climate and lot conditions. Therefore, IFSM provides a useful tool for estimating open lot emissions of NH3 and N2O along with other aspects of performance, environmental impact and economics of cattle feeding operations in different climate regions, and for evaluating management strategies to mitigate emissions.

Future Plans    

The revised IFSM is being used to study nitrogen losses and whole farm nutrient balances of open lot feed yards and dairies. The environmental benefits and economic costs of mitigation strategies will be evaluated to determine best management practices for these production systems.

Authors      

C. Alan Rotz, Agricultural Engineer, USDA-ARS al.rotz@ars.usda.gov

Henry F. Bonifacio, April B. Leytem, Heidi M. Waldrip, Richard W. Todd

Additional information 

Leytem, A.B., R.S. Dungan, D.L. Bjorneberg, and A.C. Koehn. 2011. Emissions of ammonia, methane, carbon dioxide, and nitrous oxide from dairy cattle housing and manure management systems. J. Environ. Qual. 40:1383-1394.

Todd, R.W., N.A. Cole, M.B. Rhoades, D.B. Parker, and K.D. Casey. 2011. Daily, monthly, seasonal and annual ammonia emissions from Southern High Plains cattle feedyards. J. Environ. Qual. 40:1-6.

USDA-ARS. 2014. Integrated Farm System Model. Pasture Systems and Watershed Mgt. Res. Unit, University Park, PA. Available at: http://www.ars.usda.gov/Main/docs.htm?docid=8519. Accessed 5 January, 2015.

Waldrip, H.M., C.A. Rotz, S.D. Hafner, R.W. Todd, and N.A. Cole. 2014. Process-based modeling of ammonia emissions from beef cattle feedyards with the Integrated Farm System Model. J. Environ. Qual. 43:1159-1168.

Acknowledgements      

This research was funded in part by the United Dairymen of Idaho. Cooperation of the dairy and beef producers is also acknowledged and appreciated.

The authors are solely responsible for the content of these proceedings. The technical information does not necessarily reflect the official position of the sponsoring agencies or institutions represented by planning committee members, and inclusion and distribution herein does not constitute an endorsement of views expressed by the same. Printed materials included herein are not refereed publications. Citations should appear as follows. EXAMPLE: Authors. 2015. Title of presentation. Waste to Worth: Spreading Science and Solutions. Seattle, WA. March 31-April 3, 2015. URL of this page. Accessed on: today’s date.


Using Whole Farm Walkovers to Prioritize Soil and Water Management with Farmers and Evaluate Watershed Resource Condition


Purpose

Each farm uniquely contributes toward collective water quality passing through and leaving their neighborhood.  University of Wisconsin – Discovery Farms research shows that critical sites, critical times, and critical conditions play a major role in loss of sediment and nutrients from farmland.  Critical site losses can contribute the majority of whole farm annual sediment and nutrient loss, and very often, single-large event storms can be the source of almost all loss from a farm in any given year.  Identifying critical areas, and how they are being managed, is step one toward maintaining soil productivity and minimizing sediment and nutrient loss within agricultural watersheds.

To understand and reduce agriculture’s environmental footprint, there needs to be accurate documentation of what’s currently happening on the land and how the current farming system is impacting water quality.  UW – Discovery Farms has been working with farmers to conduct whole farm walkovers to document and better understand the effectiveness of their farming system toward minimizing sediment and nutrient loss from cropland.

example text from a farm walkoverWhat we did

The UW – Discovery Farms Program and Yahara Pride Farms, a non-profit organi­zation dedicated to improving water quality of the Yahara River wa­tershed in south central, Wisconsin, have worked with more than 60 farmers in three Wisconsin watersheds to conduct whole farm walkovers (2012-2014).   This process helped prioritize soil and water management on individual farms by raising awareness of critical site locations and what their current condition is.  On a watershed scale, whole farm walkovers also help to evaluate watershed resource conditions at a particular point in time.

Whole farm walkovers evaluated cropland and other farmland areas, identifying critical sites where significant loss of sediment and/or nutrients either could occur, or was actively occurring.  This concept is producer derived and producer desired, and was not meant to take the place of agency plans.

figure 2. example map from a walkoverA simple “stop-light” scoring process was used to attach qualitative scores to critical sites that posed risk for sediment or nutrient loss as follows: 1) Green  – areas with excellent or very good management (no changes required); 2) Yellow – areas that need some improvement over a period of 1 – 5 years; and 3) Red – areas that need improvement within the next 12 -18 months.

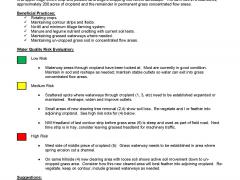
Walkovers were summarized into two-page color-coded text and map documents (Fig. 1 and 2).  This information identified the risk of sediment or nutrient loss with a rank based on the green-yellow-red criteria.  It also documented practices that farmers were currently using that protect water quality.  This information was shared with each farmer to ensure that the evaluation identified all of the critical areas on their farm.  Areas that need improvement were discussed and strategies developed to secure additional assistance where necessary.

What we learned

This concept is producer derived and producer desired.  Farmer feedback has helped improve the deliverables and keep the process practical.  Farmers have welcomed staff to walk their land and consult back with an honest discussion, helping them understand critical sites they manage.  Many “yellow and red” areas identified within cropland were corrected even before staff could return to the farm with summarized information.  This validates the importance of 1:1 on-farm interactions and the value farmers attached to the walkover process.  Whole farm walkovers have helped farmers begin planning repairs to actively contributing critical sites, and consider land management changes to minimize sediment and nutrient loss from their property.

Results from two different watersheds show approximately 75% of farmland is being managed very well, with minimal risk of losing sediment or nutrients; 20% needs some attention and conservation repair; and approximately 2% was showing significant risk, with most of that existing outside of cropland areas.  The general breakdown is similar between the two watersheds, with differences in the details and kind of yellow and red critical areas, reflecting local landscapes and farming systems.  A summary follows:

Watershed DR had 9,923 acres of farmland evaluated for 27 farmers on 85 tracts of land.  A total of 250 critical areas were identified in this glaciated, long sloped landscape influenced by corn-soybean crop rotations and a small number of active dairy farms, with breakout as follows:

  • (78%) green;
  • (20%) yellow – most categorized as concentrated water flow areas.  Other “yellows” included stream corridor, livestock areas, un-cropped upland areas, and manure piles;
  •  (< 2%) red – all categorized within stream corridors.

Watershed JV had 4,816 acres of farmland evaluated for 33 farmers on 54 tracts of land.  A total of 599 critical areas were identified in this unglaciated, steeper sloped landscape influenced by dairy / forage based farming systems, with breakout as follows:

  • (76%) green;
  • (21%) yellow – most categorized as concentrated water flow areas.  Other “yellows” included entry from cropland concentrated flow into non-cropland, un-cropped upland areas, livestock areas, and stream corridor;
  • (2.5 %) red – most categorized as un-cropped upland.  Other “reds” included concentrated flow areas, and livestock areas.

Future plans

We will teach this process to crop consultants, farmer groups, soil and water conservation professionals, and farmers to empower them with a proactive way to identify local critical sites and respond by choosing practical soil, water and nutrient management practices that work within their regional neighborhood and within their chosen farming systems.

Authors

Kevan Klingberg, and Todd Prill

Outreach Specialist, kevan.klingberg@ces.uwex.edu, and Watershed Coordinator, discovery.farms.prill@gmail.com, respectively, University of Wisconsin –Extension, Discovery Farms Program, PO Box 429, Pigeon Falls, WI, 54760, www.uwdiscoveryfarms.org.

Additional Information

Example walkover and map

http://www.uwdiscoveryfarms.org

The authors are solely responsible for the content of these proceedings. The technical information does not necessarily reflect the official position of the sponsoring agencies or institutions represented by planning committee members, and inclusion and distribution herein does not constitute an endorsement of views expressed by the same. Printed materials included herein are not refereed publications. Citations should appear as follows. EXAMPLE: Authors. 2015. Title of presentation. Waste to Worth: Spreading Science and Solutions. Seattle, WA. March 31-April 3, 2015. URL of this page. Accessed on: today’s date.

Anaerobic Digestion – Highlights of Successful Project Feasibility Studies


Purpose  

Feasibility studies are a form of decision-making tool that require research, data collection and analysis to evaluate investments in new technology or projects. They answer key questions about a project’s technical and financial viability, including project structure and organization and the costs, benefits, and risks involved. The analyses completed are so important that many grant programs require feasibility studies before making project grant awards. Financial investors and banks commonly may require the most rigorous form of feasibility study prior to making any investment.

What did we do?             

To develop a catalog of steps needed to perform a successful feasibility study, we reviewed the literature on feasibility studies, as well as dozens of studies done on the subject of anaerobic digestion. We also talked with a range of experts in project development.

What have we learned?

General Assessment Study or Screening—Most basic feasibility studies assess the viability of different opportunities within a defined industry or geographic area. On a project level, a general assessment determines if a potential project meets basic criteria thresholds to support more in-depth analysis?

Project-Based, Techno-Economic Study—A higher level of research and analysis is used to establish project viability. These studies consider the costs, benefits, and risks of building a specific type of project, with specific technology, on a specific site. For this purpose the study might incorporate readily available data about technology choices and make assumed adjustments about how it would perform under site-specific conditions. This level of analysis forces project advocates to put their ideas and assumptions on paper and test whether the conclusion is sound and realistic.

Investment-Grade Study—The most rigorous feasibility study is used to validate the marketability of a specific project from an investment perspective. It would look beyond basic techno-economic viability to establish the actual planned inputs and outputs of a project. It can include detailed equipment specifications and estimates, as well as detailed mass, energy, and water balance calculations. It may also identify key providers of feedstocks as well as potential end users. Detailed scheduling may be required to complete financial analyses accurately. With a detailed proforma showing financial analyses of cash flow and return on investment, this high level of feasibility study is sometimes termed “investment-grade.” These types of studies often include sensitivity analyses to explore the impact on a project’s viability from changes to one or more key assumptions. Sensitivity analyses can clarify which of the many assumptions made are most critical to project success.

Getting the best, most reliable and accurate data is perhaps the most critical element of a successful feasibility study. Typical steps observed in many feasibility studies:

  •  Define project goals and scope
  •  Establish the project criteria necessary for success
  •  Inputs: potential feedstocks from measured results, existing data, or surveys of sources
  •  Outputs, calculated from inputs: biogas, liquid and solid effluents and nutrients, and environmental attributes
  •  Financial costs: capital expenses, including cost of money, and ongoing operation and maintenance expenses
  •  Revenues (10 or more): methane energy power or fuel, surplus thermal energy, tip fees, value of solids, liquids-water, liquids-nutrients, environmental attributes, ecosystem services (e.g., GHG offsets, water quality/quantity benefits), carbon dioxide, and/or bioplastics.
  •  Cost offsets as revenues: e.g., rainwater diversion, reduction in manure handling/spreading, odor reduction, avoided disposal, etc.
  •  Financial analyses: cash flow, simple payback, EBITA (earnings before interest, taxes and amortization), net present value, return on investment, sensitivity analyses, life-cycle analyses
  •  Project finance: grants and loan guarantees, debt, and equity
  •  Project ownership and liabilities: including design, build, own, operate, maintain

Future Plans      

We will continue to evaluate methods to add value and publish the full results in a Anaerobic Digestion technology brief on this topic.

Authors    

Jim Jensen, Sr Bioenergy & Alt Fuel Specialist, Washington State University Energy Program jensenj@energy.wsu.edu

Craig Frear, Chad Kruger, and Georgine Yorgey, Center for Sustaining Agriculture and Natural Resources, Washington State University

Additional information                 

http://www.energy.wsu.edu/

http://csanr.wsu.edu/

Acknowledgements      

This research was supported by Biomass Research Funds from the WSU Agricultural Research Center; and by the Washington State Department of Commerce.

The authors are solely responsible for the content of these proceedings. The technical information does not necessarily reflect the official position of the sponsoring agencies or institutions represented by planning committee members, and inclusion and distribution herein does not constitute an endorsement of views expressed by the same. Printed materials included herein are not refereed publications. Citations should appear as follows. EXAMPLE: Authors. 2015. Title of presentation. Waste to Worth: Spreading Science and Solutions. Seattle, WA. March 31-April 3, 2015. URL of this page. Accessed on: today’s date.