How much of the nitrogen contained in dairy ration components is partitioned into milk, manure, crops and environmental N loss?

Purpose

Of the total nitrogen (N) consumed by dairy cows on confinement farms (cows fed in barns), a general range of 20% to 35% is secreted in milk and the remaining N is excreted in manure. The N contained in manure is either recycled through crops after field application, or lost to the environment. To better understand the synergistic nature of feed N and manure N management and environmental N loss from dairy farms, a series of cow, laboratory and field experiments (Figure 1) was undertaken to quantify the relative amounts of N contained in individual ration components that are secreted in milk, excreted in urine and feces, taken up by crops after manure application to soil, and lost as ammonia (NH3) and nitrous oxide (N2O) from dairy barns and soils.

What did we do?

Alfalfa silage, corn silage, corn grain and soybeans were enriched in the field with the stable isotope 15N. Each 15N-enriched component was then fed individually (soybeans were solvent-extracted and the resultant soybean meal was fed) to twelve mid-lactation cows (3 cows per 15N-enriched ration component) as part of a total mixed ration (TMR). The masses of milk, urine and feces produced by each cow were recorded and sampled during the 4 day 15N feeding period, and for 3 days thereafter. This presentation will provide information on the 15N enrichment level of each ration component, the relative amount of each consumed component’s 15N that was secreted in milk and excreted in feces and urine. We will also present the results of a field trial that measured the relative contribution of each ration component’s manure N to corn N uptake during the first and second year after manure application. We will end with explanation of some of the experimental procedures we will use for measuring gaseous N losses after manure applications to barn floors and soils.
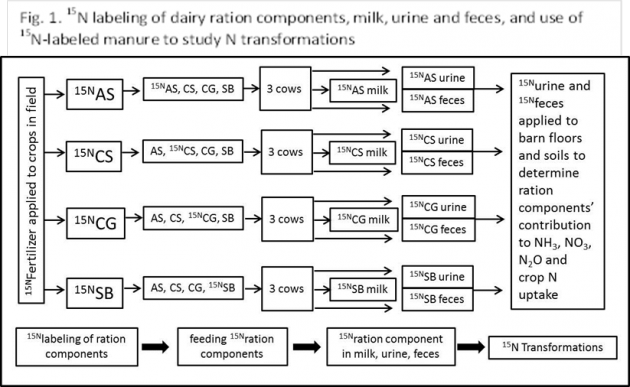
Fig. 1. 15N labeling of dairy ration components, milk, urine and feces, and use of 15N-labeled manure to study N transformations

What have we learned?

Here we present some preliminary information on 15N labeling of ration components, the TMR that was fed, and some animal responses. Concentrations of fiber, total N and 15N in the ration components are provided in Table 1.

Table. 1. Concentrations of neutral detergent fiber (NDF), total N (TN) and 15N in ration components fed to dairy cows

Highest 15N incorporation was achieved with corn (silage and grain) and lowest with alfalfa and soybean. This was due to 15N dilution by the atmospherically-fixed N by these legumes. The methods we used to ensile the 15N-enriched corn and alfalfa, the milling of 15N-enriched corn grain and the extraction of 15N-enriched soybeans to produce soybean meal did not appear to impact TMR intake, milk production or N excretion by dairy cows, as indicated by the narrow range (and non-significant differences among TMR containing the 15N-enriched components) in dry matter intake, N intake, milk production, dietary N use efficiency (relative amount of N intake secreted as milk N) and N excretion in urine, urea and feces (Table 2).
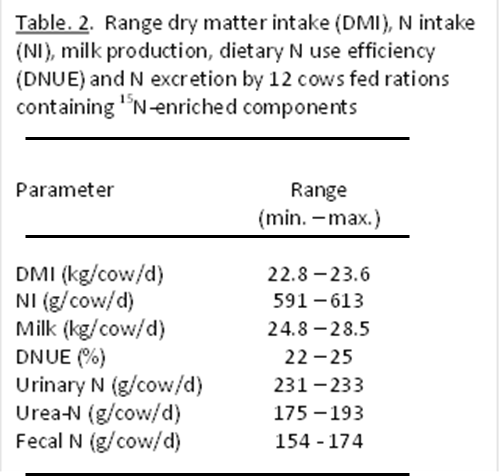
Table. 2. Range dry matter intake (DMI), N intake (NI), milk production, dietary N use efficiency (DNUE) and N excretion by 12 cows fed rations containing 15N-enriched components

Future Plans

Feces and urine from each 15N enriched ration component will be applied to laboratory emission chambers that simulate barn floors and field soil surfaces, and 15NH3, 15NH4 15NO3 and 15N2O will be measured. Manure-soil incubations, greenhouse and field trials are underway to determine each ration N component contribution to crop N uptake.

Authors

J. Mark Powell, Soil Scientist, USDA-ARS US Dairy Forage Research Center mark.powell@ars.usda.gov

Tiago Barros, Marina Danes, Matias A. Aguerre and Michel A. Wattiaux Dep. Dairy Sci., University of Wisconsin, Madison, Wisconsin USA


The authors are solely responsible for the content of these proceedings. The technical information does not necessarily reflect the official position of the sponsoring agencies or institutions represented by planning committee members, and inclusion and distribution herein does not constitute an endorsement of views expressed by the same. Printed materials included herein are not refereed publications. Citations should appear as follows. EXAMPLE: Authors. 2015. Title of presentation. Waste to Worth: Spreading Science and Solutions. Seattle, WA. March 31-April 3, 2015. URL of this page. Accessed on: today’s date.
Rotational Grazing Effects on Pasture Nutrient Content


Why Look at Rotations Grazing in Horse Pastures?

Rotational grazing is a recommended strategy to improve pasture health and animal performance. Previous studies have reported improved forage quality in rotationally grazed pastures compared to those continuously grazed by cattle, but data are limited for horse pastures.

What did we do?

A study at the University of Tennessee was conducted to evaluate the effects of rotational grazing on the nutrient content of horse pastures. A 2.02 ha rotational grazing pasture (RG) and a 2.02 ha continuous grazing pasture (CG) were each grazed by three adult horses at a stocking rate of 0.6 ha/horse over a two year period. The RG system was divided into four 0.40 ha paddocks and a heavy use area. Pastures were maintained at uniform maximum height of 15 to 20 cm by mowing. Horses were rotated between the RG paddocks every 10 to 14 d, or when forage was grazed to a height of approximately 8 cm. Pasture forage samples (n = 520) were collected and composited monthly (n = 14) during the growing season (April to November) by clipping forage from randomly placed 0.25 m2 quadrates from RG and CG, as well as before and after grazing each RG paddock. Botanical composition and percent ground cover were visually assessed. Forage samples were oven dried at 60°C in a forced air oven for 72 h to determine DM. Forage biomass yield (kg/ha), digestible energy (DE, Mcal/kg), crude protein (CP), acid detergent fiber (ADF), neutral detergent fiber (NDF), lignin, calcium (Ca), phosphorous (P), potassium (K), magnesium (Mg), ash, fat, water soluble carbohydrates (WSC), sugar and fructan were measured using a FOSS 6500 near-infrared spectrometer. Data were analyzed using paired T-tests and differences were determined to be significant at P < 0.05. Data are reported as means ± SEM as a percent of DM.

What have we learned?

Table 1. Nutrient content of continuously grazed (CG) pasture and rotationally grazed (RG) pasture. Data are summarized as means ± SE.
Nutrient Continuous Rotational
DM, % 91.72 ± 0.36 91.89 ± 0.34
DE, Mcal/kg 2.31 ± 0.064 2.42± 0.039*
CP, % 14.92 ± 0.77 15.79 ± 0.64
ADF, % 33.16 ± 1.21 30.81 ± 0.82*
NDF, % 56.80 ± 1.75 53.53 ± 1.65*
Lignin, % 3.47 ± 0.38 2.88 ± 0.32*
Ca, % 0.69 ± 0.11 0.68 ± 0.11
P, % 0.25 ± 0.009 0.27 ± 0.008*
K, % 1.92 ± 0.10 2.11 ± 0.087*
Mg, % 0.25 ± 0.009 0.26 ± 0.007
Ash, % 9.35 ± 0.83 9.39 ± 0.66
Fat, % 2.65 ± 0.12 2.83 ± 0.08
WSC, % 4.95 ± 0.60 6.72 ± 0.71*
Sugar, % 3.33 ± 0.50 4.86 ± 0.55*
Fructan, % 1.61 ± 0.15 1.59 ± 0.16
*means within rows differ; P < 0.05

Forage biomass yield did not differ between RG and CG (2,125 ± 52.2; 2,267 ± 72.4 kg/ha, respectively). The percentage of grass species was greater in RG compared to CG (81.7 ± 3.9; 73.9 ± 4.5, respectively) and the percentage of weed species was lower in RG compared to CG (3.4 ± 0.8; 12.0 ± 1.5, respectively). Tall fescue, kentucky bluegrass, bermudagrass and white clover were the dominant forage species. Rotational grazing increased forage quality compared to continuous grazing. The RG system was higher in DE (Mcal/kg), phosphorous (P), potassium (K), water soluble carbohydrates (WSC), and sugar compared to the CG system (Table 1). While there wasn’t a significant difference in crude protein (CP) content between RG and CG, the numerical difference could potentially affect animal performance. The RG pasture was lower in acid detergent fiber (ADF), neutral detergent fiber (NDF) and lignin compared to the CG pasture. Within the RG pasture, forage nutrient content declined following a grazing period, but recovered with rest. Paddocks were lower in DE, CP, P, K, Fat, WSC and sugar while they were higher in ADF and NDF after grazing compared to before grazing (Table 2).

Table 2. Nutrient content of rotational grazing (RG) paddocks before and after grazing. Data are summarized as means ± SE.
Nutrient Before After
DM, % 91.84 ± 0.27 91.84 ± 0.39
DE, Mcal/kg 2.34 ± 0.03 2.21 ± 0.02*
CP, % 14.98 ± 0.39 13.71 ± 0.43*
ADF, % 32.24 ± 0.54 34.33 ± 0.48*
NDF, % 55.97 ± 0.88 59.24 ± 0.89*
Lignin, % 2.79 ± 0.20 3.41 ± 0.25*
Ca, % 0.58 ± 0.05 0.59 ± 0.05
P, % 0.28 ± 0.004 0.25 ± 0.006*
K, % 2.11 ± 0.08 1.72 ± 0.07*
Mg, % 0.26 ± 0.007 0.26 ± 0.009
Ash, % 8.76 ± 0.19 8.79 ± 0.21
Fat, % 2.64 ± 0.05 2.45 ± 0.06*
WSC, % 6.05 ± 0.47 4.85 ± 0.39*
Sugar, % 4.40 ± 0.38 3.22 ± 0.30*
Fructan, % 1.67 ± 0.15 1.69 ± 0.16
*means within rows differ; P < 0.05

Future Plans

Rotational grazing may be a preferred alternative to continuous grazing as it favors grass production, suppresses weeds and increases energy and nutrient content of pastures. While rotational grazing may be beneficial from an environmental and animal production standpoint, an increase in DE and WSC may pose a risk for horses prone to obesity and metabolic dysfunction. Appropriate precautions should be taken in managing at risk horses under rotational grazing systems. This work is being continued at Virginia Tech and other universities to further understand the use of rotational grazing systems for horses.

Authors

Bridgett McIntosh, Equine Extension Specialist, Virginia Tech bmcintosh@vt.edu

Matt Webb, Ashton Daniel, David McIntosh and Joe David Plunk, University of Tennessee

Additional information

http://www.arec.vaes.vt.edu/middleburg/

Acknowledgements

The authors thank the University of Tennessee Middle Tennessee Research and Education Center and the Tennessee Department of Agriculture’s Nonpoint Source Pollution 319 Water Quality Grant for their support of this project.

The authors are solely responsible for the content of these proceedings. The technical information does not necessarily reflect the official position of the sponsoring agencies or institutions represented by planning committee members, and inclusion and distribution herein does not constitute an endorsement of views expressed by the same. Printed materials included herein are not refereed publications. Citations should appear as follows. EXAMPLE: Authors. 2015. Title of presentation. Waste to Worth: Spreading Science and Solutions. Seattle, WA. March 31-April 3, 2015. URL of this page. Accessed on: today’s date.

Evaluation of Feed Storage Runoff Water Quality and Recommendations on Collection System Design

Why Study Silage Leachate?

Silage storage is required for many livestock and poultry facilities to maintain their animals throughout the year.  While feed storage is an asset which allows for year round animal production systems, they can pose negative environmental impacts due to silage leachate and runoff.  Silage leachate and runoff have high levels of oxygen demand and nutrients (up to twice the strength of animal manure), as well as a low pH posing issues to surface waters when discharged.  Although some research exists which shows the potency of silage leachate and runoff, little information is available to guide the design of collection, handling, and treatment facilities to minimize the impact to water quality.  Detailed information to characterize the strength of the runoff through a storm is needed to develop collection systems which segregate runoff to the appropriate handling and treatment system based on the strength of the waste. 

What did we do?

In order to evaluate collection designs, we evaluated six bunker silage storage systems in Wisconsin.  Runoff from these systems was collected using automated samplers throughout one year to assess water quality for nutrients (nitrogen and phosphorus species), oxygen demand, total solids, and pH.  Flow rate for each system was also recorded along with weather data including precipitation information.  Feed quantity and quality was also recorded at each site to have a better understanding of the impact of silage management on water quality.  Data was analyzed to determine flow weighted average runoff concentrations for pollutants measured, seasonality and feed impacts to water quality, storage design impacts, the presence or absence of first flush conditions, total loading, and evaluated to make collection design recommendations.

What have we learned?

Flow rate, timing of ensiling of forage, site bunker design, and amount of litter present were determined to influence silage runoff concentrations.  Leachate collection played a significant role in water quality as the runoff from the site without leachate collection had a lower average pH (4.64) and higher COD values (5,789 mg L-1) than the sites with leachate collection (6.09 and 5.54 pH, and 1,296 and 3,318 mg L-1 COD).  Nutrients were also higher for the site without leachate collection TP (83 mg L-1), NH3 (68 mg L-1), and TKN (222 mg L-1) compared to TP (29 and 63 mg L-1), NH3 (25 and 48 mg L-1), and TKN (184 and 215 mg L-1) for the sites with leachate removal. Time of ensilage also played an important role in water quality with increased losses occurring within two weeks of ensilage.  The most important finding for the design of treatment systems was that the water quality parameters (including nutrients) were found to be negatively correlated with flow.   The resulting effect is that the storms hydrograph has a significant impact on the pollutant loading to the surrounding waterways.  It was also found that loading was relatively linear throughout each storm event indicating that there is no first flush phenomenon which is found to occur with urban runoff systems.  Therefore designing systems to collect the initial runoff from a system is not an efficient way to capture the greatest pollutant load.  It was found that low flows throughout a storm have high pollutant concentrations and collecting low flows throughout a storm would result in the greatest load collected per unit volume.

Future plans

The next phase of this research will be to develop loading recommendations to filter strips for sizing and minimizing impact to the environment.

Corresponding author

Rebecca Larson, Assistant Professor and Extension Specialist, Biological Systems Engineering, University of Wisconsin-Madison ralarson2@wisc.edu

Mike Holly, Eric Cooley, Aaron Wunderlin

Additional information

Published paper is currently in review and will be available within the next year.

Acknowledgements

Wisconsin Discovery Farms

Case Study of Contaminated Compost: Collaborations Between Vermont Extension and the Agency of Agriculture to Mitigate Damage Due to Persistent Herbicide Residues

Why Study Herbicide Contamination of Compost?

Picloram, clopyralid, aminopyralid and aminocyclopyrochlor are broadleaf herbicides commonly used in pastures due to effectiveness in controlling undesirable plants and the very low toxicity for animals and fish. In fact, some of these herbicides do not require animal removal post application. The grazing animals can ingest treated leaves with no ill health effects, but may pass the herbicides through to the manure. Also see: Composting Livestock or Poultry Manure

When a complaint driven problem of damaged tomatoes and other garden crops in Vermont was traced back to a single compost provider in Chittenden County in Vermont, a series of actions and reactions commenced. Complaints were fielded and investigated by personnel from the Vermont Agency of Agriculture, Food and Markets (VT-AG) and the University of Vermont Extension (UVM-EXT). The compost provider sent samples of various components of the compost to a single laboratory and received positive results for persistent herbicides in sources of equine bedding/manure components. Subsequent interviews by the facility manager in both print and television media seemed to cast blame on Vermont equine operations for ruining Vermont gardens. Coincidentally, the composter had recently changed compost-processing methods. Initial samples sent to a separate laboratory did not support the composter’s laboratory results. Samples of feed, manure, shavings, and many other components which were shipped to several laboratories by VT-AG, resulted in extremely inconsistent and/or contradictory data between laboratories running the exact same samples.

Related: Small Farm Environmental Stewardship or Managing Manure on Horse Farms

What did we do? 

Several processes were underway by several agencies in a coordinated and collaborative effort to resolve and mitigate the herbicide issues:

• Vermont Agency of Agriculture, Food and Markets was receiving and investigating complaints.

• University of Vermont Extension plant biology personnel were identifying, documenting, and sampling affected plants, as well as counseling gardeners.

• University of Vermont equine extension worked with horse owners and media to mitigate unsubstantiated claims of “horses poisoning garden plants”.

• A more thorough investigation by VT-AG involved collection of raw samples (feed, hay, shavings, manure) from 15 horse farms who utilized the compost facility to dispose of manure and bedding.

• The VT Secretary of Agriculture and the VT-AG Agri-chemical Management Section Chief were brought together with equine and compost experts attending the NE-1041 Equine Environmental Extension Research group annual meeting hosted by UVM equine extension.

• VT-AG worked with herbicide manufacturers to use high quality testing equipment and procedures to gather consistent data from samples.

What have we learned? 

More extensive details of this particular case have been published in the Journal of NACAA (http://www.nacaa.com/journal/index.php?jid=201).

• The levels of persistent herbicides were low enough that they were below the acceptable limits for water, yet they still harmed sensitive garden plants.

• Nationally and locally manufactured grains tested positive for persistent herbicides; most likely due to the individual components being treated within legal limits during field production.

• Many of the laboratories were unable to provide accurate or consistent results when testing for the persistent herbicides.

• Discussions between the NE-1041 group and VT-AG resulted in a fruitful exchange of information, as well as development and delivery of pertinent information for the general public and County Agricultural Agents.

Future Plans 

Several proactive activities have already been initiated and/or completed. A peer reviewed case study on all aspects of the contaminated compost has been published in the Journal of NACAA; and two episodes of Vermont’s Agricultural television show (Across the Fence) were created to educate and update the general public on the situation. A Vermont compost working group has been assembled and set goals to create potential educational materials including a horse owner pamphlet (in final editing phase), a farmer/livestock pamphlet, and press releases for the public education on challenges with persistent herbicides. The VT-AG website has a Compost FAQs page addressing the most common questions associated with compost and herbicides.

Authors

Betsy Greene, Professor/Extension Equine Specialist, University of Vermont Betsy.Greene@uvm.edu

Carey Giguere, Agrichemical Management,Vermont Agency of Agriculture

Rebecca. Bott, Extension, South Dakota State University

Krishona. Martinson, Extension, University of Minnesota

Ann Swinker, Extension, Penn State University

Additional information

• Greene, E.A., R.C. Bott, C. Giguere, K.L. Martinson, and A.W. Swinker. 2013. “Vermont Horses vs. Twisted Tomatoes: A Compost Case Study. J of NACAA. 6:1 (http://www.nacaa.com/journal/index.php?jid=201)

• Vermont Agency of Agriculture, Food and Markets Compost FAQ’s: http://agriculture.vermont.gov/node/696

• Davis, J. Dept. of Horticultural Science, NC State University. 2010. Herbicides in Manure: How Does It Get there and why Should I Care?, Proceedings 8th Annual Mid-Atlantic Nutrition Conference, Timonium, MD. pp 155-160.

• Across the Fence Television Show: An Update on Green Mountain Compost Contamination and Testing-Greene/ Gigliuere (9/14/12)

• Across the Fence Television Show: Information from NE 1041 Meetings and National Equine Specialists-Greene (9/17/12)

• Article from Minnesota Extension explaining the problem in hay and how to avoid it. The article is devoted to “ditch hay”, but the information is relevant to all hay. https://extension.umn.edu/horse-nutrition/managing-herbicides-ditch-forages

• Washington State University Web site on clopyralid carryover includes pictures of affected vegetables, research results, and the bioassay protocol http://www.puyallup.wsu.edu/soilmgmt/Clopyralid.htm

• Dow Agrosciences United Kingdom website with information on aminopyralid: http://www.manurematters.co.uk/

• CDMS Agro-chemical database with access to all the herbicide labels: http://www.cdms.net/LabelsMsds/LMDefault.aspx?t

Acknowledgements

The State University Extension Equine Specialists that make up the NE-1441: Environmental Impacts of Equine Operations, Multi-State Program. USDA.

The authors are solely responsible for the content of these proceedings. The technical information does not necessarily reflect the official position of the sponsoring agencies or institutions represented by planning committee members, and inclusion and distribution herein does not constitute an endorsement of views expressed by the same. Printed materials included herein are not refereed publications. Citations should appear as follows. EXAMPLE: Authors. 2015. Title of presentation. Waste to Worth: Spreading Science and Solutions. Seattle, WA. March 31-April 3, 2015. URL of this page. Accessed on: today’s date.
Reducing the Costs and Environmental Footprint of Pig Diets with the Experimental Optimum Synthetic Amino Acid Inclusion


Why Look at Reducing Crude Protein in Pig Diets

Nitrogen (N2) compounds from swine feces and urine are oxidized and reduced by soil and air, whereas some N2 is released into the atmosphere as nitrous oxide (N2O). Research has demonstrated that reducing crude protein (CP) and maximizing synthetic amino acids (SAA) in swine diets can reduce N2 excretion. Thus, there is strong push for more sustainable production of soy or replacement with other protein sources.

The preliminary cost and environmental evaluation showed that pig diets with higher amounts of SAAs have higher cost, climate change impact (CCI), and water depletion (WD) than the typical US diet defined. This is due to the increased amounts of corn in a diet. Thus, a list of alternative energy and protein feed ingredients were tested in WUFFDA with the goal to replace corn and further reduce the amount of soybean meal in pig diets.

What did we do? 

Windows-based User Friendly Feed Formulation (WUFFDA) linear models were used to formulate single-objective least cost and least environmental footprint pig. Control diet is a typical soybean-corn formulation which was used as a baseline to evaluate cost and environmental footprint of an alternate diet. The test diet is a reduced crude protein diet with max 0.75% added Lysine-HCL in nursery and max 0.56 % added Lysine-HCL grower-finisher phases. We also added the US pig industry top 80 most used feed ingredients to the WUFFDA. Nutrient characteristics, inclusion limits, environmental footprint, and cost data for feed ingredients were obtained from the US Animal Feed Database and incorporated into WUFFDA models.

What have we learned? 

It was found that reduction in cost of a diet formulation can be achieved by omitting the use of milk whey powder (nursery phase). Replacing corn with wheat middlings could reduce cost and CCI. CCI can be reduced by use of corn gluten meal, and corn gluten feed (grow phases).

Future Plans 

The projected diets will be further investigated for nutrient constraints, validated through PPEC, and Simapro 8.1. life cycle assessment (LCA) model as well as with other experts such as nutritionists and economists. The projected diets will be will be available in the Pig Production Environmental Calculator (PPEC).

Authors

Jasmina Burek, Research Associate, University of Arkansas jburek@uark.edu

Greg Thoma, Jennie Popp, Charles Maxwell, Rick Ulrich

Additional information 

Pig Production Environmental Calculator:

http://www.pork.org/production-topics/environmental-sustainability-effor…

Life-Cycle Assessment Modeling for the Pork Industry:

https://lpelc.org/life-cycle-assessment-modeling-for-the-pork-industry

National Pork Board (2015) Carbon Footprint of Pork Production Calculator – Pork Checkoff.

Pesti G, Thomson E, Bakalli R, et al. (2004) Windows User-Friendly Feed Formulation (WUFFF DA) Version1.02.

PRé Consultants (2014) SimaPro 8.3. 4555022.

Acknowledgements

This research is part of the program “Climate Change Mitigation and Adaptation in Agriculture,” and is supported by Agriculture and Food Research Initiative Competitive Grant no. 2011-68002-30208 from the USDA National Institute of Food and Agriculture.

The authors are solely responsible for the content of these proceedings. The technical information does not necessarily reflect the official position of the sponsoring agencies or institutions represented by planning committee members, and inclusion and distribution herein does not constitute an endorsement of views expressed by the same. Printed materials included herein are not refereed publications. Citations should appear as follows. EXAMPLE: Authors. 2015. Title of presentation. Waste to Worth: Spreading Science and Solutions. Seattle, WA. March 31-April 3, 2015. URL of this page. Accessed on: today’s date.
Feeding Strategies to Mitigate Cost and Environmental Footprint of Pig Production in the US

The livestock sector is one of main drivers of the environmental footprint. Animal feed is a key to sustainable meat production. Researchers are looking for environmentally sustainable feeding strategies that will lower diet cost, agricultural use of land, water depletion, and climate change impact. We used linear models to formulate 4 single-objective diets including least-cost, least-land use, least-water depletion, and least-climate change impact diets. Preliminary results showed that the use of wheat and wheat middlings hold potential to reduce pig diet cost and the environmental footprint.

Purpose

Demand for sustainable food, which conserves the environment and meets the needs of human development and increasing population, is growing (SCAR 2014). Livestock production is one of the major causes of the world’s environmental impacts including agricultural land use, water depletion, and climate change impact (PEW Commission on Industrial Farm Animal Production 2010). Feeding is the most important factor in livestock production cost and animal performance which includes growth, nutrition, health, sustainability, and productivity. Farmers are interested in producing animals with a better performance and need feeding strategies that will lower diet costs and conserve resource use (land and water). The objective of this study is to develop cost-effective diet formulations and mitigate the environmental footprint of pig production in the US.

What did we do?

Figure 1. Preliminary grow phase single-objective pig diets including typical US, least-cost, least-climate change impact, least-water depletion, and least-land use. Legend should be read left to right and top to bottom.

Figure 1. Preliminary grow phase single-objective pig diets including typical US, least-cost, least-climate change impact, least-water depletion, and least-land use. Legend should be read left to right and top to bottom.

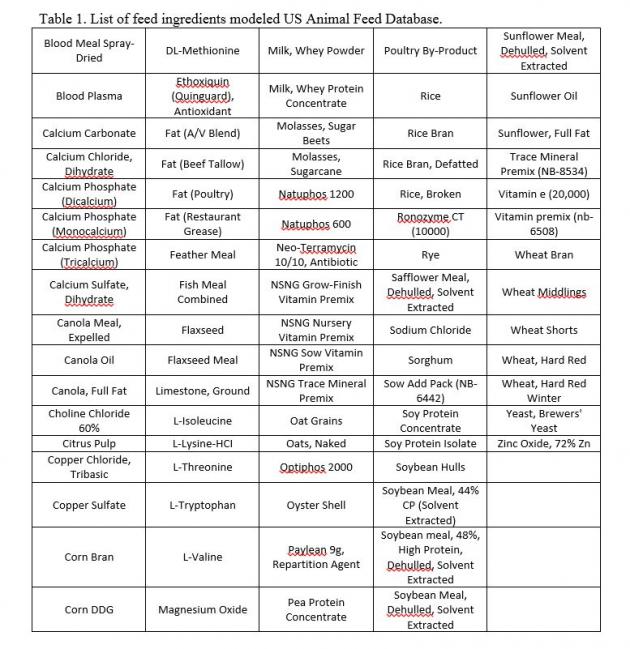
Windows-based User Friendly Feed Formulation (WUFFDA) linear models are used to formulate single-objective pig diets including least-cost, least-water use, least-land use, and least-climate change impact diets (Figure 1) (Pesti et al. 2004). Models include typical feed ingredients and additional US pig industry top 50 used protein and energy feed ingredients (Table 1 and 2). Nutrient characteristics, inclusion limits, environmental footprint, and cost data for feed ingredients were obtained from the US Animal Feed Database  and incorporated into WUFFDA models (Burek et al. 2014). Theoretical diets are compared against typical US pig multi-phase diets which were obtained from a nutritionist (Figure 1).

Table 1. Typical feed ingredients in US pig diets.

Blood Plasma

L-Valine

Copper Sulfate

Milk, Lactose

Corn DDG

Milk, Whey Powder

Corn, Yellow Dent

Neo-Terramycin

Dicalcium Phosphate

Paylean

DL-Methionine

Potassium Sulfate

Ethoxiquin

Poultry By-Product

Fat (Poultry)

Ronozyme

Fish Meal

Sodium Chloride

Limestone, Ground

Soybean meal, 48%

L-Isoleucine

Trace Mineral Premix

L-Lysine-HCI

Vitamin premix

L-Threonine

Zinc Oxide

L-Tryptophan


Table 2. Top 50 protein and energy feed ingredients in US pig diets.

Alfalfa Meal

Oat Grains

Barley

Oyster Shell

Beet Pulp

Pea Protein Concentrate

Blood Meal Spray-Dried

Peas, Field Peas

Canola Meal, Expelled

Rice

Canola Oil

Rice Bran

Canola, Full Fat

Rice, Broken

Citrus Pulp

Rye

Corn Bran

Safflower Meal

Corn Gluten Feed

Sorghum

Corn Gluten Meal

Soy Protein Concentrate

Cotton Seed Meal

Soy Protein Isolate

Fat (A/V Blend)

Soybean Hulls

Fat (Beef Tallow)

Soybean Meal, 44%

Fat (Restaurant Grease)

Soybean Oil

Feather Meal

Soybean Seeds, Heat Processed

Flaxseed

Soybeans, High Protein, Full Fat

Flaxseed Meal

Sunflower Meal

Meat and Bone Meal

Sunflower, Full Fat

Milk, Casein

Wheat Bran

Milk, Whey Permeate

Wheat Middlings

Milk, Whey Protein Concentrate

Wheat Shorts

Molasses, Sugar Beets

Wheat, Hard Red

Molasses, Sugarcane

Wheat, Hard Red Winter

What have we learned?

The US producers use corn and soybean meal as a base for pig diets (Figure 1). The single-objective modeling shows that more sustainable and cost-effective diets can be formulated by diversifying protein and energy sources. For example, preliminary theoretical single-objective diets for one pig growing phase show that the use of wheat and wheat middlings may reduce multiple objectives (Figure 1). The least-cost diet includes wheat, sorghum, wheat middlings, and corn distillers grains (Figure 1). Wheat, wheat middlings, soybeans, soybean hulls, corn distillers grains are the main ingredients in the least-climate change impact diet (Figure 1). The least-water depletion diet includes wheat middlings, corn distillers grains, and canola meal (Figure 1). The least-land use includes corn distillers grains, wheat, rice bran, and corn gluten feed (Figure1). Theoretical diets serve as guidelines to develop realistic sustainable cost-effective pig diets that pig producers will be able to incorporate into their production system. 

Future Plans

The results presented in this manuscript are preliminary. Formulated diets will be analyzed using the Pig Environmental Calculator (PPEC) and Simapro 8.1 life cycle assessment (LCA) pig production model (PRé Consultants 2014; National Pork Board 2015). The PPEC calculates the actual amount of feeds and total costs (National Pork Board 2015). The Simapro 8.3 cradle-to-farm gate pig production life-cycle assessment model calculates environmental impacts of pig production (PRé Consultants 2014).

Animal feed availability, pig production practices, and environmental footprints vary for pig production regions in the US. Feed costs are dynamic including costs and geography. The intention is to develop pig diets for different pig production regions in the US. Thus, further research will focus on multi-objective analyses to evaluate potential to reduce simultaneously cost and environmental footprints under different constraints. We will verify results with nutritionists, economists, and other experts. The pig producers will have access to formulated diets through PPEC.

Authors

Jasmina Burek, Research Associate, University of Arkansas jburek@uark.edu

Greg Thoma, Jennie Popp, Charles Maxwell, Rick Ulrich

Additional information

Pig Production Environmental Calculator
Life-Cycle Assessment Modeling for the Pork Industry

References

Burek J, Thoma G, Popp J, et al. (2014) Developing Environmental Footprint, Cost, and Nutrient Database of US Animal Feed Ingredients.

National Pork Board (2015) Carbon Footprint of Pork Production Calculator – Pork Checkoff.

PEW Commission on Industrial Farm Animal Production (2010) Environmental Impact of Industrial Farm Animal Production.

PRé Consultants (2014) SimaPro 8.3.

SCAR (2014) Sustainable food. http://ec.europa.eu/environment/eussd/food.htm.

Acknowledgements

This research is part of the program “Climate Change Mitigation and Adaptation in Agriculture,” and is supported by Agriculture and Food Research Initiative Competitive Grant no. 2011-68002-30208 from the USDA National Institute of Food and Agriculture.

The authors are solely responsible for the content of these proceedings. The technical information does not necessarily reflect the official position of the sponsoring agencies or institutions represented by planning committee members, and inclusion and distribution herein does not constitute an endorsement of views expressed by the same. Printed materials included herein are not refereed publications. Citations should appear as follows. EXAMPLE: Authors. 2015. Title of presentation. Waste to Worth: Spreading Science and Solutions. Seattle, WA. March 31-April 3, 2015. URL of this page. Accessed on: today’s date.

Environmental Footprint, Cost, and Nutrient Database of the US Animal Feed Ingredients


Poster presentation BurekWhy Look at Feed Ingredients and Environmental Footprint?

The US Pig Production Environmental Calculator (PPEC) was built upon cradle-to-farm-gate life-cycle assessment (LCA) of pork production combined with the US National Resource Council (NRC 2012) swine nutrient requirements models (NRC 2012), farm operation inputs, and animal feed database. The purpose of the US Animal Feed Database is to compile environmental, economic, and nutrient content of animal feed ingredients in a single location and integrate it into a PPEC economic model of swine operations. (Click on image at right to view a handout of the poster).

What did we do?

We collected data from different sources including NRC (2012) feed nutrient characteristics, Feedstuffs (2014) for feed prices, US agricultural and product LCA models built in SimaPro 7.3.3 (PRé Consultants 2011) and LCA databases (Swiss Centre for Life Cycle Inventories 2010; EarthShift 2011; Blonk Consultants 2014) for environmental footprints. Table 1 shows a list of top US pig feed ingredients.

What have we learned?

list in us databaseFeed ingredients with highest costs are additives (e.g. paylean) and amino acids. Milk by-products have the largest climate change impact, water and land use.
Future Plans

The information from this database will be used as a starting point for identifying potential mitigation options in pig diet formulation. The database will be updated as new information becomes available.

Authors

Jasmina Burek, Research Associate, University of Arkansas jburek@uark.edu

Greg Thoma, Jennie Popp, Charles Maxwell, Rick Ulrich

Additional information

National Pork Board (2015) Carbon Footprint of Pork Production Calculator – Pork Checkoff.
Pesti G, Thomson E, Bakalli R, et al. (2004) Windows User-Friendly Feed Formulation (WUFFF DA) Version1.02.
PRé Consultants (2014) SimaPro 8.3. 4555022.

Pig Production Environmental Calculator
Life-Cycle Assessment Modeling for the Pork Industry

Acknowledgements

This research is part of the program “Climate Change Mitigation and Adaptation in Agriculture,” and is supported by Agriculture and Food Research Initiative Competitive Grant no. 2011-68002-30208 from the USDA National Institute of Food and Agriculture.

The authors are solely responsible for the content of these proceedings. The technical information does not necessarily reflect the official position of the sponsoring agencies or institutions represented by planning committee members, and inclusion and distribution herein does not constitute an endorsement of views expressed by the same. Printed materials included herein are not refereed publications. Citations should appear as follows. EXAMPLE: Authors. 2015. Title of presentation. Waste to Worth: Spreading Science and Solutions. Seattle, WA. March 31-April 3, 2015. URL of this page. Accessed on: today’s date.

Waste to Worth 2013-Feed Management

W2W13 proceedings | Waste to Worth home
On this page: Dairy Cattle | Feeding and Rations | Beef Feedlot

Dairy Cattle Feeding & Rations Beef Feedlot

Sustainable Dairy Cropping Systems

Dairy Cow Ration Impacts Manure Chemistry and the Environment

Feed Management Planners Certification Program

Integrating Manure into Feed Ration Optimization

Distiller’s Grains Effects on Sulfur Emissions

BFNMP: A Tool for Feedlot Manure Economics


Environmental Protection Agency (EPA) Perspective on Nutrient Pollution

Waste to Worth: Spreading science and solutions logoWaste to Worth home | More proceedings….

Why Discuss Regulations and Nutrient Pollution?

Provide EPA’s perspective on nutrient pollution and encourage an open dialogue to help address this problem which is rapidly becoming one of the most challenging environmental problems that we face.

What Did We Do?

Although nutrients, nitrogen and phosphorus in particular, are essential for aquatic life, too many nutrients can create significant problems for our nation’s lakes, streams, and coastal waters.  Nutrient pollution can degrade habitat for fish and wildlife, render water bodies unsafe for swimming and other forms of contact recreation, create a public health concern for drinking water supplies, decrease property values, and negatively impact local economies.  According to national statistics, more than 45% of streams have medium to high levels of nutrients, approximately four million lake acres have been identified as threatened or impaired, and approximately 78% of assessed coastal areas exhibit signs of eutrophication.

Nutrients can be transported great distances and impact areas far downstream.  One of the more prominent examples in the United States is the Gulf of Mexico “dead zone,” which can be larger than the state of Connecticut in some years.  The term “dead zone” refers to waters that have been so heavily impacted by nutrient pollution that oxygen levels are depleted to the point where most aquatic life cannot survive.  Nutrients are transported to the Gulf of Mexico via tributaries of the Mississippi River from as far away as Montana in the west and Pennsylvania in the eastern portion of this large watershed.

Nutrient pollution is not restricted to the Mississippi River Basin or any one region of the country.  Nutrient pollution is widespread, impacting waters across the nation.  As we learn more about the impacts of nutrient pollution, especially the potential for some species of algae to produce toxins that can be harmful to both people and animals, states are becoming more aggressive in reducing sources and even posting health advisories when necessary.

So, what has EPA been doing to address nutrient pollution?

  1. Providing states with technical assistance and other resources to help develop water quality criteria for nitrogen and phosphorus;
  2. Working with states to identify waters impaired by nutrients and developing restoration plans;
  3. Awarding grants to states to address pollution from nonpoint sources, such as agriculture and storm water runoff;
  4. Administering a permit program designed to reduce the amount of nitrogen and phosphorus discharged to the environment from point sources;
  5. Providing funding for the construction and upgrade of municipal wastewater treatment plants;
  6. Working with states to reduce nitrogen oxide emissions from air sources;
  7. Conducting and supporting extensive research on the causes, impacts, and best approaches to  reduce nutrient pollution; and
  8. Increasing collaboration with other federal partners (e.g., USDA) to leverage financial and technical resources.

And although progress has been made over the past decade, much more is needed.  Realizing a need for greater action, In March 2011, EPA issued a memorandum titled “Working in Partnership with States to Address Phosphorus and Nitrogen Pollution through Use of a Framework for State Nutrient Reductions.”  This memo emphasized that nutrient pollution continues to have the potential to become one of the costliest and most challenging environmental problems that we face and reaffirmed the agencies commitment to partner with states and stakeholders to make greater progress in reducing nutrient loading to our nation’s waters.  If you have not already done so, please join us in protecting and restoring our nation’s waters.  For more information visit EPA’s nutrient pollution website at http://www.epa.gov/nutrientpollution/.

Author

Alfred Basile, Biologist, US Environmental Protection Agency Region 8, basile.alfred@epa.gov

Additional Information

www.epa.gov/nutrientpollution

The authors are solely responsible for the content of these proceedings. The technical information does not necessarily reflect the official position of the sponsoring agencies or institutions represented by planning committee members, and inclusion and distribution herein does not constitute an endorsement of views expressed by the same. Printed materials included herein are not refereed publications. Citations should appear as follows. EXAMPLE: Authors. 2013. Title of presentation. Waste to Worth: Spreading Science and Solutions. Denver, CO. April 1-5, 2013. URL of this page. Accessed on: today’s date.


Ammonia Emissions and Emission Factors: A Summary of Investigations at Beef Cattle Feedyards on the Southern High Plains

Waste to Worth: Spreading science and solutions logoWaste to Worth home | More proceedings….

Why Study Ammonia Emitted from Feedlots?

Ammonia volatilization is a major component of the nitrogen balance of a feedyard, and the effects of ammonia loss range from the economic (loss of manure fertilizer value) to the environmental (air quality degradation, overfertilization of ecosystems). Although not yet regulated, ammonia emissions from cattle are required to be reported under the Emergency Planning and Community Right to Know Act. Emission factors are used to estimate ammonia emissions for purposes of reporting and national inventories, but current emission factors are based on limited data. Our objective was to definitively quantify ammonia emissions and emission factors from commercial feedyards on the southern High Plains of Texas.

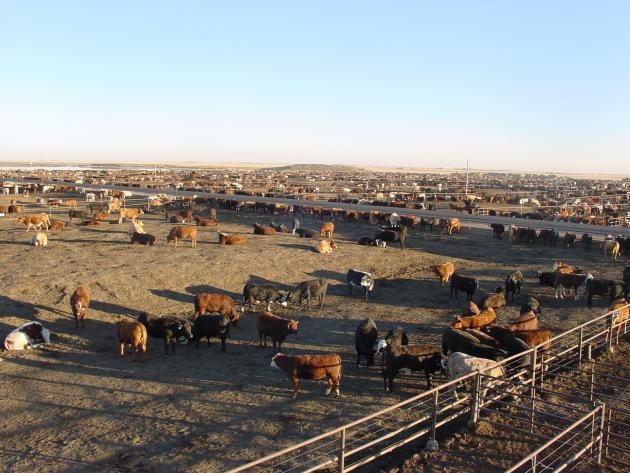
A typical feedyard on the High Plains of Texas. In the foreground, cattle in corrals with a stocking density of about 150 sq. ft./animal. In the background on the left, the runoff water retention pond, and center, a mound of stockpiled manure.

What Did We Do?

Ammonia emissions were quantified at three commercial feedyards in the Texas Panhandle from 2002 to 2008 using micrometeorological methods. Seasonal, intensive measurement campaigns were conducted from 2002 to 2005 at one feedyard, and ammonia emissions were near-continously monitored from 2007-2008 at two more feedyards. Meteorological and cattle management data were also collected.

What Have We Learned?

Ammonia emissions followed a distinct annual pattern. Emissions during summer were about twice those during winter, while spring and autumn emissions were intermediate. Annualized ammonia emissions ranged from 0.20 to 0.37 lb NH3/animal/day, and averaged 0.26 lb NH3/animal/day over all studies. Ammonia loss as a fraction of nitrogen fed to cattle averaged 41% during winter and 69% during summer; on an annual basis, 54% of fed nitrogen was lost as ammonia. Greatest emissions were observed when crude protein in cattle rations exceeded the nutrient requirements of beef cattle. Mean monthly ammonia emissions were strongly correlated with mean monthly temperature, and the relationship can be used to predict ammonia emissions from southern High Plains feedyards. Cattle feeders that meet recommended crude protein in rations can expect to lose half of fed N as ammonia. We recommend an annual emission factor of 88 lb/head for beef cattle feedyards based on one-time capacity, or 39 lb/head fed, based on a 150-d feeding period.

The annual pattern of ammonia emission rates (ER) followed seasonal temperatures, but also was sensitive to dietary crude protein (CP). Adding distillers grains to rations from March, 2008 to October, 2008 increased crude protein at Feedyard A to as high as 19%. Ammonia emissions greatly increased compared with the previous year and compared with Feedyard E.

Future Plans

Next steps involve using the extensive database from this research to adapt and refine process-based models of ammonia emissions. These models, based on the actual physical and chemical processes that control ammonia loss, will be more generally applicable than emission factors to a wider range of feedyards.

On an annual basis, ammonia emission averaged 0.26 lb per animal per day across the three feedyards and six years of study. Increased ammonia emission at Feedyard A in 2008 was due to high dietary crude protein when distillers grains were added to rations. Using these data and other estimates of ammonia loss from retention ponds and stockpiles, we recommend, for beef cattle fed a diet that meets protein requirements, an annual emission factor of 88 lb/head based on one-time capacity, or 39 lb/head fed, based on a 150-d feeding period.

Authors

Richard W. Todd, Research Soil Scientist, USDA-ARS Conservation and Production Research Laboratory, Bushland, Texas, richard.todd@ars.usda.gov

Richard W. Todd, Research Soil Scientist; N. Andy Cole, Research Leader and Research Animal Scientist (Nutrition); and Heidi M. Waldrip, Research Soil Scientist: USDA-ARS Conservation and Production Research Laboratory, Bushland, Texas.

Additional Information

Cole, N.A., R.N. Clark, R.W. Todd, C.R. Richardson, A. Gueye, L.W. Greene, and K. McBride. 2005. Influence of dietary crude protein concentration and source on potential ammonia emissions from beef cattle manure.  J. Anim. Sci. 83:722 731.

Cole, N.A., A.M. Mason, R.W. Todd, M. Rhoades, and D.B. Parker. 2009. Chemical composition of pen surface layers of beef cattle feedayrds. Prof. Anim. Sci. 25:541-552.

Flesch, T.K., J.D. Wilson, L.A. Harper, R.W. Todd, and N.A. Cole. 2007. Determining ammonia emissions from a cattle feedlot with an inverse dispersion technique. Agric. For. Meteorol. 144:139-155.

Hristov, A. N., M. Hanigan, A. Cole, R. Todd, T. A. McAllister, P. M. Ndegwa, A. Rotz. 2011. Ammonia emissions from dairy farms and beef feedlots: A review. Can. J. Anim. Sci. 91:1-35.

Preece, S.L., N.A. Cole, R.W. Todd, and B.W. Auvermann. 2012. Ammonia emissions from cattle-feeding operation. Texas A&M AgriLife Extension Bulletin E-632 12/12.

Rhoades, M.B., D.B. Parker, N.A. Cole, R.W. Todd, E.A. Caraway, B.W. Auvermann, D.R. Topliff, and G.L. Schuster. 2010. Continuous ammonia emission measurements from a commercial beef feedyard in Texas. Trans. ASABE 53:1823-1831.

Sakirkin, S.L., N.A. Cole, R.W. Todd, and B.W. Auvermann. 2011. Ammonia emissions from cattle-feeding operations. Part 1: issues and emissions. Texas Agricultural Experiment Station Bulletin, Air Quality Education in Animal Agriculture, Issues: Ammonia, December, 2011. p. 1-11.

Sakirkin, S., R.W. Todd, N.A. Cole, and B.W. Avermann. 2011. Ammonia emissions from cattle-feeding operations. Part 2: abatement. Texas Agricultural Experiment Station Bulletin, Air Quality Education in Animal Agriculture, Issues: Abatement, December, 2011. p. 1-11.

Todd, R.W., N.A. Cole, and R.N. Clark. 2006. Reducing crude protein in beef cattle diet reduces ammonia emissions from artificial feedyard surfaces. J. Environ. Qual. 35:404-411.

Todd, R.W., N.A. Cole, M.B. Rhoades, D.B. Parker, and K.D. Casey. 2011. Daily, monthly, seasonal and annual ammonia emissions from southern High Plains cattle feedyards. J. Environ. Qual. 40:1-6.

Todd, R.W., N.A. Cole, H.M. Waldrip, and R.M. Aiken. 2013. Arrhenius equation for modeling feedyard ammonia emissions using temperature and diet crude protein. J. Environ. Qual. 2013. (accepted for publication).

Acknowledgements

Research was supported by CSREES Grant #TS2006-06009 under the direction of Dr. John Sweeten, Resident Director, Texas A&M University AgriLife Research and Extension Center, Amarillo, TX. Larry Fulton, Research Technician, USDA-ARS-CPRL, provided invaluable technical and logistical support and expertise.

The authors are solely responsible for the content of these proceedings. The technical information does not necessarily reflect the official position of the sponsoring agencies or institutions represented by planning committee members, and inclusion and distribution herein does not constitute an endorsement of views expressed by the same. Printed materials included herein are not refereed publications. Citations should appear as follows. EXAMPLE: Authors. 2013. Title of presentation. Waste to Worth: Spreading Science and Solutions. Denver, CO. April 1-5, 2013. URL of this page. Accessed on: today’s date.