Feeding Strategies to Mitigate Cost and Environmental Footprint of Pig Production in the US

The livestock sector is one of main drivers of the environmental footprint. Animal feed is a key to sustainable meat production. Researchers are looking for environmentally sustainable feeding strategies that will lower diet cost, agricultural use of land, water depletion, and climate change impact. We used linear models to formulate 4 single-objective diets including least-cost, least-land use, least-water depletion, and least-climate change impact diets. Preliminary results showed that the use of wheat and wheat middlings hold potential to reduce pig diet cost and the environmental footprint.

Purpose

Demand for sustainable food, which conserves the environment and meets the needs of human development and increasing population, is growing (SCAR 2014). Livestock production is one of the major causes of the world’s environmental impacts including agricultural land use, water depletion, and climate change impact (PEW Commission on Industrial Farm Animal Production 2010). Feeding is the most important factor in livestock production cost and animal performance which includes growth, nutrition, health, sustainability, and productivity. Farmers are interested in producing animals with a better performance and need feeding strategies that will lower diet costs and conserve resource use (land and water). The objective of this study is to develop cost-effective diet formulations and mitigate the environmental footprint of pig production in the US.

What did we do?

Figure 1. Preliminary grow phase single-objective pig diets including typical US, least-cost, least-climate change impact, least-water depletion, and least-land use. Legend should be read left to right and top to bottom.

Figure 1. Preliminary grow phase single-objective pig diets including typical US, least-cost, least-climate change impact, least-water depletion, and least-land use. Legend should be read left to right and top to bottom.

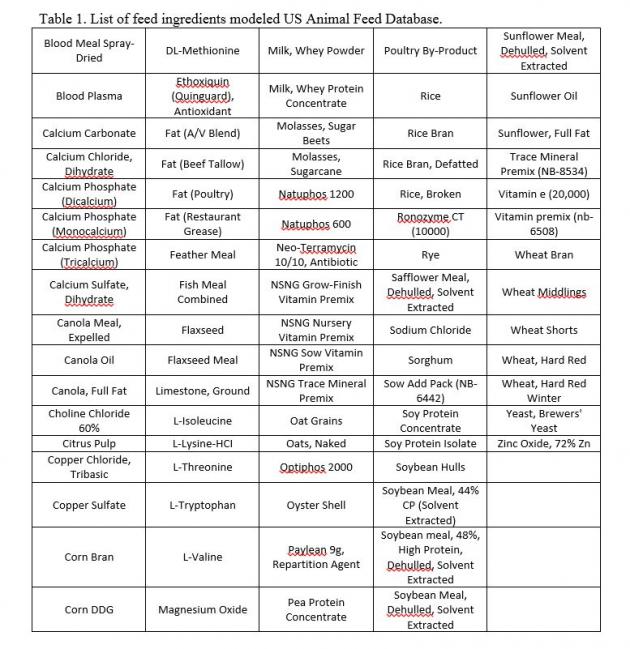
Windows-based User Friendly Feed Formulation (WUFFDA) linear models are used to formulate single-objective pig diets including least-cost, least-water use, least-land use, and least-climate change impact diets (Figure 1) (Pesti et al. 2004). Models include typical feed ingredients and additional US pig industry top 50 used protein and energy feed ingredients (Table 1 and 2). Nutrient characteristics, inclusion limits, environmental footprint, and cost data for feed ingredients were obtained from the US Animal Feed Database  and incorporated into WUFFDA models (Burek et al. 2014). Theoretical diets are compared against typical US pig multi-phase diets which were obtained from a nutritionist (Figure 1).

Table 1. Typical feed ingredients in US pig diets.

Blood Plasma

L-Valine

Copper Sulfate

Milk, Lactose

Corn DDG

Milk, Whey Powder

Corn, Yellow Dent

Neo-Terramycin

Dicalcium Phosphate

Paylean

DL-Methionine

Potassium Sulfate

Ethoxiquin

Poultry By-Product

Fat (Poultry)

Ronozyme

Fish Meal

Sodium Chloride

Limestone, Ground

Soybean meal, 48%

L-Isoleucine

Trace Mineral Premix

L-Lysine-HCI

Vitamin premix

L-Threonine

Zinc Oxide

L-Tryptophan


Table 2. Top 50 protein and energy feed ingredients in US pig diets.

Alfalfa Meal

Oat Grains

Barley

Oyster Shell

Beet Pulp

Pea Protein Concentrate

Blood Meal Spray-Dried

Peas, Field Peas

Canola Meal, Expelled

Rice

Canola Oil

Rice Bran

Canola, Full Fat

Rice, Broken

Citrus Pulp

Rye

Corn Bran

Safflower Meal

Corn Gluten Feed

Sorghum

Corn Gluten Meal

Soy Protein Concentrate

Cotton Seed Meal

Soy Protein Isolate

Fat (A/V Blend)

Soybean Hulls

Fat (Beef Tallow)

Soybean Meal, 44%

Fat (Restaurant Grease)

Soybean Oil

Feather Meal

Soybean Seeds, Heat Processed

Flaxseed

Soybeans, High Protein, Full Fat

Flaxseed Meal

Sunflower Meal

Meat and Bone Meal

Sunflower, Full Fat

Milk, Casein

Wheat Bran

Milk, Whey Permeate

Wheat Middlings

Milk, Whey Protein Concentrate

Wheat Shorts

Molasses, Sugar Beets

Wheat, Hard Red

Molasses, Sugarcane

Wheat, Hard Red Winter

What have we learned?

The US producers use corn and soybean meal as a base for pig diets (Figure 1). The single-objective modeling shows that more sustainable and cost-effective diets can be formulated by diversifying protein and energy sources. For example, preliminary theoretical single-objective diets for one pig growing phase show that the use of wheat and wheat middlings may reduce multiple objectives (Figure 1). The least-cost diet includes wheat, sorghum, wheat middlings, and corn distillers grains (Figure 1). Wheat, wheat middlings, soybeans, soybean hulls, corn distillers grains are the main ingredients in the least-climate change impact diet (Figure 1). The least-water depletion diet includes wheat middlings, corn distillers grains, and canola meal (Figure 1). The least-land use includes corn distillers grains, wheat, rice bran, and corn gluten feed (Figure1). Theoretical diets serve as guidelines to develop realistic sustainable cost-effective pig diets that pig producers will be able to incorporate into their production system. 

Future Plans

The results presented in this manuscript are preliminary. Formulated diets will be analyzed using the Pig Environmental Calculator (PPEC) and Simapro 8.1 life cycle assessment (LCA) pig production model (PRé Consultants 2014; National Pork Board 2015). The PPEC calculates the actual amount of feeds and total costs (National Pork Board 2015). The Simapro 8.3 cradle-to-farm gate pig production life-cycle assessment model calculates environmental impacts of pig production (PRé Consultants 2014).

Animal feed availability, pig production practices, and environmental footprints vary for pig production regions in the US. Feed costs are dynamic including costs and geography. The intention is to develop pig diets for different pig production regions in the US. Thus, further research will focus on multi-objective analyses to evaluate potential to reduce simultaneously cost and environmental footprints under different constraints. We will verify results with nutritionists, economists, and other experts. The pig producers will have access to formulated diets through PPEC.

Authors

Jasmina Burek, Research Associate, University of Arkansas jburek@uark.edu

Greg Thoma, Jennie Popp, Charles Maxwell, Rick Ulrich

Additional information

Pig Production Environmental Calculator
Life-Cycle Assessment Modeling for the Pork Industry

References

Burek J, Thoma G, Popp J, et al. (2014) Developing Environmental Footprint, Cost, and Nutrient Database of US Animal Feed Ingredients.

National Pork Board (2015) Carbon Footprint of Pork Production Calculator – Pork Checkoff.

PEW Commission on Industrial Farm Animal Production (2010) Environmental Impact of Industrial Farm Animal Production.

PRé Consultants (2014) SimaPro 8.3.

SCAR (2014) Sustainable food. http://ec.europa.eu/environment/eussd/food.htm.

Acknowledgements

This research is part of the program “Climate Change Mitigation and Adaptation in Agriculture,” and is supported by Agriculture and Food Research Initiative Competitive Grant no. 2011-68002-30208 from the USDA National Institute of Food and Agriculture.

The authors are solely responsible for the content of these proceedings. The technical information does not necessarily reflect the official position of the sponsoring agencies or institutions represented by planning committee members, and inclusion and distribution herein does not constitute an endorsement of views expressed by the same. Printed materials included herein are not refereed publications. Citations should appear as follows. EXAMPLE: Authors. 2015. Title of presentation. Waste to Worth: Spreading Science and Solutions. Seattle, WA. March 31-April 3, 2015. URL of this page. Accessed on: today’s date.

Environmental Footprint, Cost, and Nutrient Database of the US Animal Feed Ingredients


Poster presentation BurekWhy Look at Feed Ingredients and Environmental Footprint?

The US Pig Production Environmental Calculator (PPEC) was built upon cradle-to-farm-gate life-cycle assessment (LCA) of pork production combined with the US National Resource Council (NRC 2012) swine nutrient requirements models (NRC 2012), farm operation inputs, and animal feed database. The purpose of the US Animal Feed Database is to compile environmental, economic, and nutrient content of animal feed ingredients in a single location and integrate it into a PPEC economic model of swine operations. (Click on image at right to view a handout of the poster).

What did we do?

We collected data from different sources including NRC (2012) feed nutrient characteristics, Feedstuffs (2014) for feed prices, US agricultural and product LCA models built in SimaPro 7.3.3 (PRé Consultants 2011) and LCA databases (Swiss Centre for Life Cycle Inventories 2010; EarthShift 2011; Blonk Consultants 2014) for environmental footprints. Table 1 shows a list of top US pig feed ingredients.

What have we learned?

list in us databaseFeed ingredients with highest costs are additives (e.g. paylean) and amino acids. Milk by-products have the largest climate change impact, water and land use.

Future Plans

The information from this database will be used as a starting point for identifying potential mitigation options in pig diet formulation. The database will be updated as new information becomes available.

Authors

Jasmina Burek, Research Associate, University of Arkansas jburek@uark.edu

Greg Thoma, Jennie Popp, Charles Maxwell, Rick Ulrich

Additional information

National Pork Board (2015) Carbon Footprint of Pork Production Calculator – Pork Checkoff.
Pesti G, Thomson E, Bakalli R, et al. (2004) Windows User-Friendly Feed Formulation (WUFFF DA) Version1.02.
PRé Consultants (2014) SimaPro 8.3. 4555022.

Pig Production Environmental Calculator
Life-Cycle Assessment Modeling for the Pork Industry

Acknowledgements

This research is part of the program “Climate Change Mitigation and Adaptation in Agriculture,” and is supported by Agriculture and Food Research Initiative Competitive Grant no. 2011-68002-30208 from the USDA National Institute of Food and Agriculture.

The authors are solely responsible for the content of these proceedings. The technical information does not necessarily reflect the official position of the sponsoring agencies or institutions represented by planning committee members, and inclusion and distribution herein does not constitute an endorsement of views expressed by the same. Printed materials included herein are not refereed publications. Citations should appear as follows. EXAMPLE: Authors. 2015. Title of presentation. Waste to Worth: Spreading Science and Solutions. Seattle, WA. March 31-April 3, 2015. URL of this page. Accessed on: today’s date.

Waste to Worth 2013-Feed Management

W2W13 proceedings | Waste to Worth home
On this page: Dairy Cattle | Feeding and Rations | Beef Feedlot

Dairy Cattle Feeding & Rations Beef Feedlot

Sustainable Dairy Cropping Systems

Dairy Cow Ration Impacts Manure Chemistry and the Environment

Feed Management Planners Certification Program

Integrating Manure into Feed Ration Optimization

Distiller’s Grains Effects on Sulfur Emissions

BFNMP: A Tool for Feedlot Manure Economics


Environmental Protection Agency (EPA) Perspective on Nutrient Pollution

Waste to Worth: Spreading science and solutions logoWaste to Worth home | More proceedings….

Why Discuss Regulations and Nutrient Pollution?

Provide EPA’s perspective on nutrient pollution and encourage an open dialogue to help address this problem which is rapidly becoming one of the most challenging environmental problems that we face.

What Did We Do?

Although nutrients, nitrogen and phosphorus in particular, are essential for aquatic life, too many nutrients can create significant problems for our nation’s lakes, streams, and coastal waters.  Nutrient pollution can degrade habitat for fish and wildlife, render water bodies unsafe for swimming and other forms of contact recreation, create a public health concern for drinking water supplies, decrease property values, and negatively impact local economies.  According to national statistics, more than 45% of streams have medium to high levels of nutrients, approximately four million lake acres have been identified as threatened or impaired, and approximately 78% of assessed coastal areas exhibit signs of eutrophication.

Nutrients can be transported great distances and impact areas far downstream.  One of the more prominent examples in the United States is the Gulf of Mexico “dead zone,” which can be larger than the state of Connecticut in some years.  The term “dead zone” refers to waters that have been so heavily impacted by nutrient pollution that oxygen levels are depleted to the point where most aquatic life cannot survive.  Nutrients are transported to the Gulf of Mexico via tributaries of the Mississippi River from as far away as Montana in the west and Pennsylvania in the eastern portion of this large watershed.

Nutrient pollution is not restricted to the Mississippi River Basin or any one region of the country.  Nutrient pollution is widespread, impacting waters across the nation.  As we learn more about the impacts of nutrient pollution, especially the potential for some species of algae to produce toxins that can be harmful to both people and animals, states are becoming more aggressive in reducing sources and even posting health advisories when necessary.

So, what has EPA been doing to address nutrient pollution?

  1. Providing states with technical assistance and other resources to help develop water quality criteria for nitrogen and phosphorus;
  2. Working with states to identify waters impaired by nutrients and developing restoration plans;
  3. Awarding grants to states to address pollution from nonpoint sources, such as agriculture and storm water runoff;
  4. Administering a permit program designed to reduce the amount of nitrogen and phosphorus discharged to the environment from point sources;
  5. Providing funding for the construction and upgrade of municipal wastewater treatment plants;
  6. Working with states to reduce nitrogen oxide emissions from air sources;
  7. Conducting and supporting extensive research on the causes, impacts, and best approaches to  reduce nutrient pollution; and
  8. Increasing collaboration with other federal partners (e.g., USDA) to leverage financial and technical resources.

And although progress has been made over the past decade, much more is needed.  Realizing a need for greater action, In March 2011, EPA issued a memorandum titled “Working in Partnership with States to Address Phosphorus and Nitrogen Pollution through Use of a Framework for State Nutrient Reductions.”  This memo emphasized that nutrient pollution continues to have the potential to become one of the costliest and most challenging environmental problems that we face and reaffirmed the agencies commitment to partner with states and stakeholders to make greater progress in reducing nutrient loading to our nation’s waters.  If you have not already done so, please join us in protecting and restoring our nation’s waters.  For more information visit EPA’s nutrient pollution website at http://www.epa.gov/nutrientpollution/.

Author

Alfred Basile, Biologist, US Environmental Protection Agency Region 8, basile.alfred@epa.gov

Additional Information

www.epa.gov/nutrientpollution

The authors are solely responsible for the content of these proceedings. The technical information does not necessarily reflect the official position of the sponsoring agencies or institutions represented by planning committee members, and inclusion and distribution herein does not constitute an endorsement of views expressed by the same. Printed materials included herein are not refereed publications. Citations should appear as follows. EXAMPLE: Authors. 2013. Title of presentation. Waste to Worth: Spreading Science and Solutions. Denver, CO. April 1-5, 2013. URL of this page. Accessed on: today’s date.


Ammonia Emissions and Emission Factors: A Summary of Investigations at Beef Cattle Feedyards on the Southern High Plains

Waste to Worth: Spreading science and solutions logoWaste to Worth home | More proceedings….

Why Study Ammonia Emitted from Feedlots?

Ammonia volatilization is a major component of the nitrogen balance of a feedyard, and the effects of ammonia loss range from the economic (loss of manure fertilizer value) to the environmental (air quality degradation, overfertilization of ecosystems). Although not yet regulated, ammonia emissions from cattle are required to be reported under the Emergency Planning and Community Right to Know Act. Emission factors are used to estimate ammonia emissions for purposes of reporting and national inventories, but current emission factors are based on limited data. Our objective was to definitively quantify ammonia emissions and emission factors from commercial feedyards on the southern High Plains of Texas.

A typical feedyard on the High Plains of Texas. In the foreground, cattle in corrals with a stocking density of about 150 sq. ft./animal. In the background on the left, the runoff water retention pond, and center, a mound of stockpiled manure.

What Did We Do?

Ammonia emissions were quantified at three commercial feedyards in the Texas Panhandle from 2002 to 2008 using micrometeorological methods. Seasonal, intensive measurement campaigns were conducted from 2002 to 2005 at one feedyard, and ammonia emissions were near-continously monitored from 2007-2008 at two more feedyards. Meteorological and cattle management data were also collected.

What Have We Learned?

Ammonia emissions followed a distinct annual pattern. Emissions during summer were about twice those during winter, while spring and autumn emissions were intermediate. Annualized ammonia emissions ranged from 0.20 to 0.37 lb NH3/animal/day, and averaged 0.26 lb NH3/animal/day over all studies. Ammonia loss as a fraction of nitrogen fed to cattle averaged 41% during winter and 69% during summer; on an annual basis, 54% of fed nitrogen was lost as ammonia. Greatest emissions were observed when crude protein in cattle rations exceeded the nutrient requirements of beef cattle. Mean monthly ammonia emissions were strongly correlated with mean monthly temperature, and the relationship can be used to predict ammonia emissions from southern High Plains feedyards. Cattle feeders that meet recommended crude protein in rations can expect to lose half of fed N as ammonia. We recommend an annual emission factor of 88 lb/head for beef cattle feedyards based on one-time capacity, or 39 lb/head fed, based on a 150-d feeding period.

The annual pattern of ammonia emission rates (ER) followed seasonal temperatures, but also was sensitive to dietary crude protein (CP). Adding distillers grains to rations from March, 2008 to October, 2008 increased crude protein at Feedyard A to as high as 19%. Ammonia emissions greatly increased compared with the previous year and compared with Feedyard E.

Future Plans

Next steps involve using the extensive database from this research to adapt and refine process-based models of ammonia emissions. These models, based on the actual physical and chemical processes that control ammonia loss, will be more generally applicable than emission factors to a wider range of feedyards.

On an annual basis, ammonia emission averaged 0.26 lb per animal per day across the three feedyards and six years of study. Increased ammonia emission at Feedyard A in 2008 was due to high dietary crude protein when distillers grains were added to rations. Using these data and other estimates of ammonia loss from retention ponds and stockpiles, we recommend, for beef cattle fed a diet that meets protein requirements, an annual emission factor of 88 lb/head based on one-time capacity, or 39 lb/head fed, based on a 150-d feeding period.

Authors

Richard W. Todd, Research Soil Scientist, USDA-ARS Conservation and Production Research Laboratory, Bushland, Texas, richard.todd@ars.usda.gov

Richard W. Todd, Research Soil Scientist; N. Andy Cole, Research Leader and Research Animal Scientist (Nutrition); and Heidi M. Waldrip, Research Soil Scientist: USDA-ARS Conservation and Production Research Laboratory, Bushland, Texas.

Additional Information

Cole, N.A., R.N. Clark, R.W. Todd, C.R. Richardson, A. Gueye, L.W. Greene, and K. McBride. 2005. Influence of dietary crude protein concentration and source on potential ammonia emissions from beef cattle manure.  J. Anim. Sci. 83:722 731.

Cole, N.A., A.M. Mason, R.W. Todd, M. Rhoades, and D.B. Parker. 2009. Chemical composition of pen surface layers of beef cattle feedayrds. Prof. Anim. Sci. 25:541-552.

Flesch, T.K., J.D. Wilson, L.A. Harper, R.W. Todd, and N.A. Cole. 2007. Determining ammonia emissions from a cattle feedlot with an inverse dispersion technique. Agric. For. Meteorol. 144:139-155.

Hristov, A. N., M. Hanigan, A. Cole, R. Todd, T. A. McAllister, P. M. Ndegwa, A. Rotz. 2011. Ammonia emissions from dairy farms and beef feedlots: A review. Can. J. Anim. Sci. 91:1-35.

Preece, S.L., N.A. Cole, R.W. Todd, and B.W. Auvermann. 2012. Ammonia emissions from cattle-feeding operation. Texas A&M AgriLife Extension Bulletin E-632 12/12.

Rhoades, M.B., D.B. Parker, N.A. Cole, R.W. Todd, E.A. Caraway, B.W. Auvermann, D.R. Topliff, and G.L. Schuster. 2010. Continuous ammonia emission measurements from a commercial beef feedyard in Texas. Trans. ASABE 53:1823-1831.

Sakirkin, S.L., N.A. Cole, R.W. Todd, and B.W. Auvermann. 2011. Ammonia emissions from cattle-feeding operations. Part 1: issues and emissions. Texas Agricultural Experiment Station Bulletin, Air Quality Education in Animal Agriculture, Issues: Ammonia, December, 2011. p. 1-11.

Sakirkin, S., R.W. Todd, N.A. Cole, and B.W. Avermann. 2011. Ammonia emissions from cattle-feeding operations. Part 2: abatement. Texas Agricultural Experiment Station Bulletin, Air Quality Education in Animal Agriculture, Issues: Abatement, December, 2011. p. 1-11.

Todd, R.W., N.A. Cole, and R.N. Clark. 2006. Reducing crude protein in beef cattle diet reduces ammonia emissions from artificial feedyard surfaces. J. Environ. Qual. 35:404-411.

Todd, R.W., N.A. Cole, M.B. Rhoades, D.B. Parker, and K.D. Casey. 2011. Daily, monthly, seasonal and annual ammonia emissions from southern High Plains cattle feedyards. J. Environ. Qual. 40:1-6.

Todd, R.W., N.A. Cole, H.M. Waldrip, and R.M. Aiken. 2013. Arrhenius equation for modeling feedyard ammonia emissions using temperature and diet crude protein. J. Environ. Qual. 2013. (accepted for publication).

Acknowledgements

Research was supported by CSREES Grant #TS2006-06009 under the direction of Dr. John Sweeten, Resident Director, Texas A&M University AgriLife Research and Extension Center, Amarillo, TX. Larry Fulton, Research Technician, USDA-ARS-CPRL, provided invaluable technical and logistical support and expertise.

The authors are solely responsible for the content of these proceedings. The technical information does not necessarily reflect the official position of the sponsoring agencies or institutions represented by planning committee members, and inclusion and distribution herein does not constitute an endorsement of views expressed by the same. Printed materials included herein are not refereed publications. Citations should appear as follows. EXAMPLE: Authors. 2013. Title of presentation. Waste to Worth: Spreading Science and Solutions. Denver, CO. April 1-5, 2013. URL of this page. Accessed on: today’s date.

Software For Evaluating the Environmental Impact of Dairy and Beef Production Systems

Waste to Worth: Spreading science and solutions logoWaste to Worth home | More proceedings….

Why Model Environmental Impacts of Livestock?

Quantifying the long term environmental impacts of dairy and beef production is complex due to the many interactions among the physical and biological components of farms that affect the amount and type of emissions that occur. Emissions are influenced by climate and soil characteristics as well as internal management practices. Software models are needed to perform an integrated and comprehensive assessment of all important environmental and economic effects of farm management and mitigation strategies. Related: Manure value & economics

What Did We Do?

Figure 1. The Integrated Farm System Model simulates the performance, determines the economics, and predicts the air and water emissions of farm production systems.

Software tools were created that perform whole-farm analyses of the performance, economics and environmental impact of dairy and beef production systems. The Integrated Farm System Model (IFSM) is a comprehensive research tool that simulates production systems over many years of weather to quantify losses to the environment and the economics of production. From the simulated performance and losses, environmental footprints are determined for carbon, energy use, water use and reactive nitrogen loss. Crop, dairy and beef producing farms can be simulated under different management scenarios to evaluate and compare potential environmental and economic benefits. The Dairy Gas Emissions Model (DairyGEM) provides a simpler educational tool for studying management effects on greenhouse gas, ammonia and hydrogen sulfide emissions and the carbon, energy and water footprints of dairy production systems.

What Have We Learned?

Analyses with either the IFSM or DairyGEM tools illustrate the complexity of farming systems and the resultant effect of management choices. Although IFSM was primarily developed and used as a research tool, it is also used in classroom teaching and other education applications. DairyGEM provides an easier and more graphical tool that is best suited to educational use.

Future Plans

Figure 2. DairyGEM is an educational tool for evaluating management effects on air emissions and environmental footprints of dairy production systems.

Development of these software tools continues. Work is currently underway to add the simulation of VOC emissions to both models. Routines are also being implemented to better represent the performance and emissions of beef feed yards.

Authors

C. Alan Rotz, Agricultural Engineer, USDA/ARS; al.rotz@ars.usda.gov

Additional Information

The IFSM and DairyGEM software tools are available through Internet download [https://www.ars.usda.gov/research/software/?modeCode=80-70-05-00] for use in individual, workshop and classroom education. Reference manuals and other detailed information on the models is also available at this website.

Acknowledgements

Many people have contributed to the development of these models and software tools. Although they can not all be listed here, they are acknowledged in each software program.

The authors are solely responsible for the content of these proceedings. The technical information does not necessarily reflect the official position of the sponsoring agencies or institutions represented by planning committee members, and inclusion and distribution herein does not constitute an endorsement of views expressed by the same. Printed materials included herein are not refereed publications. Citations should appear as follows. EXAMPLE: Authors. 2013. Title of presentation. Waste to Worth: Spreading Science and Solutions. Denver, CO. April 1-5, 2013. URL of this page. Accessed on: today’s date.

What We Feed Dairy Cows Impacts Manure Chemistry and the Environment

Waste to Worth: Spreading science and solutions logoWaste to Worth home | More proceedings….

Why Be Concerned with Feed Rations and Their Environmental Implications?

During the last part of the 20th century, animal manure management became an environmental concern. In response to these concerns, legislation was enacted to control manure management and the emission of undesirable gasses (e.g., methane, ammonia, nitrous oxide) from animal production systems. The purpose of this paper is to illustrate how mineral phosphorus (P) supplements, forage types and amounts, and the crude protein (CP) fed to lactating cows impact manure chemistry and the fate of manure nutrients in the environment.

What Did We Do?

Source-sink relationships have been used to illustrate relationships between feed nutrient sources (e.g., forms and concentrations of P and CP in lactating cows rations) and nutrient sinks (milk and manure), and relationships between manure nutrient sources (e.g., soluble P, urea N) and sinks [soil test P, runoff P, atmospheric ammonia, soil inorganic nitrogen (N), crop N] and the impact of these relationships on the environment.

What Have We Learned?

As mineral P concentrations in dairy rations increase, the excretion of total P and soluble P in manure also increases. The amount of cropland needed to recycle manure P and runoff of soluble P from cropland after manure application can be related back to the P excreted in manure, which in turn can be linked to the amount of mineral P in cow rations.  Likewise, the type and amount of CP and forage fed to dairy cows impact manure chemistry and manure N losses as ammonia, N cycling in soil, including plant N uptake. Ammonia emissions from dairy barns and soil after manure application can be related back to the urea N excreted by dairy cows in urine, which is linked to the types and concentrations of CP and forages in cow rations, and the concentrations of urea in milk (milk urea N, or MUN).  Our results demonstrate that profitable rations can be fed to satisfy the nutritional demands of healthy, high producing dairy cows, reduce manure excretion and therefore the environmental impacts of milk production.

Future Plans

We continue investigations on how the feeding of tannins to lactating dairy cows, and the use of MUN as a management tool  may enhance feed CP use efficiency (more feed CP transformed into milk, less excreted in manure) and reduce losses of ammonia, nitrates and nitrous oxide from dairy farms.

Authors

J. Mark Powell, Soil Scientist. USDA-ARS U.S. Dairy Forage Research Center, Madison, Wisconsin,  mark.powell@ars.usda.gov

Glen A. Broderick,  Dairy Scientist,  USDA-ARS U.S. Dairy Forage Research Center, Madison, Wisconsin

Additional Information

Powell, J.M. and Broderick, G.A. Transdisciplinary soil science research: Impacts of dairy nutrition on manure chemistry and the environment. Soil. Sci. Soc. Am. J. 75:2071–2078.

Powell, J.M. Alteration of Dairy Cattle Diets for Beneficial On-Farm Recycling of Manure Nutrients. pp 21-42  In: Applied Research in Animal Manure Management. Zhongqi H. (Ed.) Nova Science Publ. Inc.

Powell, J.M., Wattiaux, M.A., and Broderick, G.A. Evaluation of milk urea nitrogen as a management tool to reduce ammonia emissions from dairy farms. J. Dairy Sci. 94:4690–4694.


The authors are solely responsible for the content of these proceedings. The technical information does not necessarily reflect the official position of the sponsoring agencies or institutions represented by planning committee members, and inclusion and distribution herein does not constitute an endorsement of views expressed by the same. Printed materials included herein are not refereed publications. Citations should appear as follows. EXAMPLE: Authors. 2013. Title of presentation. Waste to Worth: Spreading Science and Solutions. Denver, CO. April 1-5, 2013. URL of this page. Accessed on: today’s date.

Effect of Feeding Distiller’s Grains on Reduced Sulfur Emissions

Waste to Worth: Spreading science and solutions logoWaste to Worth home | More proceedings….

Why Study Sulfur Emissions and Manure from Animals Fed Distillers Byproducts?

Odorous reduced sulfur compounds are produced during manure decomposition and emitted from confined animal feeding operations.  Feeding high-sulfur distiller’s byproducts may increase the emission of these compounds.  The objectives of a series of feedlot pen studies was to (i) determine if emissions of reduced sulfur compounds from fresh manure and from the feedlot surface where affected if cattle were fed varying levels of distillers byproducts, and (ii) determine the areas within a pen that emit greater amounts of reduced sulfur compounds.

Study #1–Relative emission of redued sulfur compounds from fresh feces. Cattle fed diets containing 0%, 20%, 40%, and 60% WEGS.

What Did We Do?

Three studies were conducted to evaluate the relative impact of feeding high-sulfur wet distiller’s grain plus solubles (WDGS) to beef cattle.  In the first study, beef cattle in sixteen small-scale pens were fed varying amounts (0%, 20%, 40%, and 60%) of WDGS, and the relative emissions of reduced sulfur from fresh feces were measured using a laboratory wind tunnel chamber.  A follow up study in eight production-scale feedlot pens also examined the effect of feeding 0% or 40% WDGS on fresh manure emissions.  A third study in ten production-scale pens examined emissions from the pen surface when cattle were fed 0% and 40% WDGS diets over two production cycles.

Study #2–Relative emission of reduced sulfur compounds from feces of cattle fed 0% or 40% WDGS. P values above bars indicate the significance of the difference between emissions on the four dates.

What Have We Learned?

The relative emission of reduced sulfur from fresh feces was significantly greater (4 to 22-fold) when 40% (or greater) WDGS was fed in the initial study.  The follow up study confirmed this finding, but found the relative emission to be lower (2 to 4 fold higher for WDGS) in the production-scale feedlot.  In the final study examining the relative emission from the whole feedlot pen surface (mixed soil and aged feces) over many months, emissions principally came from the wetter edges of the pen when animal were fed higher levels of WDGS in their diet.  For the six study periods, the relative emissions from WDGS pens ranged from 0.3 to 4-fold higher than a standard ration.  Consistent results from these three studies indicate that reduced sulfur emissions increase when animals are fed higher levels of WDGS.

Study #3–Relative concentration of total reduced sulfur (TRS) in the chamber for each of the seven study periods. An asterisk above the bars indicates a significant difference (P < 0.05) between diets.

Future Plans

The level of sulfur in WDGS varies depending upon source and production method.  Feeding lower sulfur WDGS should reduce the relative emission of odorous reduced sulfur compounds.  Production of the reduced sulfur compounds may also be related to water quality—some water sources high in sulfur may enhance the emission of reduced sulfur from animal production sites.  Further research into the mechanism of reduced sulfur production may provide new insights into controlling the emissions of these odorous compounds.

Authors

Daniel N. Miller, Research Microbiologist, USDA-ARS, Lincoln, NE, dan.miller@ars.usda.gov

Mindy J. Spiehs, Research Animal Scientist, USDA-ARS, Clay Center, NE

Bryan L. Woodbury, Agricultureal Engineer, USDA-ARS, Clay Center, NE

Additional Information

Miller, D. N., V. H. Varel, B. L. Woodbury, and M. J. Spiehs.  2010.  Enhanced reduced sulfur emission from manures of beef cattle fed distiller’s byproducts.  International Symposium on Air Quality and Manure Management for Agriculture Conference Proceedings, 13-16 September, Dallas, Texas.  711P0510cd.

Acknowledgements

The authors would like to acknowledge the technical expertise of Todd Bowman, Alan Kruger, and Ryan McGhee.  Mention of trade names or commercial products in this publication is solely for the purpose of providing specific information and does not imply recommendation or endorsement by the U.S. Department of Agriculture.  USDA is an equal opportunity provider and employer.

The authors are solely responsible for the content of these proceedings. The technical information does not necessarily reflect the official position of the sponsoring agencies or institutions represented by planning committee members, and inclusion and distribution herein does not constitute an endorsement of views expressed by the same. Printed materials included herein are not refereed publications. Citations should appear as follows. EXAMPLE: Authors. 2013. Title of presentation. Waste to Worth: Spreading Science and Solutions. Denver, CO. April 1-5, 2013. URL of this page. Accessed on: today’s date.

The National Air Quality Site-Assessment Tool (NAQSAT)

Waste to Worth: Spreading science and solutions logoWaste to Worth home | More proceedings….

Abstract

The National Air Quality Site Assessment Tool (NAQSAT) has been developed for the voluntary use of livestock producers and their advisors or consultants. It is intended to provide assistance to livestock and poultry producers in determining the areas in their operations where there are opportunities to make changes that result in reduced air emissions. Air emissions research from livestock production systems is increasing every year. NAQSAT is based on the most accurate, credible data currently available regarding mitigation strategies for air emissions of ammonia, methane, volatile organic compounds, hydrogen sulfide, particulates, and odor.

From the NAQSAT home page users may watch a video explaining the tool, read an overview, study the user manual or select a species to start using the program.

Purpose

The National Air Quality Site Assessment Tool (NAQSAT) was developed for livestock producers who are interested in investigating opportunities to reduce air emissions from their livestock operation. The online tool is designed to provide farmers and their advisors air emissions information explicitly for their farm in a confidential setting. The tool may be run from any computer with internet access. All information entered into NAQSAT and the corresponding results remain confidential.

What Did We Do?

NAQSAT considers the air emissions from eight management categories; animal housing, feed and water, manure collection and transfer, manure storage, land application, mortality management, public perception and on-farm roads.

On the NAQSAT Effectiveness Results page the green area indicates the effectiveness of current management practices, the white area indicates the opportunity for improvement. At the end of each session users are encouraged to select “Print My Report” to receive a paper copy of all inputs that had been entered and a copy of the Effectiveness Results page for their records. 

Users of the tool are asked a series of questions under each of the eight management categories. Based on the responses to previously answered questions the program determines what additional questions need to be answered such that only questions pertaining to the operation currently being evaluated are asked. Pop-up pictures assist the user in determining the relative rating to select when questions require a visual evaluation of the existing practices.

NAQSAT addresses seven emissions of concern; odor, particulate matter (dust), ammonia (NH3), hydrogen sulfide (H2S), methane (CH4), volatile organic compounds (VOCs) and nitrous oxide (N2O) under each of the eight management categories. Within the results page the green area in each rectangle indicates the effectiveness of current management practices, the white area indicates the opportunity for improvement.

NAQSAT allows users to save and run different scenarios providing the opportunity to compare the results of implementing new management practices.

It is easy to save NAQSAT sessions and return at a later date to make adjustments or consider additional alternatives. Each “saved” user session of NAQSAT is stored under its own URL available only to the person or persons with access to that URL. Individual URLs remain available for a minimum of 30 days before they are removed from the host computer.

The tool’s results page does not provide emissions data and/or regulatory guidance. It does identify opportunities for reducing air emissions and the ability to evaluate which practices might have the most impact. NAQSAT was developed for voluntary and educational use. The tool is designed to be used by livestock and poultry producers, however, the results may be more valuable when NAQSAT is used in cooperation with agency personnel or private consultants that can provide follow-up with suggestions for mitigation practices.

What Have We Learned?

NAQSAT has been used by members of the tool’s development committee to address odor conflicts in Colorado and in Michigan. In each case the tool confirmed the farm management teams were using acceptable management practices to limit odors from the livestock operation. In both states the local and state agencies involved in the conflict resolution were appreciative of the information provided by the tool.

Authors

Gerald May, Educator, Michigan State University Extension, mayg@msu.edu

Additional Information

The NAQSAT on-line tool is currently available at: http://naqsat.tamu.edu/.  It is available at no cost from its host website (it does not download onto your computer). To assist first time users an overview of the tool, an informative video and a user’s manual are available on the NAQSAT home page.

Archived webinars:

Acknowledgements

Are there any organizations or individuals (besides the authors) that should be acknowledged?

Development of NAQSAT was partially funded by the USDA – NRCS Conservation Innovation Grant program. Over twenty partner organizations and universities contributed to the development of NAQSAT.

Partner universities:  Partner organizations:
Colorado State University C.E. Meadows Endowment
Iowa State University Colorado Livestock Association
Michigan State University Iowa Turkey Federation
Oregon State University Iowa Pork Producers
Penn State University Iowa Pork Industry Center
Purdue University Iowa State Univ. Experiment Station
Texas A&M University Michigan Milk Producers Association
University of California, Davis Michigan Pork Producers Association
University of Georgia Michigan State Univ. Extension
University of Maryland National Pork Board
University of Minnesota Nebraska Environmental Trust
University of Nebraska Western United Dairymen

The authors are solely responsible for the content of these proceedings. The technical information does not necessarily reflect the official position of the sponsoring agencies or institutions represented by planning committee members, and inclusion and distribution herein does not constitute an endorsement of views expressed by the same. Printed materials included herein are not refereed publications. Citations should appear as follows. EXAMPLE: Authors. 2013. Title of presentation. Waste to Worth: Spreading Science and Solutions. Denver, CO. April 1-5, 2013. URL of this page. Accessed on: today’s date.

Integrating Manure into Feed Ration Optimization

Waste to Worth: Spreading science and solutions logoWaste to Worth home | More proceedings….

* Presentation slides are available at the bottom of the page.

Abstract

Ration optimization models currently minimize the purchase price of feeds used to meet nutrient requirements.  Not included in optimization models is the value of manure nutrients resulting from ration alternatives.  This project extends the linear program that is used to minimize ration cost to include the value of manure excreted and stored.  Microsoft EXCEL’s Solver GRG Nonlinear Add-in is used to optimize the integrated decision because of the non-linear aspects of manure excretion as a function of feed fed.

Several economic and production changes over the last 10 years warrant an investigation of the impact of optimizing both feed and manure decisions simultaneously.  Distillers Dried Grains with Solubles (DDGS) have become a common feed high in phosphorus, lessening the need for inorganic phosphorus sources.  Including DDGS in the diet also increases the manure concentration of phosphorus.  If phosphorus is needed on nearby crop fields, there is potential to increase manure value while simultaneously reducing feed cost.  In contrast, feeding phytase may reduce feed cost, while reducing manure value if phosphorus in manure is valued.  Feeding synthetic amino acids can also reduce feed cost while reducing the amount of nitrogen excreted and available as a fertilizer in the manure.  Adding to the importance of considering manure value is the increased costs of fertilizers.  Manure is increasingly seen as a viable alternative to commercial fertilizers and might affect the whole farm profitability if included in the ration cost decision. 

This project considers swine rations and examines how they might have changed during the past 10 years if manure value had been incorporated into the ration optimization decision.  We will attempt to determine when manure fertilizer value relative to feed costs justifies integrating feed and manure optimization. Results indicate that incorporating manure value into the optimization routine would change some diet formulations.

Why Consider Manure Nutrients When Balancing Rations?

The value of manure supplied nutrients (N, P and K) has increased significantly over the past decade. Feedstuffs, such as DDGS, have been incorporated into the diets in ways that reduce the need for P supplementation. These developments have moved manure from a waste product to a co-product in livestock production.  By integrating feed and manure management decisions it was hypothesized that profit could be improved.

What Did We Do?

The 2012 version of the National Swine Nutrition Guide (NSNG) ration software contains an optimization model for least cost ration formulation that calculates the potential manure value associated with different optimized diets.  This recognition of the value of manure is an important contribution. 

We incorporated the value of manure (as estimated by the NSNG) into the least cost ration optimization routine so that the objective function changed from minimizing the cost of feed to minimizing the net cost of feed.  Net diet cost was defined as the cost of feed less the value of manure.  Optimization of this equation required the use of the GRG non-linear optimization routine of Microsoft EXCEL.

This project evaluated least cost swine rations and how they might have changed during the past 10 years if manure value had been incorporated into the ration optimization decision.  We specifically examined rations for 50-100 lb. and 200-250 lb. pigs. Rations were optimized with the following limitations: 1) manure was/was not included in the objective function; 2) DDGS were/were not allowed as a feedstuff in the rations.

What Have We Learned?

Assuming that the full value of the manure could be obtained, incorporating manure into the least cost ration optimization reduced net diet cost seven of the last 10 years for 50-100 lb. and 200-250 lb. pigs when DDGS were allowed in the diets.  The ten-year mean improvement in net diet cost was $0.61/ton with a range from $0 to $8.41/ton of feed. More typically differences were small, exceeding $1.00/ton only in 2005 and 2006. Increasing manure value required increasing feed cost by an a 10-year average of $1.14/ton.  The uncertainty in extracting manure value may make farmers hesitant to increase feed cost in hopes of capturing additional manure value.  Two years may provide insight into the opportunity to incorporate manure value into the least cost feed decision.  In 2006, a savings of $8.41/ton of feed fed was obtained by including 40% DDGS in the 50-100 lb. pig diet; this savings required increasing the feed cost by $1.76/ton resulting in a $10.18/ton increase in manure value in associated excreted nutrients.  In 2009, a net ration savings of $.61/ton was obtained by eliminating phytase which was in the original least cost ration formulation.  Phytase reduced the need for expensive phosphorus feedstuffs but not sufficiently when the value of manure was considered.

Future Plans

Non-linear optimization routines may find local optima rather than a global optimum.  A procedure needs to be developed that insures that the global optimum is found before incorporating manure into the least cost ration decision will become widespread.

Authors

Dr. Ray Massey, Extension Professor, Agricultural and Applied Economics, University of Missouri,  masseyr@missouri.edu

John Lory, Extension Associate Professor of Extension, Division of Plant Science, University of Missouri

Marcia Shannon, Associate Professor, Swine Nutrition, University of Missouri

Additional Information

The 2012 version of the National Swine Nutrition Guide can be found at the U.S. Pork Center of Excellence (https://www.usporkcenter.org/product/national-swine-nutrition-guide/


The authors are solely responsible for the content of these proceedings. The technical information does not necessarily reflect the official position of the sponsoring agencies or institutions represented by planning committee members, and inclusion and distribution herein does not constitute an endorsement of views expressed by the same. Printed materials included herein are not refereed publications. Citations should appear as follows. EXAMPLE: Authors. 2013. Title of presentation. Waste to Worth: Spreading Science and Solutions. Denver, CO. April 1-5, 2013. URL of this page. Accessed on: today’s date.