Why Study Sulfur Emissions and Manure from Animals Fed Distillers Byproducts?
Odorous reduced sulfur compounds are produced during manure decomposition and emitted from confined animal feeding operations. Feeding high-sulfur distiller’s byproducts may increase the emission of these compounds. The objectives of a series of feedlot pen studies was to (i) determine if emissions of reduced sulfur compounds from fresh manure and from the feedlot surface where affected if cattle were fed varying levels of distillers byproducts, and (ii) determine the areas within a pen that emit greater amounts of reduced sulfur compounds.
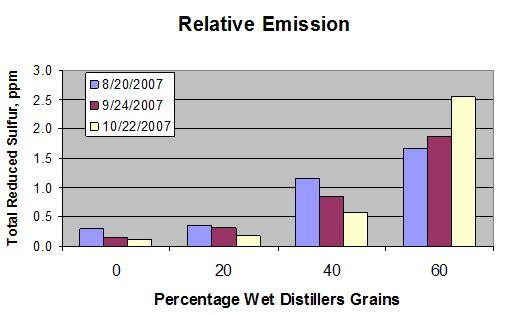
Study #1–Relative emission of redued sulfur compounds from fresh feces. Cattle fed diets containing 0%, 20%, 40%, and 60% WEGS.
What Did We Do?
Three studies were conducted to evaluate the relative impact of feeding high-sulfur wet distiller’s grain plus solubles (WDGS) to beef cattle. In the first study, beef cattle in sixteen small-scale pens were fed varying amounts (0%, 20%, 40%, and 60%) of WDGS, and the relative emissions of reduced sulfur from fresh feces were measured using a laboratory wind tunnel chamber. A follow up study in eight production-scale feedlot pens also examined the effect of feeding 0% or 40% WDGS on fresh manure emissions. A third study in ten production-scale pens examined emissions from the pen surface when cattle were fed 0% and 40% WDGS diets over two production cycles.
Study #2–Relative emission of reduced sulfur compounds from feces of cattle fed 0% or 40% WDGS. P values above bars indicate the significance of the difference between emissions on the four dates.
What Have We Learned?
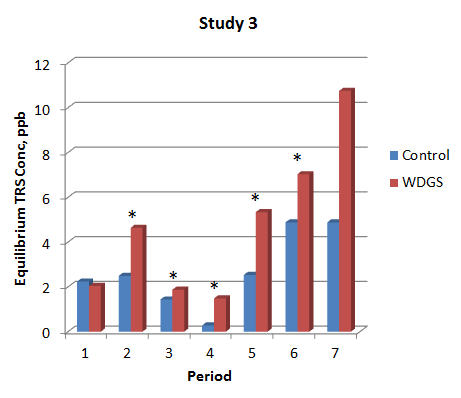
The relative emission of reduced sulfur from fresh feces was significantly greater (4 to 22-fold) when 40% (or greater) WDGS was fed in the initial study. The follow up study confirmed this finding, but found the relative emission to be lower (2 to 4 fold higher for WDGS) in the production-scale feedlot. In the final study examining the relative emission from the whole feedlot pen surface (mixed soil and aged feces) over many months, emissions principally came from the wetter edges of the pen when animal were fed higher levels of WDGS in their diet. For the six study periods, the relative emissions from WDGS pens ranged from 0.3 to 4-fold higher than a standard ration. Consistent results from these three studies indicate that reduced sulfur emissions increase when animals are fed higher levels of WDGS.
Study #3–Relative concentration of total reduced sulfur (TRS) in the chamber for each of the seven study periods. An asterisk above the bars indicates a significant difference (P < 0.05) between diets.
Future Plans
The level of sulfur in WDGS varies depending upon source and production method. Feeding lower sulfur WDGS should reduce the relative emission of odorous reduced sulfur compounds. Production of the reduced sulfur compounds may also be related to water quality—some water sources high in sulfur may enhance the emission of reduced sulfur from animal production sites. Further research into the mechanism of reduced sulfur production may provide new insights into controlling the emissions of these odorous compounds.
Mindy J. Spiehs, Research Animal Scientist, USDA-ARS, Clay Center, NE
Bryan L. Woodbury, Agricultureal Engineer, USDA-ARS, Clay Center, NE
Additional Information
Miller, D. N., V. H. Varel, B. L. Woodbury, and M. J. Spiehs. 2010. Enhanced reduced sulfur emission from manures of beef cattle fed distiller’s byproducts. International Symposium on Air Quality and Manure Management for Agriculture Conference Proceedings, 13-16 September, Dallas, Texas. 711P0510cd.
Acknowledgements
The authors would like to acknowledge the technical expertise of Todd Bowman, Alan Kruger, and Ryan McGhee. Mention of trade names or commercial products in this publication is solely for the purpose of providing specific information and does not imply recommendation or endorsement by the U.S. Department of Agriculture. USDA is an equal opportunity provider and employer.
The authors are solely responsible for the content of these proceedings. The technical information does not necessarily reflect the official position of the sponsoring agencies or institutions represented by planning committee members, and inclusion and distribution herein does not constitute an endorsement of views expressed by the same. Printed materials included herein are not refereed publications. Citations should appear as follows. EXAMPLE: Authors. 2013. Title of presentation. Waste to Worth: Spreading Science and Solutions. Denver, CO. April 1-5, 2013. URL of this page. Accessed on: today’s date.
* Presentation slides are available at the bottom of the page.
Abstract
The 2010 USDA Agricultural Resource Management Survey (ARMS) Corn data will be used to examine the price paid for manure as a function of type of manure (i.e. species), form of manure, distance, size of farm, location, yield goal and whether the application rates of manure were influenced by Federal, State or local policies. Based on economic theory and the few empirical studies on manure use, it is hypothesized that swine manure will command a lower price than manure from cattle or poultry operations, all else equal. Liquid manure, due to dilution and volatilization of nutrients, will have a negative effect on price received. Due to transportation costs, which are included in the ARMS manure cost question, distance is hypothesized to have a positive effect on price. Farms in areas with high nutrient demand, such as the Corn Belt, are hypothesized to pay higher prices for manure while those in areas with excess manure nutrients, such as the Chesapeake Bay area, will pay lower prices or even be compensated to accept manure. Similarly, if policy affects application of manure, it is an indication that there are problems of excess manure in the area so prices are expected to be lower. Higher yield goals are expected to be positively associated with the price paid for manure since nutrient requirements will be higher.
Why Are the Economics of Manure Management Important?
Increasing fertilizer prices may affect demand for manure nutrients. If manure is viewed as a valuable resource it is more likely to be well-managed. Examining the factors affecting the price paid for manure can indicate to what extent it is viewed as a resource but also indicate what might be done to increase the real or perceived value of manure for crop production.
What Did We Do?
The USDA Agricultural Resource Management Survey (ARMS) is actually a set of surveys. Some are for the operation as a whole and some are for specific crops. The Corn Production Practices and Costs Report was conducted for the 2010 crop year by the National Agricultural Statistics Service. A specific, randomly selected field is identified and interviewers ask a variety of questions regarding management practices, yields, etc. on that field. The total size of the dataset was 2654, but this research focuses on the 919 farmers who indicated that manure was applied to the field in question. Summary statistics were calculated for this subset of the data.
The relationship between the price paid for the manure and various explanatory variables was examined using OLS regression as a first step. For the regression analysis, only farmers who indicated the manure came from off the farm were included, which reduced the number of observations to 206, 169 of which had no missing data. The cases of biosolids, sheep, and other were deleted since the numbers were too low once the farmers who applied their own manure were dropped. The dependent variable was calculated and represents the total cost of manure purchased for the field. This combined answers for the total cost for the field plus the product from answers to the amount per unit times number of units (e.g. $ per gallon times number of gallons) since farmers had a choice of how to answer the question.
What Have We Learned?
A few summary statistics on the full dataset are provided for comparison purposes. For the operation as a whole, an average of 345 acres of corn was planted in 2010. The size of the sample field was 48.5 acres. The value of corn production as a percentage of the total farm value of production was 38.4%. Only 0.34 % of farms indicated that this field was certified organic. For the initial subset of the data, 190 acres of corn was planted, the size of the sample field was 30.3 acres, the value of corn production was 18.4%, and 0.33% of farms indicated the field was certified organic. Therefore, the use of manure on the field does not seem to be associated with a higher rate of organic production. The farms that use manure were smaller than farms in the dataset as a whole and less specialized in corn production. As we see below, the majority of farmers who applied manure produced it themselves which also indicates these farms are more diversified.
The data for the subset of farmers who applied manure can be used to generally characterize manure use on farmers’ corn fields. The mean number of acres that manure was applied to in the field was 25.4, less than the average field size. The average expected corn production on the field was 5505 bu. The distance from the source of the manure to the field was on average 3.29 miles with a range from 0 to 320 miles. Of these farmers, 16% indicated that federal, state or local regulations had affected the manure application rate. The manure was applied by a custom applicator in 17% of cases. The mean custom application cost for purchased manure was $297 per field. Manure was tested in 22% of cases.
A number of categorical variables are also of interest. In the majority of cases (76.9%) farmers were applying their own manure. For manure that was sourced off the farm, 129 farmers purchased it, 79 received it for free, and 4 were compensated to accept it, showing that it is viewed as a valuable resource in most cases. The form of manure was primarily solid (635 farmers or 69%), followed by lagoon liquid (147) and slurry (136). For those who applied their own manure the percentage of solid manure was similar to all farmers applying manure (481/706 or 68%) and the lagoon form was only slightly higher (16.9% vs 16.0%). For those who applied manure from off the farm, there were slightly more cases of slurry than lagoon liquid (30 vs 28). The indicated units for manure application amounts are instructive; the majority (558) indicated tons, 232 indicated gallons, and the rest (129) indicated bushels. The number who indicated gallons is larger than the number who indicated the use of lagoon liquid so some slurry was also measured this way.
The most common animal source of the manure was dairy (453/919 or 49.3%), followed by beef (24.0%), poultry (16.4%), swine (7.6%), other (1.2%), equine (0.8%), sheep (0.3%), and there was one case of biosolids and zero cases of food waste. It should be noted that a separate set of questions related to compost, which was applied by about 2% of all the corn farmers surveyed.
The survey also indicated the ERS region for each farm. For farmers with corn who indicated that they used manure on the selected field, the majority (399 or 43.4%) were in the Northern Crescent (Lake States and Northeast). The next most common region was the Heartland (Corn Belt) with 38.7% of farmers, followed by Eastern Uplands (5.1%), Southern Seaboard (4.5%), Prairie Gateway and Northern Great Plains (each at 3.9%), and two cases each in the Basin and Range, and Fruitful Rim Regions.
For the regression analysis, only farmers who indicated the manure came from off the farm were included, which reduced the number of observations to 206, 169 of which had no missing data. The cases of biosolids, sheep, and other were deleted since the numbers were too low once the farmers who applied their own manure were dropped. The dependent variable was calculated and represents the total cost of manure purchased for the field. Farmers were given a choice as to how to answer the question, a total cost or answering two questions, number of units and price per unit. The dependent variable combined answers for the total cost for the field plus the product from answers to the amount per unit times number of units (e.g. $ per gallon times number of gallons).
The following results from the OLS regression are preliminary. The adjusted R2 for the model was 0.417. There was no effect of size of the corn operation overall as measured by total acres of corn planted. Total value of farm production would probably be a better measure of size but a fairly large number of farmers didn’t answer that question. Expected corn production on the field did not have a significant effect and the coefficient was negative. Whether the field was organic was excluded from the regression by SAS and may be partly due to the low number of observations. As one would expect, given the nature of the dependent variable, the area the manure was applied to had a positive and significant impact on the price paid. Distance between source and field was positive and significant (p=0.057). For the form of manure, the base was slurry and the price paid for lagoon liquid was higher (p=0.028), contrary to expectations. There was no price difference between solid manure and slurry. The value of beef, dairy and poultry manure was higher than that for swine manure, in line with expectations. There was no effect of government regulations. The value was significantly higher if the manure was custom applied. Contrary to expectations, there were no regional differences after controlling for the other factors.
Future Plans
Alternate specifications of the model, including alternative versions of the dependent variable, will be examined to check for robustness. A final paper will relate the findings to the small but growing literature in this area.
Ali, Sarah, Laura McCann, Jessica Allspach. “Manure Transfers in the Midwest and Factors Affecting Adoption of Manure Testing”. Journal of Agricultural and Applied Economics Vol. 4 (4), November 2012, pp. 533-548.
Nunez, Jennifer and Laura McCann. “Determinants of Manure Application by Crop Farmers” Journal of Soil and Water Conservation Vol. 63 (5) September/October 2008, pp. 312-321.
Acknowledgements
We acknowledge research funding by USDA-NIFA, Integrated Water Quality Grant Program, 110D.
The authors are solely responsible for the content of these proceedings. The technical information does not necessarily reflect the official position of the sponsoring agencies or institutions represented by planning committee members, and inclusion and distribution herein does not constitute an endorsement of views expressed by the same. Printed materials included herein are not refereed publications. Citations should appear as follows. EXAMPLE: Authors. 2013. Title of presentation. Waste to Worth: Spreading Science and Solutions. Denver, CO. April 1-5, 2013. URL of this page. Accessed on: today’s date.
With livestock operations becoming larger and more specialized, and a requirement for phosphorus based application, there is a need for farmers to transfer manure off their farm in order for manure to be applied at agronomic rates.
A survey of livestock farmers in Iowa and Missouri was conducted in the spring of 2006. It was a random sample stratified by livestock type and farm sales. The major types of livestock were dairy cows, beef cattle on feed, beef cows, swine 55lbs or less, swine more than 55lbs, broilers, and turkeys. This survey examined manure management practices in general and also included questions regarding the sale and transfer of manure. For this analysis, farmers with pasture-only operations were excluded which left 921 observations.
Over 81% of turkey farmers and over 57% of broiler operations provide manure to other farmers. Farmers providing turkey manure are also the most likely to receive money for the manure with 83% being paid for the manure versus 82% of the broiler operations. Turkey and broiler litter is also transported the furthest (13.7 and 14.8 miles on average, respectively). Turkey manure also sold for the highest price.
A probit regression analysis was conducted to determine the factors that affect whether or not a farmer provides animal manure to others. Younger farmers were significantly more likely to provide manure but education level had no significant effect. The more wheat or pasture a farm had, the less likely they were to provide manure. The percent of land rented had no effect. Increases in livestock numbers for all types except beef and swine less than 55 pounds increased the likelihood of providing manure, as expected. Whether they used a commercial fertilizer on their manured fields had no relationship to whether they provided manure to others.
Purpose
One proposed solution to excess nutrients on some livestock farms is movement to other farms with nutrient deficits (Ribaudo, et al.). Our study examined the feasibility of this solution. Our specific objectives included: 1) Identify the factors that most heavily influence which farmers sell or give their excess manure to other farmers, 2) Estimate typical hauling distances for manure from different livestock types and 3) Examine the prices that farmers are being paid for different types of livestock manure.
What Did We Do?
A survey was sent out to over 3,000 randomly selected livestock farmers in Missouri and Iowa in March and April of 2006.
Methodology for the survey process followed Dillman’s model (Dillman). We initially sent out the survey to a test group of 100 farmers. We then sent out the first wave of the final survey with a cover letter, a postage paid return envelope, and a form to fill out to enter into a drawing to win a $200 gift certificate. A reminder postcard was sent, followed two weeks later by a second wave of the complete package, again asking them to participate.
Probit regression analysis was used to identify factors affecting whether manure was provided to others.
What Have We Learned?
Summary statistics showed that 1) Turkey farmers were most likely to provide manure, 2) Over 80 percent of broiler and turkey farmers that provided manure were paid for it, 3) Broiler farmers were the most likely to hire a custom applicator, and 4) 45.69 percent of farmers providing manure to others said that manure was tested before it was applied.
With all other variables in the regression held constant, farmers were significantly more likely to provide manure if: they were younger, the farm was an AFO or CAFO, they had more animal units or fewer farmed acres, they didn’t apply fertilizer to their manured fields, they had broilers or turkeys rather than swine, they say the smell of manure bothers them and, they agree that properly managing manure improves water quality. However, cropping system or concern for water quality had no effect.
Research needs to find economically feasible ways for farmers to transport their excess manure off of their farm, especially for less dry types of manure, such as that from dairy cattle or swine.
Future Plans
A publication including some of these results, plus a study on the factors affecting manure testing of material transferred off the farm has been published. Future research involves looking at the factors affecting the value of manure purchased by corn farmers using the USDA ARMS dataset (see presentation by McCann at this conference).
Jessica Amidei (first author, now Allspach), Callao, Missouri
Haluk Gedikoglu, Assistant Professor, Lincoln University
Robert Broz, Extension Assistant Professor, University of Missouri
John Lory , Extension Associate Professor, University of Missouri
Ray Massey, Extension Professor, University of Missouri
Additional Information
Ali, S., L. McCann, and Jessica Allspach. 2012. “Manure Transfers in the Midwest and Factors Affecting Adoption of Manure Testing”. Journal of Agricultural and Applied Economics 44:3 (November 2012) pp. 533-548.
Acknowledgements
This work was partially funded through USDA Water Quality 406 Grant 2005-51130-02365 and we express our sincere thanks.
The authors are solely responsible for the content of these proceedings. The technical information does not necessarily reflect the official position of the sponsoring agencies or institutions represented by planning committee members, and inclusion and distribution herein does not constitute an endorsement of views expressed by the same. Printed materials included herein are not refereed publications. Citations should appear as follows. EXAMPLE: Authors. 2013. Title of presentation. Waste to Worth: Spreading Science and Solutions. Denver, CO. April 1-5, 2013. URL of this page. Accessed on: today’s date.
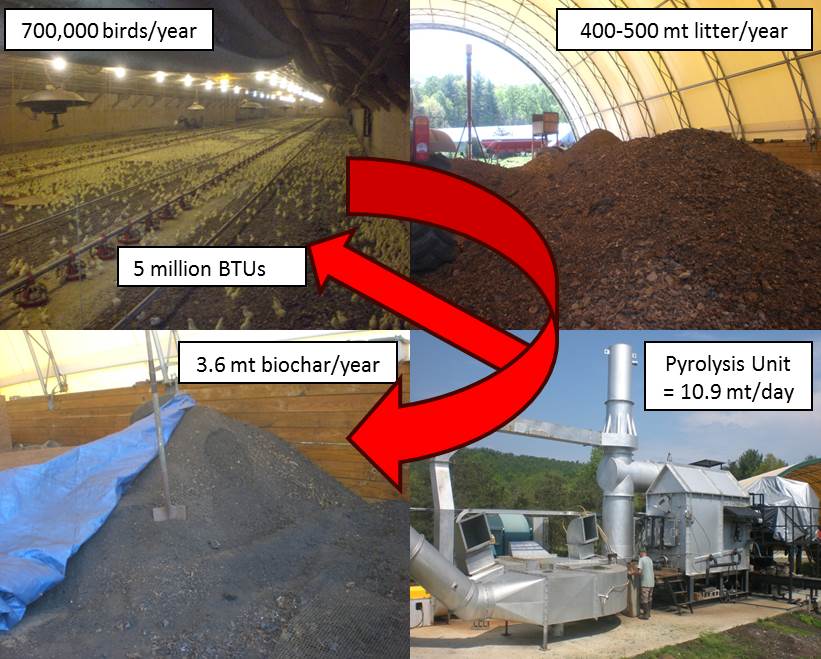
Manure from confined animal operations is an environmental liability because of the potential for water and air pollution. The poultry industry in the Chesapeake Bay watershed is under increased regulatory scrutiny due to nitrogen and phosphorous inputs into the Bay. Although poultry litter (PL) is valued as a fertilizer, the cost of shipping the bulky material out of the watershed is prohibitive. One potential solution is to turn the excess litter into energy through pyrolysis. If a market can be developed for poultry litter biochar, more N and P could be removed from the Chesapeake Bay watershed.
Our overall program goals are to develop a comprehensive strategy to convert poultry litter from an environmental liability into an economic and ecological asset and to develop a comprehensive conceptual model for improving poultry litter waste management through market-driven alternatives. Our specific objectives are to characterize the properties and variability of biochar from a commercial poultry/ litter biochar producer, evaluate PL biochar for two potential commercial uses; greenhouse plant production and as an amendment for degraded mine soils.
Why Is It Important to Develop Alternative Markets for Biochar?
Excess phosphorus (P) in the Chesapeake Bay watershed has created water quality problems within the Bay. A major source of this P originates from confined animal feeding operations (CAFOs); within the West Virginia portion of the watershed, primarily in the form of poultry production. The lack of sufficient, suitable cropland on which to spread the manure from these operations has created the need to export P out of the watershed. One potential solution to this challenge may come from the gasification of poultry litter. Gasification produces energy and a carbonaceous byproduct (Figure 1) for which a number of applications have been suggested, including use as a soil amendment. Our long-term objectives are to determine the beneficial uses for a commercially produced poultry litter biochar (PLB) with the goal of generating a market for PLBs that will promote the transport of P out of the Bay watershed. In this work, we describe the particle size distribution and nutrient content of two different pyrolysis oven batch runs of poultry litter from our commercial producer (M-type and W-type).We describe effects of these PLB types on lettuce seed germination and seedling growth and its use as a substitute greenhouse media for cyclamen production. We also describe the results of an experiment using PLB for mine soil reclamation and cellulosic biomass production.
What did we do?
M-Type and W-type PLBs were mechanically sieved into six size classes in duplicate and then extracted with dilute hydrochloric (0.05M) and sulfuric (0.05M) acids. Solution sodium (Na), potassium (K), calcium (Ca), magnesium (Mg) and P concentrations were determined and converted to mg (kg PLB)-1. Lettuce (Lactuca sativa var. Black Simpson) seed was planted into a commercial top soil amended with two rates of M-type biochar (3.18 g kg-1) and (9.09 g kg-1), some of which had been rinsed with water for 24 or 48 hours to remove salts, with no biochar and fertilizer controls, in two 8 x 8 Latin Square designs. In one Latin Square seedlings were thinned to two per cell and allowed to grow until root bound. Germination percent and dry mass were determined. The second PLB product (W-type) was used untreated as a substitute potting media for greenhouse cyclamen (Cyclamen persicum) production The treatments were a commercial mix, 1:1 peat:perlite + 64 g dolomitic lime or + 112 g W-type PLB. One of the products (M-type) was washed in tap water in an attempt to reduce salt content and then leached and unleached PLB (2.5 kg m-2) was used (lime and fertilizer controls) in a factorial experiment using switchgrass (Panicum virgatum) and Miscanthus sinensis transplants for mine soil reclamation.
What we have learned?
The M-type PLB had more, fine particles (<60 mesh) than did W-Type). The M-type fine particles (<60 mesh) had more Ca and K whereas the coarser W-type particles (>60 mesh) had more K. PLB did not have a significant effect on lettuce germination (> 85%) at either concentration or rinsing treatment. PLB treatments also had no effect on aerial biomass of lettuce yield. The inorganic fertilizer treatment was the only treatment with aerial biomass significantly different (higher) than the control. Cyclamen growth was initially slower, but by the end of the experiment, yields were equivalent. It is too soon to draw conclusions from the mine soil reclamation experiment.
Future plans
We will continue monitoring switchgrass and Miscanthus growth and mine soil property changes in response to biochar applications and are seeking additional disturbed soil sites for new experiments. Because biochar is known to sorb metal contaminants, we have initiated laboratory experiments to evaluate the effectiveness of biochar for the remediation of brownfield sites. We also have plans to determine the stability of biochar in a variety of soils and the effects of biochar applications on soil microbial communities and greenhouse gas emissions.
James T. Anderson, Professor. Environmental Research Center, West Virginia University
Additional information
Anderson, J. T., C. N. Eddy, R. L. Hager, L M. McDonald, J. L. Pitchford, J. Skousen, and W. E. Veselka IV. 2012. Reducing impacts of poultry litter on water quality by developing markets for energy and mine land reclamation. Athens: ATINER’S Conference Paper Series, No: ENV2012-0069. 12pp. http://www.atiner.gr/papers/ENV2012-0069.pdf
Acknowledgements
Support for this project was provided by NOAA, NSF, blue moon fund, Frye Poultry Farms, and the Davis College of Agriculture, Natural Resources and Design and Environmental Research Center at West Virginia University.
The authors are solely responsible for the content of these proceedings. The technical information does not necessarily reflect the official position of the sponsoring agencies or institutions represented by planning committee members, and inclusion and distribution herein does not constitute an endorsement of views expressed by the same. Printed materials included herein are not refereed publications. Citations should appear as follows. EXAMPLE: Authors. 2013. Title of presentation. Waste to Worth: Spreading Science and Solutions. Denver, CO. April 1-5, 2013. URL of this page. Accessed on: today’s date.
* Presentation slides are available at the bottom of the page.
Abstract
Ration optimization models currently minimize the purchase price of feeds used to meet nutrient requirements. Not included in optimization models is the value of manure nutrients resulting from ration alternatives. This project extends the linear program that is used to minimize ration cost to include the value of manure excreted and stored. Microsoft EXCEL’s Solver GRG Nonlinear Add-in is used to optimize the integrated decision because of the non-linear aspects of manure excretion as a function of feed fed.
Several economic and production changes over the last 10 years warrant an investigation of the impact of optimizing both feed and manure decisions simultaneously. Distillers Dried Grains with Solubles (DDGS) have become a common feed high in phosphorus, lessening the need for inorganic phosphorus sources. Including DDGS in the diet also increases the manure concentration of phosphorus. If phosphorus is needed on nearby crop fields, there is potential to increase manure value while simultaneously reducing feed cost. In contrast, feeding phytase may reduce feed cost, while reducing manure value if phosphorus in manure is valued. Feeding synthetic amino acids can also reduce feed cost while reducing the amount of nitrogen excreted and available as a fertilizer in the manure. Adding to the importance of considering manure value is the increased costs of fertilizers. Manure is increasingly seen as a viable alternative to commercial fertilizers and might affect the whole farm profitability if included in the ration cost decision.
This project considers swine rations and examines how they might have changed during the past 10 years if manure value had been incorporated into the ration optimization decision. We will attempt to determine when manure fertilizer value relative to feed costs justifies integrating feed and manure optimization. Results indicate that incorporating manure value into the optimization routine would change some diet formulations.
Why Consider Manure Nutrients When Balancing Rations?
The value of manure supplied nutrients (N, P and K) has increased significantly over the past decade. Feedstuffs, such as DDGS, have been incorporated into the diets in ways that reduce the need for P supplementation. These developments have moved manure from a waste product to a co-product in livestock production. By integrating feed and manure management decisions it was hypothesized that profit could be improved.
What Did We Do?
The 2012 version of the National Swine Nutrition Guide (NSNG) ration software contains an optimization model for least cost ration formulation that calculates the potential manure value associated with different optimized diets. This recognition of the value of manure is an important contribution.
We incorporated the value of manure (as estimated by the NSNG) into the least cost ration optimization routine so that the objective function changed from minimizing the cost of feed to minimizing the net cost of feed. Net diet cost was defined as the cost of feed less the value of manure. Optimization of this equation required the use of the GRG non-linear optimization routine of Microsoft EXCEL.
This project evaluated least cost swine rations and how they might have changed during the past 10 years if manure value had been incorporated into the ration optimization decision. We specifically examined rations for 50-100 lb. and 200-250 lb. pigs. Rations were optimized with the following limitations: 1) manure was/was not included in the objective function; 2) DDGS were/were not allowed as a feedstuff in the rations.
What Have We Learned?
Assuming that the full value of the manure could be obtained, incorporating manure into the least cost ration optimization reduced net diet cost seven of the last 10 years for 50-100 lb. and 200-250 lb. pigs when DDGS were allowed in the diets. The ten-year mean improvement in net diet cost was $0.61/ton with a range from $0 to $8.41/ton of feed. More typically differences were small, exceeding $1.00/ton only in 2005 and 2006. Increasing manure value required increasing feed cost by an a 10-year average of $1.14/ton. The uncertainty in extracting manure value may make farmers hesitant to increase feed cost in hopes of capturing additional manure value. Two years may provide insight into the opportunity to incorporate manure value into the least cost feed decision. In 2006, a savings of $8.41/ton of feed fed was obtained by including 40% DDGS in the 50-100 lb. pig diet; this savings required increasing the feed cost by $1.76/ton resulting in a $10.18/ton increase in manure value in associated excreted nutrients. In 2009, a net ration savings of $.61/ton was obtained by eliminating phytase which was in the original least cost ration formulation. Phytase reduced the need for expensive phosphorus feedstuffs but not sufficiently when the value of manure was considered.
Future Plans
Non-linear optimization routines may find local optima rather than a global optimum. A procedure needs to be developed that insures that the global optimum is found before incorporating manure into the least cost ration decision will become widespread.
Authors
Dr. Ray Massey, Extension Professor, Agricultural and Applied Economics, University of Missouri, masseyr@missouri.edu
John Lory, Extension Associate Professor of Extension, Division of Plant Science, University of Missouri
Marcia Shannon, Associate Professor, Swine Nutrition, University of Missouri
The authors are solely responsible for the content of these proceedings. The technical information does not necessarily reflect the official position of the sponsoring agencies or institutions represented by planning committee members, and inclusion and distribution herein does not constitute an endorsement of views expressed by the same. Printed materials included herein are not refereed publications. Citations should appear as follows. EXAMPLE: Authors. 2013. Title of presentation. Waste to Worth: Spreading Science and Solutions. Denver, CO. April 1-5, 2013. URL of this page. Accessed on: today’s date.
Anaerobic digestion has many advantages both environmentally and economically. First, it produces renewable energy in the form of methane, a renewable energy source, which leads to a steady increase in the number of anaerobic manure digesters in the United States. According to the report from the World Dairy Expo held in Madison, Wisconsin in 2009 (Expo’09, 2009), the US dairy industry is taking the lead in adopting anaerobic technology because the majority (over 75%) of operating US manure digesters is installed on dairy farms. It is anticipated that this trend will continue as the country has determined to reduce its reliance on ever diminishing fossil-based energy resources.
Second, the technology can significantly reduce the polluting strength of the treated waste materials, such as chemical oxygen demand (COD), thus ameliorating their pollution potential to the environment when discharged. Due to the nature of dairy operations, a tangible amount of milk coming from the milking parlor wastewater is often discharged to the bulk manure, which can dramatically increase the COD level of such waste streams. The high COD content (190,000 mg/L) of milk makes the common practice of land applying the milk contaminated manure dangerous due possibly to the potential of causing severe contamination of surface and ground waters from runoff and leaching. Such practice is therefore drawing increased scrutiny from the public and environmental regulatory agencies. Fortunately, with the number of dairy producers willing to adopt anaerobic digesters on their farms continuing to grow, the concern for such pollution could be tempered.
However, a remaining question of this remedy is whether the added milk has any impact on the overall digestion process in terms of biogas production and pollutants removal.
What Did We Do?
In this project, the overall response of co-digesting dairy manure with milk added at 7 different levels, i.e., 1, 3, 5, 7, 9, 14, and 19%, using lab-scale batch anaerobic digesters was investigated. The co-digestion performance was evaluated based on total biogas volume production, methane concentration, and its volume in the biogas generated. The changes and/or reductions in COD of the treated liquid were also presented.
What Have We Learned?
Cumulative Biogas Production Affected by Different Milk Content
First, increasing milk content could increase the cumulative biogas production during the operation, with the total volume of biogas produced being 5260, 5790, 6300, 7010, 7480, 8960, and 10150 mL for the milk treatments of 1, 3, 5, 7, 9, 14, and 19%, respectively, as opposed to the control (4980 mL). Second, higher milk content could significantly raise the initial biogas production rate. Third, the presence of milk appeared to have some influence on the stability of the digestion process, as evidenced by the fluctuation of biogas production at high milk concentrations. For instance, the treatments having milk content up to 7% demonstrated a similar trend. But for milk content of 9, 14, and 19%, the fluctuation in biogas production volume became progressively conspicuous. Especially for the 19% milk treatment, the biogas volume produced first jumped from 190 mL at 6 hour to 1190 mL at 12 hour after the digestion started, followed by a relatively moderate production period before it jumped again after 8 days of digestion. Considering the results from this study, it may be concluded that milk can increase biogas production when co-digested with dairy manure.
Cumulative CH4 Volumes Affected by Different Milk Content
The performance of different treatments in cumulative CH4 production indicates that adding milk to dairy manure digestion will promote the volumetric production of both biogas and methane. However, the CH4 content in the produced biogas deteriorated as the milk content increased (from 66.5% for the control to 63.5% for 19% milk treatment). It can thus be inferred that although the volumes of total biogas and methane were increased by increasing the milk content in the digester, the increase in methane volume was not in tandem with that in total biogas volume, implying that a significant amount of CO2 was concurrently produced. Apparently, the presence of milk in the digestion substrate is the only legitimate cause for the increasing production of CO2. In addition, although the effect of milk on lowering the CH4 content in biogas is observed for all milk treatments, the extent of such an effect is different. The milk impact on CH4 content in biogas was not significant for manure containing milk up to 3% (v/v), but it turned significant at 5%. Summarizing the above discussions leads to an intuitive suggestion that in order to avoid production of a substantial amount of CO2 due to the spilled milk in the digestion process, dairy producers should manage to control the milk content in the digester liquid ≤ 3%.
COD, TKN, and C/N Ratio Changes in Digestates From the Digestion of Dairy Manure with Milk
The added milk substantially increased the digester content COD as the amount of milk increased. However, at the end of the experiment, the final COD concentration in most digester effluent samples reached a fairly similar level, suggesting that the digestion process for the majority of the treatments was completed properly. In addition, since all the experiments were run on the same time schedule, the COD degradation efficiency obviously increased with increasing milk addition from 49.7% for the control to 77.8% for the 19% milk treatment. The improved COD removal efficiency in company with the increasing milk content could be attributed to the gradually elevated C/N ratio due to the added milk (from 5.19 for the control to 10.7 for the 19% treatment) because it is recognized that the optimum C/N ratio for anaerobic digestion is around 20/1 to 30/1, which could explain the continuous increase in COD removal as the C/N ratio increased. At the end of experiment, the effluent C/N ratio averaged 2.75, which was very close to the value for the digested dairy manure (2.83). As for TKN, the removal efficiency is almost negligible, which is the typical behavior commonly observed for anaerobic digestion, indicating that the digestion operation was carried out successfully. Based on the information obtained from this study, it may be concluded that milk content up to 19% (v/v) in dairy manure may have little negative impact on COD removal efficiency in the anaerobic digestion process.
Future Plans
Two stage digestion process to produce hydrogen and methane may be studied with milk addition.
Dong, C., Associate Professor, Zhejiang Gongshang University, Hangzhou, China
Yao, W., Postdoc, University of Kentucky
Additional Information
Wu, X., C. Dong, W. Yao, J. Zhu. 2011. Anaerobic digestion of dairy manure influenced by the wasted milk from milking operations. Journal of Dairy Science 94(8): 3778-3786.
Acknowledgements
The authors wish to thank the Minnesota Legislature Rapid Agricultural Response Fund for providing financial support to this project.
The authors are solely responsible for the content of these proceedings. The technical information does not necessarily reflect the official position of the sponsoring agencies or institutions represented by planning committee members, and inclusion and distribution herein does not constitute an endorsement of views expressed by the same. Printed materials included herein are not refereed publications. Citations should appear as follows. EXAMPLE: Authors. 2013. Title of presentation. Waste to Worth: Spreading Science and Solutions. Denver, CO. April 1-5, 2013. URL of this page. Accessed on: today’s date.
In recent years, sharply rising costs of inorganic fertilizers have contributed to an increased demand for manure and compost in crop production acreage, transforming cattle manure from a valueless waste to a viable alternative to commercial fertilizer. If additional demand for manure as a bio-fuel were to arise manure could take on two distinct values, a fertilizer value and a fuel value. This potential “dual” value of manure begs several questions. What would the fertilizer and fuel markets of manure look like? Is there enough manure supply for the markets to operate independently? If not, which market would prevail? In essence, how, if at all, would manure’s potential value as a bio-fuel distort the traditional Panhandle manure market? A modeling framework was developed to assess the potential impacts of a manure-fired ethanol plant on the existing Texas Panhandle manure fertilizer market. Two manure-allocation runs were performed using a spreadsheet model. Run #1 allocated all available manure from dairies and feedlots to cropland as manure fertilizer; run #2 first allocated fuel manure to the ethanol plant and then allocated the remaining manure to cropland. Both model runs assumed a time horizon of one year and no antecedent nutrients in cropland soils. Other constraints included only irrigated acreages received manure and no supplemental fertilizer was used. The model revealed a 6.4% increase in cost per acre of fertilizing with manure for fields whose nutrient requirements were fully satisfied in both runs. The increase in cost per acre was likely due to an increase in hauling distances attributed to fewer CAFOs available for fertilizer manure. The model is not presented as a dynamic, systems model, but rather a static model with the potential to be incorporated into a more dynamic systems-based modeling environment. Suggestions for further model development and expansion including GAMS integration are presented.
Why Model Manure Transport and Use?
To demonstrate the potential for systems modeling to characterize manure flows in response to fertilizer prices, biofuel demand, and other externalities in the Texas Panhandle
Conceptual model diagram.
What Did We Do?
We develeloped a spreadsheet based modeling framework to evaluate how both manure use and transport might be affected by regional changes in fertilizer prices, crop composition, and biofuel demand. Specifically, we evaluated how traditional fertilizer valued manure flows might be affected by potential biofuel based flows stemming from a proposed manure-fired ethanol plant. Two model simulations representing manure flows with and without biofuel manure demand from the proposed plant were performed.
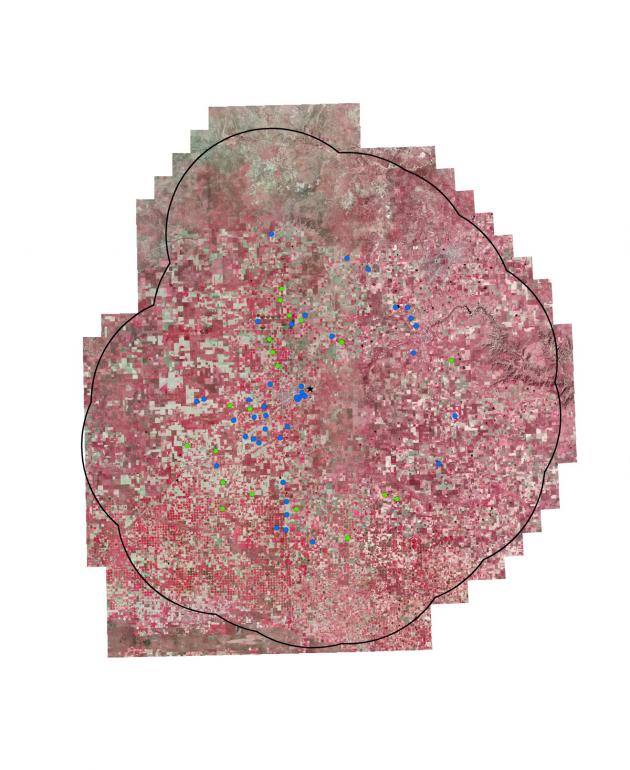
Explicit model boundary shown with TNRIS satellite imagery used to locate and identify center pivot irrigated fields.
What Have We Learned?
Although the cattle industry in Texas Panhandle generates a substantial volume of manure, almost all of it is land applied as fertilizer. However, the introduction of manure-fired facilities such as the proposed ethanol plant would undoubtedly change the dynamics of the existing manure market by introducing at least additional demand, if not a second value-based market. Assuming only transportation costs of acquiring manure for biofuel, our model simulations suggested a 6.4% increase in cost per acre for lands whose manure requirements were fully satisfied in both simulations. Assuming that manure for biofuel received an allocation preference for proximity to the plant, we propose that costs associated with having to transport manure over longer distances significantly contributes the the increased cost per acre for fertilized lands.
In terms of what we learned about systems modeling, we have experienced (although anticipated) that translating broad, systems based conceptual modeling ideas into an explicit, user friendly, and robust modeling interface can be extremely challenging. Although systems-based modeling efforts occur largely at a macro level, they often require extensive supplemental datasets. We have experienced difficulty in identifying software packages that are equipped to adequately handle both aspects of systems modeling.
Future Plans
We plan to continue to develop and expand the current modeling framework by incorporating a GIS-based water availability aquifer component, expanding the current crop-composition database, and providing logic algorithms for producer-based management decisions using GAMS (General Algebraic Modeling System) optimization modeling.
Manure allocation map for model run #1 (232 LMU cells allocated).
Authors
Brent Auvermann, Professor of Biological and Agricultural Engineering, Texas A&M AgriLife Research, b-auvermann@tamu.edu
Gary Marek, Postdoctoral Research Associate, Texas A&M AgriLife Research; Brent W. Auvermann, Professor of Biological and Agricultural Engineering, Texas A&M AgriLife Research; Kevin Heflin, Extension Associate, Texas A&M AgriLife Extension
Additional Information
Please contact Gary Marek, Postdoctoral Research Associate, Texas A&M AgriLife Research, 6500 Amarillo Boulevard West, Amarillo TX, 79106, Phone: 806-677-5600, Email: gwmarek@ag.tamu.edu or Brent W. Auvermann, Professor of Biological and Agricultural Engineering, Texas A&M AgriLife Research, 6500 Amarillo Boulevard West, Amarillo TX, 79106, Phone: 806-677-5600, Email: b-auvermann@tamu.edu.
Acknowledgements
Special thanks to Dr. Raghavan Srinivasan and David Shoemate of the Texas A&M University Department of Ecosystem Science and Management Spacial Sciences Laboratory for their help in GIS processing scripts.
The authors are solely responsible for the content of these proceedings. The technical information does not necessarily reflect the official position of the sponsoring agencies or institutions represented by planning committee members, and inclusion and distribution herein does not constitute an endorsement of views expressed by the same. Printed materials included herein are not refereed publications. Citations should appear as follows. EXAMPLE: Authors. 2013. Title of presentation. Waste to Worth: Spreading Science and Solutions. Denver, CO. April 1-5, 2013. URL of this page. Accessed on: today’s date.
Little information is currently available concerning odor emissions following land application of beef cattle manure. This study was conducted to measure the effects of diet, tillage, and time following land application of beef cattle manure on the emission of volatile organic compounds (VOC).
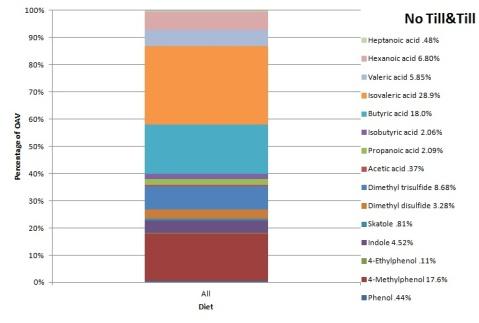
Each of the experimental treatments which included tillage (broadcast or disked) and diet (0, 10, or 30% wet distillers grain (WDGS)) were replicated twice. A 5-m tandem finishing disc was used to incorporate the manure to a depth of approximately 8 cm. Small plots (0.75 m x 2.0 m) were constructed using 20 cm-wide sheet metal frames. A flux chamber was used to obtain air samples within the small plots at 0, 1, 2, 6, and 23 hours following manure application. The flux of fifteen VOC including fatty acids, aromatic compounds, and sulfur containing compounds were measured. Based on odor threshold, isolavleric acid, butyric acid, and 4-methylphenol provided 28.9%, 18.0%, and 17.7%, respectively, of the total measured odor activity. Heptanic acid, acetic acid, skatole, 4-methyphenol, and phenol each contributed less than 1% of the total odor activity. Dimethy disulfide (DMDS) and dimethyl trisulfide were the only measured constituents that were significantly influenced by diet.
DMDS values were significantly greater for the manure derived from the 30% WDGS diet than the other manure sources. No significant differences in DMDS values were found for manure derived from diets containing 0% and 10% WDGS. Tillage did not significantly affect any of the measured VOC compounds. Each of the VOC was significantly influenced by the length of time that had expired following land application. In general, the smallest VOC measurements were obtained at the 23 hour sampling interval. Diet, tillage, and time following application should each be considered when estimating VOC emissions following land application of beef cattle manure.
Why Study Factors Affecting Manure Application Odors?
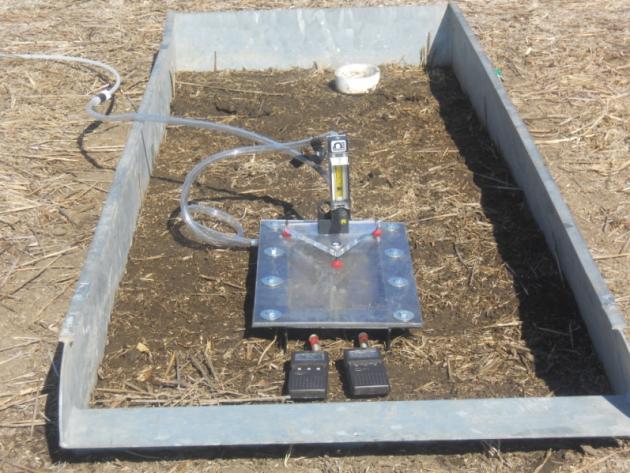
Measure the effects of diet, tillage and soil moisture on odor emissions follow land applied beef manure.
Figure 2. Relative contribution of odorant to the total odor activity.
What Did We Do?
Twelve plots were established across a hill slope. Treatments were tillage (broadcast or disked) and diet (0%, 10%, or 30% WDGS). Beef manure was applied at 151 kg N ha-1 yr-1. Gas samples were collected using small wind tunnels and analyzed using a TD-GC-MS. (Fig. 1). VOC samples were collected at 0, 1, 2, 6, and 23 hours following manure application. A single application of water was applied and the gas measurement procedure was repeated. The effects of tillage, diet, test interval, and the sample collection time on VOC measurements were determined using ANOVA (SAS Institute, 2011).
What Have We Learned?
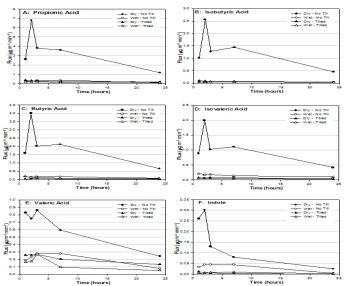
Isovaleric acid, butyric acid, and 4-methylphenol accounted for 28.9%, 18.0%, and 17.7%, respectively of the total odor activity (Fig. 2). Dimethyl disulfide (DMDS) and dimethyl trisulfide (DMTS) emissions were significantly increased by the 30 % WDGS diet. The flux increase for DMDS was over 4 times greater for the 30% WDGS diets. Tillage did not significantly affect any of the measured VOC compounds. The largest propionic, isobutric, butyric, isovaleric, and valeric acid measurements occurred with no-tillage under dry condition (Fig. 3A-E). Generally, measured values for these constituents were significantly greater at the 0, 1, 2, and 6 hour sampling intervals than at the 23 hour interval (Fig. 3A-E). The larger emissions for no-till, dry conditions may be due to the drying effect resulting when the manure was broadcast on the surface. As the manure begins to dry, the water soluble VOCs are released from solution. The tilled and wet conditions would reduce its release of VOC due to the increased moisture conditions.
Figure 3. Flux values for propionic, isobutyric, butyric, isovaleric , valeric acid and indole as affected by tillage, soil moisture, and time.
Future Plans
Additional studies are planned to quantify the moisture and temperature effect on odorous emissions.
We would like to thank Todd Boman, Sue Wise, Charlie Hinds and Zach Wacker for their invaluable help on making this project a success.
The authors are solely responsible for the content of these proceedings. The technical information does not necessarily reflect the official position of the sponsoring agencies or institutions represented by planning committee members, and inclusion and distribution herein does not constitute an endorsement of views expressed by the same. Printed materials included herein are not refereed publications. Citations should appear as follows. EXAMPLE: Authors. 2013. Title of presentation. Waste to Worth: Spreading Science and Solutions. Denver, CO. April 1-5, 2013. URL of this page. Accessed on: today’s date.
Many states conduct water quality monitoring projects and within the past decade, sub-watershed and whole farm water quality monitoring has gained more traction as a preferred method to understand runoff and nutrient loading behavior. The one aspect of these projects that has evolved is the level of partnering. Partnering not just with technical and academic groups but fully partnering and involving the landowner or resource manager. The Discovery Farms model is a great example of a fully partnered, adaptive management water quality monitoring project that began in Wisconsin and has grown to formally include North Dakota, Minnesota and Arkansas. The main objective of the Discovery Farms projects is to fully engage producers in the identification and if necessary the reduction of nutrient and sediment losses from a variety of agriculture farming systems by collecting runoff data from real, working farms. The program is founded on the belief that farmers who are engaged, educated and empowered with actual on-farm information will use the data to address water quality concerns. The concept has demonstrated successes and is gaining interest around the country from producers and their commodity organizations.
This workshop will share experiences, successes, the principals of operation and key tasks needed to develop and implement Discovery Farms programs. Among the four states; edge of field, tile drainage and feedlot monitoring is being conducted for a diverse set of agricultural production systems. The purpose of the workshop is two-fold: 1) to provide guidance and advice to help other States develop plans and partnerships with stakeholder groups to build Discovery Farms programs in their respective States, and 2) allow participating farmers the opportunity to share what they have learned from the monitoring done on their farms and how they have reacted to that new knowledge.
Mike Daniels, Univ of Arkansas, Andrew Sharpley, Univ of Arkansas, Dennis Frame, Univ of WI-Madison, Warren Formo, Minnesota Discovery Farms
The authors are solely responsible for the content of these proceedings. The technical information does not necessarily reflect the official position of the sponsoring agencies or institutions represented by planning committee members, and inclusion and distribution herein does not constitute an endorsement of views expressed by the same. Printed materials included herein are not refereed publications. Citations should appear as follows. EXAMPLE: Authors. 2013. Title of presentation. Waste to Worth: Spreading Science and Solutions. Denver, CO. April 1-5, 2013. URL of this page. Accessed on: today’s date.
A recording is not available of Doyla Johannes (a North Dakota farmer) who is an active participant in the North Dakota Discovery Farms program, but his slides are below:
The Michigan Agriculture Environmental Assurance Program (MAEAP) is a holistic approach to environmental protection. It helps farmers evaluate their entire operation, regardless of size or commodity, and make sustainable management decisions balancing society’s needs, the environment, and economics. MAEAP is a partnership effort that aims to protect natural resources and build positive communities by working with farmers on environmentally responsible agricultural production practices.
To become MAEAP verified, farmers must complete three comprehensive steps: educational seminars, an on-farm risk assessment, and development and implementation of an action plan addressing potential environmental risks. The Michigan Department of Agriculture and Rural Development (MDARD) conducts an on-farm inspection to verify program requirements related to applicable state and federal environmental regulations, including the Generally Accepted Agricultural and Management Practices (GAAMPs). MAEAP benefits Michigan by helping to protect the Great Lakes by using proven scientific standards to improve air, water, and soil quality. Annual phosphorus reduction through MAEAP is over 340,451 pounds per year which is enough to grow almost 85,104 tons of algae in lakes and streams. Farming is an environmentally intense practice and the MAEAP-verification process ensures farmers are making choices that balance production and environmental demands. The measures aimed at protecting air, soil, water, and other environmental factors mean that MAEAP-verified farmers are committed to utilizing farming practices that protect Michigan’s natural resources.
Purpose
The Michigan Agriculture Environmental Assurance Program (MAEAP) is an innovative, proactive program that assists farms of all sizes and all commodities voluntarily prevent or minimize agricultural pollution risks. MAEAP is a collaborative effort of farmers, Michigan Department of Agriculture and Rural Development, Michigan Farm Bureau, commodity organizations, universities, conservation districts, conservation groups and state and federal agencies. MAEAP teaches farmers how to identify and prevent environmental risks and work to comply with state and federal environmental regulations. Farmers who successfully complete the three phases of a MAEAP system (Farmstead, Cropping or Livestock) are rewarded by becoming verified in that system.
What Did We Do?
To become MAEAP-verified, farmers must complete three comprehensive steps: educational seminars, a thorough on-farm risk assessment, and development and implementation of an action plan addressing potential environmental risks. The Michigan Department of Agriculture and Rural Development (MDARD) conducts an on-farm inspection to verify program requirements related to applicable state and federal environmental regulations, including the Generally Accepted Agricultural Management Practices. To retain MAEAP verification, a farm must repeat all three steps including MDARD inspection every three years.
Local MAEAP farm verified in the Cropping System
What Have We Learned?
The MAEAP program is positively influencing Michigan producers and the agriculture industry. Annually, an average of 5,000 Michigan farmers attend an educational session geared toward environmental stewardship and MAEAP verification. To date, over 10,000 farms are participating with over 1,500 MAEAP verifications. On a yearly basis, over $1.2 million is spent for practice implementation by producers working towards MAEAP verification. In 2012; the sediment reduced on MAEAP-verified farms could have filled 28,642 dump trucks (10 yards each), the phosphorus reduced on MAEAP farms could have grown 138,056 tons of algae in surface waters, and the nitrogen reduced on MAEAP farms could have grown 45,515 tons of algae in surface waters.
An example of the partnership between MAEAP and Michigan Farm Bureau
Future Plans
Michigan Governor Rick Snyder has taken a vested interest in the value of the MAEAP program. In March of 2011, Governor Snyder signed Public Acts 1 and 2 which codify MAEAP into law. This provides incentives and structure for the MAEAP program. It is a goal of Governor Snyder’s to have 5,000 farms MAEAP-verified by 2015. Most importantly, through forward thinking MAEAP strives to connect farms and communities, ensure emergency preparedness and protect natural resources.
Authors
Jan Wilford, Program Manager, Michigan Department of Agriculture & Rural Development – Environmental Stewardship Division, wilfordj9@michigan.gov
Shelby Bollwahn, MAEAP Technician – Hillsdale Conservation District
The authors are solely responsible for the content of these proceedings. The technical information does not necessarily reflect the official position of the sponsoring agencies or institutions represented by planning committee members, and inclusion and distribution herein does not constitute an endorsement of views expressed by the same. Printed materials included herein are not refereed publications. Citations should appear as follows. EXAMPLE: Authors. 2013. Title of presentation. Waste to Worth: Spreading Science and Solutions. Denver, CO. April 1-5, 2013. URL of this page. Accessed on: today’s date.
Manage Cookie Consent
To provide the best experiences, we use technologies like cookies to store and/or access device information. Consenting to these technologies will allow us to process data such as browsing behavior or unique IDs on this site. Not consenting or withdrawing consent, may adversely affect certain features and functions.
Functional
Always active
The technical storage or access is strictly necessary for the legitimate purpose of enabling the use of a specific service explicitly requested by the subscriber or user, or for the sole purpose of carrying out the transmission of a communication over an electronic communications network.
Preferences
The technical storage or access is necessary for the legitimate purpose of storing preferences that are not requested by the subscriber or user.
Statistics
The technical storage or access that is used exclusively for statistical purposes.The technical storage or access that is used exclusively for anonymous statistical purposes. Without a subpoena, voluntary compliance on the part of your Internet Service Provider, or additional records from a third party, information stored or retrieved for this purpose alone cannot usually be used to identify you.
Marketing
The technical storage or access is required to create user profiles to send advertising, or to track the user on a website or across several websites for similar marketing purposes.