Why Consider the Costs of Manure Transport in Nutrient Planning?
* Presentation slides are available at the bottom of the page.
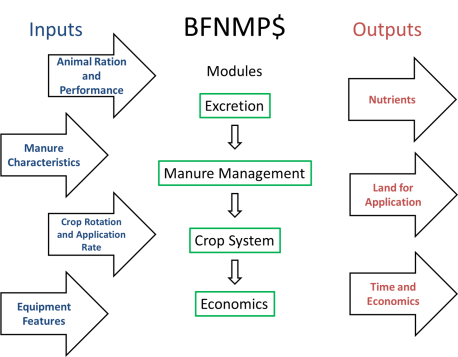
The Beef Feed Nutrient Management Planning Economics (BFNMP$) computer program can assist producers in understanding the impacts manure handling changes could have on their operation. It calculates manure management economics based on animal nutrient intake, manure nutrient availability, land requirements for spreading, operating costs, and fertilizer value. These values can be altered to fit individual operations. The objective of this analysis was to use the BFNMP$ software tool to evaluate the effect of distillers grains inclusion, nitrogen (N) volatilization, and manure application rate on feedlot nutrient management plans.
The BFNMP$ software tool is organized into 4 modules with producers entering information about their operation and then viewing the results. Outputs include nutrients produced, land needed for manure application, time the plan will take to implement, and economic implications.
What Did We Do?
This program was used to determine 1) impact of dietary N and P from traditional grain based diets compared to diets including 40% distillers grains (DG); 2) effect of different N volatilization (VOL) rates; 3) impact of changing manure application rates from N to P based and from 1 to 4 yr rates. While comparing scenarios, all other factors in the model were constant. These scenarios fed out 5,000 cattle per year in 100 hd pens from 341 to 591 kg with 144 d on feed.
What Have We Learned?
Increasing dietary N and P, with a 40% DG diet, increases excretion of these nutrients. Capturing these nutrients in manure increases costs, but increases value at a greater rate. Manure from cattle fed a traditional feedlot diet with 50% N VOL has a value of $21.53/animal ($14.45/Mg) based on inorganic fertilizer values. Feeding a 40% DG ration results in manure worth $29.70/animal ($19.94/Mg). Decreasing N VOL to 20% increases value of the manure to $26.55/animal ($17.83/Mg) and $37.11/animal ($24.93/Mg) for the grain based and DG diet, respectively. Phosphorus based applications require about 3 times the acres of N based applications, but spreading on a N basis results in excess P buildup. Spreading enough manure in 1 yr to meet crop P requirements for 4 yrs costs approximately the same as spreading manure every yr to meet N requirements.
Future Plans
The BFNMP$ program has been designed to aid feedlots in implementing a nutrient management plan. This tool allows them to see the potential effects of changes before implementing them and promotes better utilization of valuable manure nutrients.
Authors
Andrea Watson, graduate student, University of Nebraska awatson3@unl.edu
Galen Erickson, professor, University of Nebraska
Terry Klopfenstein, professor, University of Nebraska
Rick Koelsch, assistant dean, extension and former professor, University of Nebraska
Ray Massey, professor, University of Missouri
Joseph Harrison, professor, Washington State University
Matt Luebbe, assistant professor, University of Nebraska
Funding provided by USDA NRCS CIG Program – Decision Aid Tool to Enhance Adoption of Feed Management 592 (FMPS 592) – Contract No. 69-3A75-10-121.
The authors are solely responsible for the content of these proceedings. The technical information does not necessarily reflect the official position of the sponsoring agencies or institutions represented by planning committee members, and inclusion and distribution herein does not constitute an endorsement of views expressed by the same. Printed materials included herein are not refereed publications. Citations should appear as follows. EXAMPLE: Authors. 2013. Title of presentation. Waste to Worth: Spreading Science and Solutions. Denver, CO. April 1-5, 2013. URL of this page. Accessed on: today’s date.
Why Should Small Farms Be Concerned About Manure Management?
The USDA defines a small farm as any operation with gross sales less than $250,000 per year. A small farm might have 50-100 dairy cows in the Midwest or Northeast, it could be a 30–ewe flock of pasture raised sheep, or a 100 head sow herd or 10 head of beef cows and calves on a retirement farm; or even a flock of laying hens in a residential area. This definition includes both commercial and hobby farms.
Many small farm owners do not realize the value of the manure produced on their farms. Manure is often disposed offsite or stored indefinitely on the farm, if manure is spread on farm a nutrient management plan may or may not be in place. Small farms have fewer animals and often several animal species on the same farm. There may be limited acreage and/or a lack of equipment for spreading manure. Financial resources may be lacking, but lower cost solutions for manure management may exist. Small farmers may not be aware of potential critical areas on the farm (sensitive water bodies, erosion, neighbor concerns, manure storage), and they may not understand the idea of nutrient balance.
The following principles may help small farmers who develop nutrient management programs:
Appropriate manure storage should be located at least 100 feet from water bodies, wetlands, etc.;
Animal access to water bodies, wetlands, etc. should be controlled;
Manure should be applied according to a nutrient management plan that balances nutrient content in the manure with crop nutrient requirements and uptake and optimizes beneficial use of nutrients from manure and bedding; and
The authors are solely responsible for the content of these proceedings. The technical information does not necessarily reflect the official position of the sponsoring agencies or institutions represented by planning committee members, and inclusion and distribution herein does not constitute an endorsement of views expressed by the same. Printed materials included herein are not refereed publications. Citations should appear as follows. EXAMPLE: Authors. 2013. Title of presentation. Waste to Worth: Spreading Science and Solutions. Denver, CO. April 1-5, 2013. URL of this page. Accessed on: today’s date.
Runoff of E. coli and other fecal indicator bacteria from grazing lands has been identified as a significant source of bacterial contamination in need of reductions to improve water quality. Improved management of creek pastures and implementation of on-farm best management practices to address these bacterial issues is critical to the success of watershed restoration efforts. To address this, the impacts of grazing management and providing alternative off-stream water in creek pastures were evaluated to assess their effectiveness for reducing E. coli loading.
Study results showed that there was no difference in runoff E. coli concentrations from ungrazed, properly grazed and heavily grazed pastures and no correlation between stocking rate and E. coli concentrations. It is suspected that the observed rapid decline in E. coli concentrations following rotation and significant contributions by wildlife resulted in this lack of correlation. However, rotational grazing, when timed appropriately, was found to be a very effective practice for reducing E. coli concentrations in runoff. As a result of these findings, it was recommended that, where feasible, creek pastures and other hydrologically connected pastures be grazed during periods when runoff is less likely and that upland sites be grazed during rainy seasons when runoff is more likely to occur.
The study also found that when alternative off-stream water was provided, cattle spent 43% less time in the creek. Despite this significant reduction in the amount of time cattle spent in the creek, the study was not able to document statistically significant E. coli loading reductions from providing alternative water. Nevertheless, providing off-stream water in creek pastures was highly recommended practice for improving water quality due to the reduction in the amount of time cattle spend in the creek documented by this study and the finding of other studies demonstrating reductions in sediment, nutrients and bacteria.
Authors
Kevin Wagner, Texas Water Resources Institute, Texas A&M University klwagner@ag.tamu.edu
Terry Gentry, Ph.D., Texas A&M University, Soil and Crop Sciences Department; Larry Redmon, Ph.D., Texas A&M University, Soil and Crop Sciences Department; R. Daren Harmel, Ph.D., USDA-ARS, Grassland Soil and Water Research Laboratory; Jamie Foster, Ph.D., Texas A&M University, Soil and Crop Sciences Department; Robert Knight, Ph.D., Texas A&M University, Ecosystem Science and Management Department; C. Allan Jones, Texas A&M University, Spatial Sciences Laboratory
The authors are solely responsible for the content of these proceedings. The technical information does not necessarily reflect the official position of the sponsoring agencies or institutions represented by planning committee members, and inclusion and distribution herein does not constitute an endorsement of views expressed by the same. Printed materials included herein are not refereed publications. Citations should appear as follows. EXAMPLE: Authors. 2013. Title of presentation. Waste to Worth: Spreading Science and Solutions. Denver, CO. April 1-5, 2013. URL of this page. Accessed on: today’s date.
Why Study Ammonia Recovery from Livestock Wastewater?
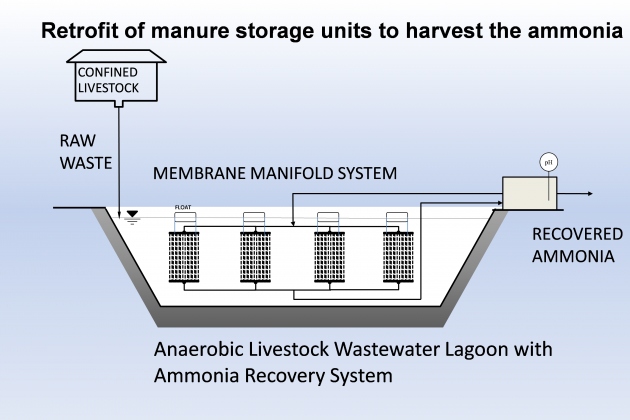
This presentation shows a novel system that uses gas-permeable membranes to capture and recover ammonia from liquid manure, reducing ammonia emissions from livestock operations, and recovering concentrated liquid nitrogen that could be sold as fertilizer.
What Did We Do?
These systems use gas-permeable membranes as components of new processes to capture and recover the ammonia in liquid manures. The new process includes the passage of gaseous ammonia contained in the liquid manure through a microporous hydrophobic membrane and capture and concentration with circulating diluted acid on the other side of the membrane. The membranes can be assembled in modules or manifolds. For liquid manure applications, the membrane manifolds are submerged in the liquid and the ammonia is removed from the liquid manure in barn pits or storage tanks and lagoons before it goes into the air.
Cross-sectional diagram of ammonia capture using hydrophobic gas-permeable membrane. Ammonia gas (NH3) in the liquid manure permeates through hydrophobic membrane walls with micron-sized pores, where it combines with the free protons (H+) in the acid solution to form non-volatile ammonium ions (NH4+).
What Have We Learned?
The concept was successfully tested using concentrated swine manure effluents containing 140 to 1,400 mg/L NH4-N. The use of gas-permeable membranes to remove ammonia from liquid manure was effective, and the rate of N recovery by the gas-permeable membrane system was higher with higher ammonia concentration in the manure. While ammonia gas passed readily through the membrane pores, the soluble COD compounds did not pass. An average removal rate from 45 to 153 milligrams of ammonia per liter per day was obtained when ammonia concentrations in swine lagoon liquid ranged from 138 to 302 milligrams ammonia per liter. The rate of ammonia recovery was also increased with increased pH of the wastewater. With a natural pH of 8.3, the rate of N recovery was about 1.2% per hour. This rate was increased 10 times (to 13% per hour) at pH of 10 after alkali addition. In another study, we immersed the membrane module into raw liquid manure that had 1,400 milligrams of ammonia per liter, and after 9 days, the total ammonia concentration decreased about 50 percent to 663 mg per liter. The gaseous ammonia in the liquid (or free ammonia) linked to ammonia emissions decreased 95 percent from 114.2 to 5.4 milligrams per liter. The same process was used in 10 consecutive batches of raw swine manure and ended up recovering concentrated nitrogen in a clear solution that contained 53,000 milligrams of ammonia per liter. The new technology could help change on-farm nitrogen management: Livestock producers could use the technology to help meet air-quality regulations, save fuel, protect the health of livestock and their human caretakers, improve livestock productivity, and recover concentrated liquid nitrogen that can be re-used in agriculture as a valued fertilizer.
Diagram of ammonia recovery system using with gas permeable membranes
Recovery and concentration of ammonia from liquid manure using gas-permeable membrane system. Diagram and pictures show prototype testing, using the same stripping solution with repeated batches of liquid manure.
Future Plans
On-farm demonstration studies will be conducted in 2013-2014 in cooperation with Dr. John Classen, North Carolina State University, through an NRCS Conservation Innovation Grant (CIG) awarded in FY2012 “Ammonia recovery from swine wastewater with selective membrane technology”. The project will demonstrate recovery of ammonia from liquid manure effluents using the gas-permeable technology in three different manure collection systems: under floor belt system, scraper system, and anaerobic digester.
Vanotti,M.B., Szogi,A.A. “Systems and Methods for Reducing Ammonia Emissions form Liquid Effluents and for Recovering Ammonia”. US Patent Appl. SN 13/164,363, filed June 20, 2011. US Patent and Trademark Office, Washington, DC.
Vanotti, M.B., Szogi, A.A. 2010. “Removal and recovery of ammonia from liquid manure using gas-permeable membranes”. In: Proceedings of the 2010 American Society of Agricultural and Biological Engineers Annual International Meeting, June 20-23, 2010, Pittsburgh, Pennsylvania. 5 p. Paper No. 1008376.
The authors are solely responsible for the content of these proceedings. The technical information does not necessarily reflect the official position of the sponsoring agencies or institutions represented by planning committee members, and inclusion and distribution herein does not constitute an endorsement of views expressed by the same. Printed materials included herein are not refereed publications. Citations should appear as follows. EXAMPLE: Authors. 2013. Title of presentation. Waste to Worth: Spreading Science and Solutions. Denver, CO. April 1-5, 2013. URL of this page. Accessed on: today’s date.
To meet Chesapeake Bay Total Maximum Daily Load requirements for agricultural pollution, conservation districts and farmers are tasked with implementing best management practices (BMPs) that reduce farm losses of nutrients and sediment. The importance of the agricultural industry to the regional economy highlights the need for determining cost-effective BMP solutions given the geographical and operational characteristics of these farms. This study evaluated both the environmental risk and farm profitability of common farm-level management practices for three major farm types in the region: crop, tractor-based (“English”) dairy, and horse-drawn (“Amish”) dairy.
Whole-farm simulations were conducted with the Integrated Farm System Model, a multi-year, process-based simulation model, to facilitate a broader understanding of the challenges for the farmers in finding financially feasible and environmentally sustainable solutions. Strip cropping, conservation tillage, cover cropping, and nutrient management BMPs generally reduced nutrient and sediments losses from all three farm types. However, scenarios that reduced phosphorus and sediment losses generally promoted more leaching of nitrogen. Double cropping corn with winter wheat combined with improved nutrient management was the most profitable practice for the crop farm, increasing average farm profitability by 92% over the baseline condition, while reducing combined nitrogen and total phosphorus losses by 13% and 23%, respectively.
Net profitability of the dairy farm was increased only by decreasing manure storage or using improved nutrient management. For the horse-drawn dairy, cover-cropping and harvest of rye silage combined with increased nutrient management provided the greatest increase in farm profit (+8%) and also reduced phosphorus and nitrogen losses.
Horse-drawn machinery through puts and increased human labor hours were required to simulate a typical Lancaster Old Order Amish dairy operation in Southeastern Pennsylvania.
Why Study Farms As a System?
Because southeastern Pennsylvania is a significant environmental contributor of the Chesapeake Bay, agricultural land management is under intense scrutiny by restoration groups. It is imperative to improving water quality that economically and culturally acceptable nonpoint source control practices be explored, developed, and evaluated. This is true for “contemporary” crop and dairy farms in the region as well as those that are more conservative in their use of electrical- or gas-powered farming equipment, described in this study as “Lancaster Old Order Amish”. Evaluation from a whole-farm perspective enables practical assessments of tradeoffs among management practice combinations and is particularly relevant when effectiveness relies on the willingness and dedication of the farm operators.
What Did We Do?
The expertise of regional conservationists and pooled results from farmer surveys were used to determine three major farm types in southeastern Pennsylvania and design potentially acceptable management combinations for each type. Three baseline farms were described: 400 ha corn-soy-wheat crop farm; 100 cow, 120 ha contemporary dairy; and 24 ha Lancaster Old Order Amish dairy. Whole-farm impacts were assessed with the Integrated Farm System Model (IFSM), a multi-year, process-based simulation model. Environmental tradeoffs between nitrogen, phosphorus, and sediment losses were evaluated and financial cost-benefits through change in annual net return for the farmer were analyzed.
What Have We Learned?
Strip cropping, conservation tillage, cover cropping, and improved nutrient management generally reduced nutrient and sediment losses from all three farm types. However, scenarios that reduced phosphorus and sediment runoff losses generally increased nitrogen leaching to groundwater. Double cropping corn and winter wheat under improved nutrient management was the most profitable combination for the crop farm, increasing average farm profitability by 92% over the baseline while reducing combined nitrogen and total phosphorus losses by 13% and 23%, respectively. Net profitability of the contemporary dairy farm was increased only by decreasing manure storage or using improved nutrient management. For the Lancaster Old Order Amish dairy, cover-cropping and harvest of rye silage combined with increased nutrient management provided the greatest increase in farm profit (+8%) and also reduced phosphorus and nitrogen losses.
Future Plans
Cost-effective recommendations from a whole farm perspective that account for unique characteristics of particular farm types can aid officials in determining locally agreeable methods for efficiently addressing regional priority pollutants. As farms adopt and implement suggested management changes, additional management practices of interest can be evaluated. Also, IFSM is being expanded to consider air emissions and carbon sequestration effects of the management practices.
McLean, A. D., 2012. Modeling best management practices on representative farms in Southeastern Pennsylvania. Master’s thesis, PA State University, University Park, PA. https://etda.libraries.psu.edu/paper/14093/, available Dec. 05, 2012.
Acknowledgements
This work contributes to the Conservation Effects Assessment Project (CEAP), jointly funded, coordinated, and administered by United States Department of Agriculture’s Natural Resources Conservation Service, Agricultural Research Service, and National Institute for Food and Agriculture. We would like to thank Mike Hubler and Larry Baum from Dauphin County Conservation District and officials at Lancaster and Lebanon County Conservation Districts for their advice and guidance categorizing and characterizing farms of Dauphin County and southeastern Pennsylvania. Thanks also to Kristen Saacke-Blunk and Matt Royer from Conewago Creek Collaborative Conservation Initiative for their time and input. Mention of trade names or commercial products in this publication is solely for the purpose of providing specific information and does not imply recommendation or endorsement by the U.S. Department of Agriculture. USDA is an equal opportunity provider and employer.
The authors are solely responsible for the content of these proceedings. The technical information does not necessarily reflect the official position of the sponsoring agencies or institutions represented by planning committee members, and inclusion and distribution herein does not constitute an endorsement of views expressed by the same. Printed materials included herein are not refereed publications. Citations should appear as follows. EXAMPLE: Authors. 2013. Title of presentation. Waste to Worth: Spreading Science and Solutions. Denver, CO. April 1-5, 2013. URL of this page. Accessed on: today’s date.
Agriculture is the largest user of ground water in the United States. Ground water at dairies is used for cow drinking, milking parlor clean-up and crop irrigation. Ground water is produced from wells that often are improperly designed and completed. Inefficient well design, including improperly sized pumps, results in increased pumping costs and increases the frequency that wells and/or pumps have to be replaced. Inefficient wells require significantly more energy to pump lesser amounts of water than properly designed wells. Sand production from unconsolidated or poorly-consolidated aquifers reduces the effective life of the well and pump. Sand production is significantly reduced by properly sizing the well screen and filter pack. Pilot holes are drilled so grain size analyses can be conducted and well screen and filter pack can be properly sized. Geophysical logs may be utilized to identify zones of maximum potential production. The pilot holes are reamed out to the design diameter and the well is constructed with an optimal screen and filter pack combination. Efficient wells are designed with maximum open-area and proper filter packs, so well screens are not dewatered and the well does not pump sand or air. Production tests on the completed well allow the pump motor and bowls to be sized and set to a depth that will maximize pump efficiency and water production while minimizing power costs. An efficient, sand-free well will save a farmer significant money on energy costs to produce water, and the well and pump lifetime will be extended significantly. Water wells should be designed carefully to maximize well and pump efficiency in order to conserve energy and not produce sand.
Purpose
To provide technical guidance on design development and completion of energy efficient wells to extend the operating life of wells and pumps.
What Did We Do?
We improved well efficiencies and reduced energy costs for pumping ground water.
What Have We Learned?
To continue drilling, designing, developing and completing wells using techniques we have developed over the last 33 years.
Future Plans
Continue to develop innovative methods for drilling wells.
The authors are solely responsible for the content of these proceedings. The technical information does not necessarily reflect the official position of the sponsoring agencies or institutions represented by planning committee members, and inclusion and distribution herein does not constitute an endorsement of views expressed by the same. Printed materials included herein are not refereed publications. Citations should appear as follows. EXAMPLE: Authors. 2013. Title of presentation. Waste to Worth: Spreading Science and Solutions. Denver, CO. April 1-5, 2013. URL of this page. Accessed on: today’s date.
Why Study Ammonia Removal from Livestock Wastewater?
Biological nitrogen removal is regarded as the most efficient and economically feasible method available for removal of ammonia from wastewater. Its implementation in concentrated livestock farms can help reduce surplus nitrogen and ammonia emissions.
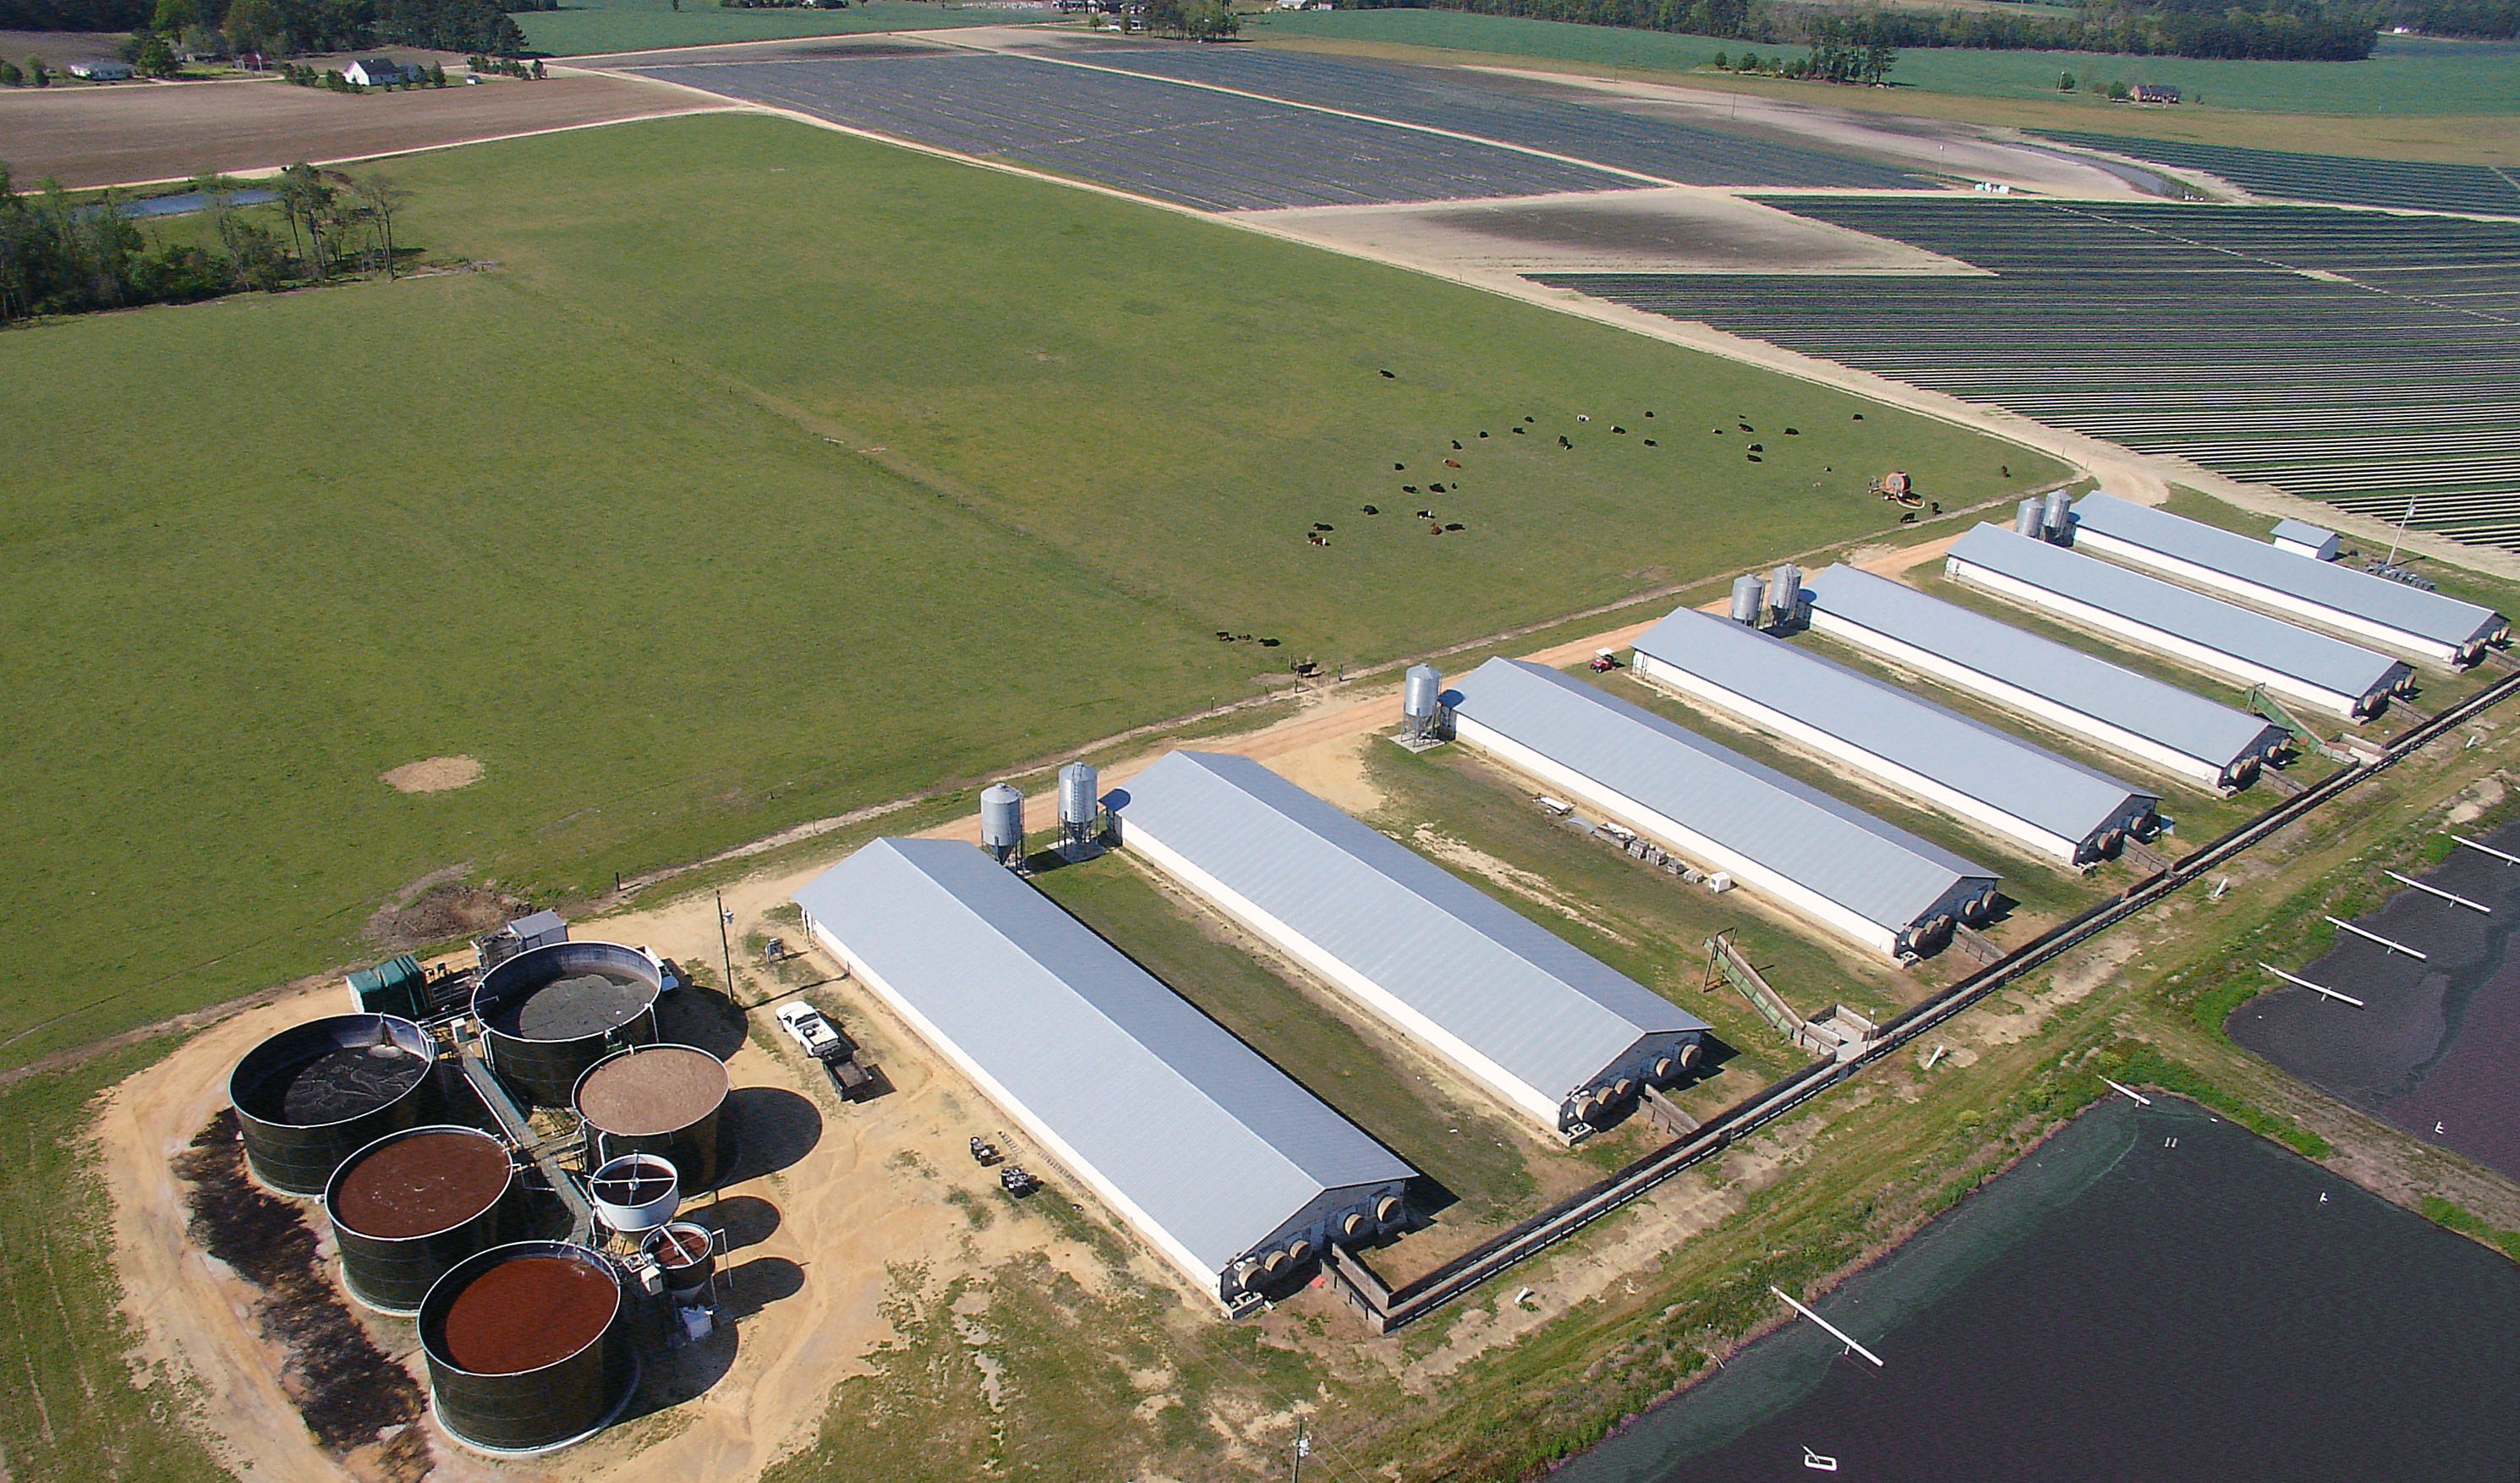
High performance nitrifying sludge (HPNS) is used to start-up biological ammonia removal treatment in swine manure treatment plants. Picture shows second generation project treating manure from 5,200-head finishing operation in Sampson County, NC. The system used solids separation, N removal and P removal processes.
What Did We Do?
The effective use of biological nitrogen removal treatment in animal wastewater required development of new technologies and systems adapted to the higher-strength characteristics of liquid manure. These include: 1) development of a high performance nitrification bacterial mix; 2) systems that combine nitrification/denitrification with efficient liquid-solids separation; and 3) a new deammonification process using anammox bacteria for the removal of nitrogen in anaerobic digestion effluents.
What Have We Learned?
The discovery of a high-performing nitrifying bacterial sludge (HPNS) adapted to high ammonia concentrations (> 3,000 mg N/L) and low water temperatures (5 oC) significantly reduced biological nitrogen removal (BNR) plant footprint and costs. Nitrification/denitrification of fresh flushed manure was most effective after solid-liquid separation treatment, using a pre-denitrification configuration (Modified Ludzack-Ettinger or MLE process). The system is currently at its third generation. The third generation was demonstrated full-scale in 2012 in a farrow to finish swine operation that produced 30,500 hogs per year. It eliminated 99% of the ammonia contained in the manure effluent.
After nitrification/denitrification treatment, the manure effluent contains low ammonia concentration (< 10 mg/L). It is stored in a clean water tank and reused in the barns for recharging the pits or filling flush-tanks. Picture shows clean water tank in third generation project in Wayne county, NC, treating manure from both a 1,200-sow farrow to feeder operation and 12,960 feeder to finish farm.
However, the implementation of nitrification/denitrification process in anaerobic digestion systems is a problem, since both the biogas production and denitrification require carbon. It would require about 30% less biogas production so that there is sufficient carbon for N removal through nitrification/denitrification. The discovery of a novel anammox bacteria in manure, Brocadia caroliniensis, is helping us address this problem effectively, especially after recent advances with a single-tank configuration. The new deammonification process we present here (partial nitritation and anammox) is a completely autotrophic nitrogen removal approach that eliminates the carbon needs for denitrification. Thus, it can be a promising approach for the biological removal of ammonia from anaerobic digester effluents that are low in carbon and high in ammonia concentration. We obtained rapid deammonification reaction by mixing nitrifying and anammox sludges in a single, aerated tank. The single-tank approach was tested with digested swine wastewater. Compared with traditional N removal, the deammonification process reduced 57% of the aeration and 100% of the carbon requirement. Therefore, deammonification is a key technology for development of more economical and energy efficient biological ammonia removal systems in the near future.
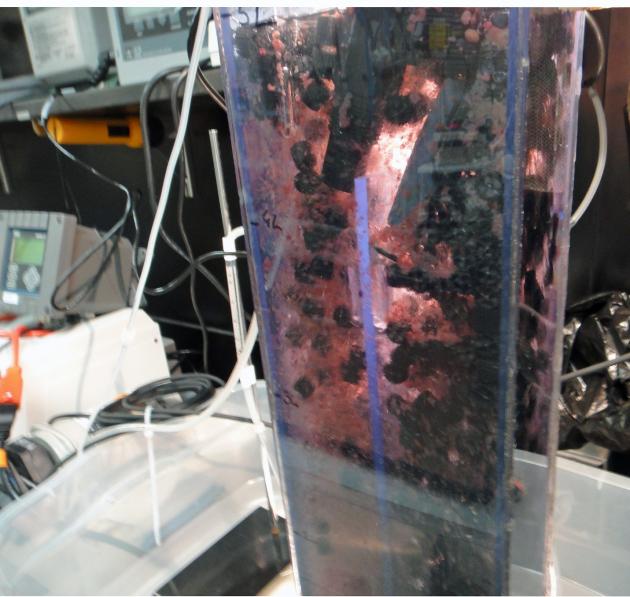
Deammonification treatment using single-tank approach. It performs partial nitritation and anammox reaction in fluidized continuous flow reactor. Picture shows detail of single tank at USDA-ARS, Florence, SC. It used a mixture of HPNS and anammox bacteria Brocadia caroliniensis and biofilms plastic carriers to remove the ammonia from anaerobic digester effluents.
Future Plans
The nitrification/denitrification technology has been demonstrated full-scale and is at the commercialization phase. The single-tank deammonification has been pilot tested.
USDA has filed US patents for “high performance nitrifying sludge ” and “novel anammox bacterium isolate” (see reference list), and seeks commercial partners to bring deammonification technology to market. http://www.ars.usda.gov/business/docs.htm?docid=763&page=5
Vanotti, M.B., Szogi, A.A., Millner, P.D. and Loughrin, J.H. 2009b. Development of a second-generation environmentally superior technology for treatment of swine manure in the USA. Biores. Technol. 100(22):5406-5416.
Vanotti, M.B., A.A. Szogi, and T.F. Ducey. 2011. High performance nitrifying sludge for high ammonium concentration and low temperature wastewater treatment. US Patent Publication No. US2011/0000851 A1. US Patent and Trademark Office, Washington, DC.
Matias Vanotti, José Martinez, Takao Fujii, Ariel Szögi, Daisuke Hira. 2012. Ammonia Removal Using Nitrification and Anammox in a Single Reactor. In Proceedings 2012 ASABE Annual International Meeting, Dallas, Texas. July 29 – August 1, 2012. Paper No. 121337837.
Vanotti, M.B., A.A. Szogi, and M.J. Rothrock. 2011. Novel anammox bacterium isolate. US Patent Application No. 13/013,874. US Patent and Trademark Office, Washington, DC.
Acknowledgements
This research was part of USDA-ARS National Program 214 Agricultural and Industrial Byproducts, Research Project 6657-13630-005-00D “Innovative Bioresource Management Technologies for Enhanced Environmental Quality and Value optimization”.
The authors are solely responsible for the content of these proceedings. The technical information does not necessarily reflect the official position of the sponsoring agencies or institutions represented by planning committee members, and inclusion and distribution herein does not constitute an endorsement of views expressed by the same. Printed materials included herein are not refereed publications. Citations should appear as follows. EXAMPLE: Authors. 2013. Title of presentation. Waste to Worth: Spreading Science and Solutions. Denver, CO. April 1-5, 2013. URL of this page. Accessed on: today’s date.
Livestock GRACEnet is a United States Department of Agriculture, Agricultural Research Service working group focused on atmospheric emissions from livestock production in the USA. The working group presently has 24 scientists from 13 locations covering the major animal production systems in the USA (dairy, beef, swine, and poultry). The mission of Livestock GRACEnet is to lead the development of management practices that reduce greenhouse gas, ammonia, and other emissions and provide a sound scientific basis for accurate measurement and modeling of emissions from livestock agriculture. The working group fosters collaboration among fellow scientists and stakeholders to identify and develop appropriate management practices; supports the needs of policy makers and regulators for consistent, accurate data and information; fosters scientific transparency and rigor and transfers new knowledge efficiently to stakeholders and the scientific community. Success in the group’s mission will help ensure the economic viability of the livestock industry, improve vitality and quality of life in rural areas, and provide beneficial environmental services. Some of the research highlights of the group are provided as examples of current work within Livestock GRACEnet. These include efforts aimed at improving emissions inventories, developing mitigation strategies, improving process-based models for estimating emissions, and producing fact sheets to inform producers about successful management practices that can be put to use now.
Why Was GRACEnet Created?
The mission of Livestock GRACEnet is to lead the development of livestock management practices to reduce greenhouse gas, ammonia, and other emissions and to provide a sound scientific basis for accurate measurement and modeling of emissions.
What Did We Do?
The Livestock GRACEnet group is comprised of 24 scientists from 13 USDA-ARS locations researching the effects of livestock production on emissions and air quality.
Our goals are to:
Collaborate with fellow scientists and stakeholders to identify and develop appropriate management practices
Support the needs of policy makers and regulators for consistent, accurate data and information
Foster scientific transparency and rigor
Transfer new knowledge efficiently to stakeholders and the scientific community
Success in our mission will help to ensure the economic viability of the livestock industry, vitality and quality of life in rural areas, and provide environmental services benefits.
The authors are solely responsible for the content of these proceedings. The technical information does not necessarily reflect the official position of the sponsoring agencies or institutions represented by planning committee members, and inclusion and distribution herein does not constitute an endorsement of views expressed by the same. Printed materials included herein are not refereed publications. Citations should appear as follows. EXAMPLE: Authors. 2013. Title of presentation. Waste to Worth: Spreading Science and Solutions. Denver, CO. April 1-5, 2013. URL of this page. Accessed on: today’s date.
Currently, all the Bay states are working to achieve nutrient reduction goals from various pollution sources. Significant reductions in phosphorus pollution from agriculture, particularly with respect to phosphorus losses from land application of manure are needed to support a healthy aquatic ecosystem. Producers in high-density animal agricultural production areas such as Lancaster County region of Pennsylvania, the Delmarva Peninsula, and the Shenandoah Valley region of Virginia, need viable alternatives to local land application in order to meet nutrient reduction goals.
Field demonstrations will be monitored to determine whether the technologies are environmental beneficial, and economically and technically feasible. Specific measures of performance include: reliability and heat distribution, in-house air quality, avoided propane or electricity use, costs to install and maintain, fertilizer and economic value of ash or biochar produced, air emissions, and fate of poultry litter nutrients. Technology evaluation results will be shared on a clearinghouse website developed in partnership with eXtension.
The Farm Manure to Energy Initiative is also supporting efforts to develop markets for nutrient rich ash and biochar co-products. Field trials using nutrient rich ash and biochar from poultry litter thermochemical processes for fresh market vegetable production are currently underway at Virginia Tech’s Eastern Shore Agricultural Research and Experiment Station.
Purpose
The Farm Manure to Energy Initiative is a collaborative effort to evaluate the technical, environmental, and economic feasibility of farm-scale manure to energy technologies in an effort to expand management and revenue-generating opportunities for excess manure nutrients in concentrated animal production regions of the Chesapeake Bay watershed.
What Did We Do?
The project team went through a comprehensive review process and identified three farm-scale, manure to energy technologies that we think have the potential to generate new revenue streams and provide alternatives to local land application of excess manure nutrients. Installation and performance evaluation of two of these technologies on four host farms in the Chesapeake Bay region are underway. Partners have also completed a survey of financing options for farm-scale technology deployment and published a comprehensive financing resources guide for farmers in the Chesapeake Bay region.
What Have We Learned?
To date, we have not identified any manure to energy technologies that also provide alternatives to local land application of excess manure nutrients for liquid manures. Thermochemical manure to energy technologies using poultry litter as a fuel source seem to show the most promise for offering opportunities to export excess nutrients from phosphorus hotspots in the Chesapeake Bay region. Producing heat for poultry houses is the most readily available energy capture option. We did not identify any vendors with a proven approach to producing electricity via farm-scale, thermochemical manure to energy technologies. With respect to the fate of poultry litter nutrients, preliminary air emissions data indicates that most poultry litter nitrogen (greater than 98%) is converted to non-reactive nitrogen in the thermochemical process. Phosphorus and potash are preserved in the ash or biochar coproducts. Preliminary field trial results indicate that phosphorus in ash and biochar is bioavailable and can be used as a replacement for commercial phosphorus fertilizer, but bioavailability varied according to the thermochemical process.
Future Plans
We are currenty in the process of installing and measuring the performance of farm-scale demonstrations in the Chesapeake Bay region. We are collaborating with the Livestock and Poultry Environmental Learning Center to develop a clearinghouse website for thermochemical farm-scale manure to energy technologies that will be hosted on the eXtension website. Performance data from our projects will be shared on this website, which can also be used as a platform to share information about the performance of other farm-scale, thermochemical technology installations around the U.S. Technical training events using farm demonstrations as an educational platform will be hosted during the later half of the project. Additional field and row crop trials to demonstrate the fertilizer value of the concentrated nutrient coproducts are also planned using ash from farm demonstrations.
Authors
Jane Corson-Lassiter, USDA NRCS, Jane.Lassiter@va.usda.gov; Kristen Hughes Evans, Executive Director, Sustainable Chesapeake
Additional partners in the Farm Manure to Energy Initiative include: Farm Pilot Project Coordination, Inc., University of Maryland Center for Environmental Studies, University of Maryland Environmental Finance Center, Virginia Cooperative Extension, Lancaster County Conservation District, the Virginia Tech Eastern Shore Agricultural Research and Extension Center, National Fish and Wildlife Foundation, Chesapeake Bay Funders Network, Chesapeake Bay Commission, and International Biochar Institute.
Funding for this project is provided by a grant from the USDA Conservation Innovation Grant program, the National Fish and Wildlife Foundation via the U.S. EPA Innovative Nutrient and Sediment Reduction Program, the Chesapeake Bay Funders Network, as well as technology vendors and host farmers participating in the technology demonstrations.
The authors are solely responsible for the content of these proceedings. The technical information does not necessarily reflect the official position of the sponsoring agencies or institutions represented by planning committee members, and inclusion and distribution herein does not constitute an endorsement of views expressed by the same. Printed materials included herein are not refereed publications. Citations should appear as follows. EXAMPLE: Authors. 2013. Title of presentation. Waste to Worth: Spreading Science and Solutions. Denver, CO. April 1-5, 2013. URL of this page. Accessed on: today’s date.
We conducted a field study on corn to evaluate the effect of liquid dairy manure applied pre-plant (injection or surface broadcast with immediate or 3-day disk incorporation) or sidedressed at 6-leaf stage (injected or surface-applied) on emission of NH3 and N2O. Manure was applied at a rate of 6500 gal/acre, which supplied an average of 150 lb/acre of total N and 65 lb/acre of NH4-N. Ammonia emission was measured for 3 days after manure application using the dynamic chamber/equilibrium concentration technique, and N2O flux was quantified using the static chamber method at intervals of 3 to 14 days throughout the season. Ammonia-N losses were typically 30 to 50 lb/acre from pre-plant surface application, most of the loss occurring in the first 6 to 12 hours after application. Emission rates were reduced 60-80% by quick incorporation and over 90% by injection. Losses of N2O were relatively low (1 lb/acre or less annually), but pronounced peaks of N2O flux occurred from either pre-plant or sidedress injected manure in different years. Results show that NH3 emission from manure can be reduced substantially by injection or quick incorporation, but there may be some tradeoff with N2O flux from injection.
Why Study Land Application Emissions of Ammonia and Nitrous Oxide?
Figure 1. Injection equipment used for pre-plant application (top) and sidedress application (bottom) of liquid dairy manure.
Manure is a valuable source of nitrogen (N) for crop production, but gaseous losses of manure N as ammonia (NH3) and nitrous oxide (N2O) reduce the amount of N available to the crop and, therefore, its economic value as fertilizer. These N losses can also adversely affect air quality, contribute to eutrophication of surface waters via atmospheric deposition, and increase greenhouse gas emission. And the decreased available N in manure reduces the N:P ratio and can lead to a more rapid build-up of P in the soil for a given amount of available N. The most common approach to controlling NH3 volatilization from manure is to incorporate it into the soil with tillage or subsurface injection, which can reduce losses by 50 to over 90% compared to surface application (Jokela and Meisinger, 2008). Injecting into a growing corn crop at sidedress time offers another window of time for manure application (Ball-Coelho et al., 2006). While amounts of N lost as N2O are usually small compared to NH3, even low emissions can contribute to the greenhouse effect because N2O is about 300 times as potent as carbon dioxide in its effect on global warming (USEPA, 2010). We carried out a 4-year field experiment to evaluate the effect of dairy manure application method and timing and time of incorporation on a) corn yield, b) fertilizer N credits, c) ammonia losses, and) nitrous oxide emissions.
What Did We Do?
Figure 2. Average (2009-2011) NH3-N emission rates as affected by method and timing of manure application.
This field research was conducted at the Univ. of Wisconsin/USDA Agricultural Research Station in Marshfield, WI, on predominantly Withee silt loam (Aquic glossudalf), a somewhat poorly drained soil with 0 to 2% slope. Dairy manure was applied either at pre-plant (mid- to late May) or sidedress time (5-6-leaf stage). Pre-plant treatments were either injected with an S-tine injector (15-inch spacing; Fig. 1) or incorporated with a tandem disk immediately after manure application (< 1 hour), 1-day later, or 3 days later. All plots were chisel plowed 3 to 5 days after application. Sidedress manure applications were either injected with an S-tine injector (30-inch spacing) or surface applied (Fig. 1). Fertilizer N was applied to separate plots at pre-plant at rates of 0, 40, 80, 120, 160, and 200 lb/acre as urea and incorporated with a disk. Liquid dairy manure (average 14% solids) was applied at a target rate of 6,500 gal/acre. Manure supplied an average of 158 lb total N and 62 lb NH4-N per acre, but rates varied across years and application times.
Ammonia emission was measured following pre-plant and sidedress manure applications in 2009-2011 with the dynamic chamber/equilibrium concentration technique (Svensson, 1994). Measurement started immediately after manure application and continued through the third day. Ammonia measurement ended just before disking of the 3-day incorporation treatment, so the 3-day treatment represents surface-applied manure. Nitrous oxide was measured using the static, vented chamber technique following the GRACEnet protocol (Parkin and Venterea, 2010). Measurement began two days after pre-plant manure application and continued approximately weekly into October.
What Have We Learned?
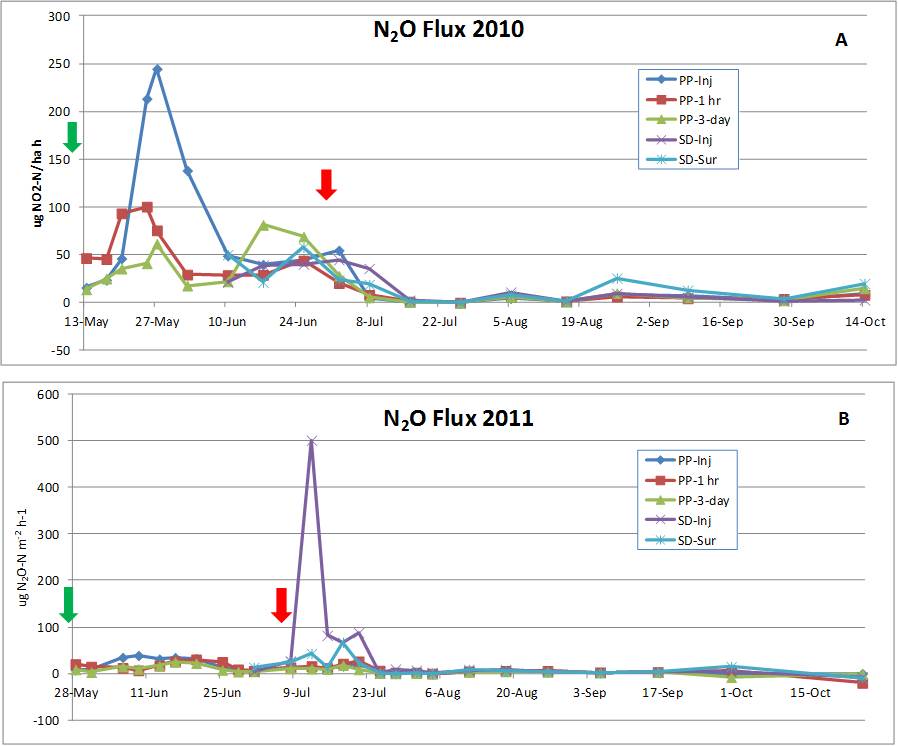
Figure 3. Nitrous oxide (N2O) flux as affected by method and timing of dairy manure application from May to October of 2010 (A) and 2011 (B). Arrows show times of manure application. Note differences in scale for 2010 and 2011.
The 3-year average annual NH3 emission rate from surface applied (3-day incorporation) manure was relatively high immediately following application but declined rapidly after the first several hours to quite low levels (Fig. 2). Cumulative NH3-N loss over the full measurement period averaged over 40 lb/acre from surface application but was reduced by 75% with immediate disking and over 90% by injection. Ammonia losses varied somewhat by year, but patterns over time and reductions by incorporation were similar. The pattern of ammonia loss, 75% of the total loss in the first 6 to 12 hours, emphasizes the importance of prompt incorporation to reduce losses and conserve N for crop use.
Nitrous oxide flux was quite low for most manure treatments during most of the May to October period in both years (Fig. 3). However, there were some increases in N2O flux after manure application, and pronounced peaks of N2O emission from the injection treatment at either pre-plant (2010) or sidedress (2011) time. Greater emission from injection compared to other treatments may have occurred because injection of liquid manure places manure in a relatively concentrated band below the surface, creating anaerobic (lacking in oxygen) conditions. Nitrous oxide is produced by denitrification, a microbial process that is facilitated by anaerobic conditions. Reasons for the difference between 2010 and 2011 are not readily obvious, but are probably a result of different soil moisture and temperature conditions.
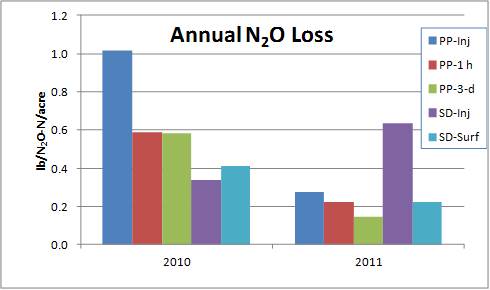
Figure 4. Annual (May-Oct.) loss of N2O as affected by method and timing of liquid dairy manure application. 2010 and 2011.
Based on these results, injection of liquid dairy manure resulted in opposite effects on NH3 and N2O emission, suggesting a trade-off between the two gaseous N loss pathways. However, the total annual N losses from N2O emissions (1 lb/acre or less; Fig. 4) were only a fraction of those from ammonia volatilization, so under the conditions of this study N2O emission is not an economically important loss. As noted earlier, however, N2O is a potent greenhouse gas, so even small amounts can contribute to the potential for global climate change. The dramatic reduction in NH3 loss from injection, though, may at least partially balance out the increased N2O because 1% of volatilized N is assumed to be converted to N2O (IPCC, 2010). Immediate disk incorporation was almost as effective as injection for controlling NH3 loss and, on average, resulted in less N2O emission than injection. But the separate field operation must be done promptly after manure application to be effective. A possible alternative is to use sweep injectors or other direct incorporation methods that place manure over a larger volume of soil and/or create more mixing with soil, thus creating conditions less conducive to denitrification and N2O loss.
Manure application timing and method/time to incorporation significantly affected grain yield in 2009, 2010, and 2012 and silage yield in 2012. Pre-plant injection produced greater yields than one or more of the broadcast treatments in 2009 (grain) and 2012 (grain and silage). Overall, yield effects of application and incorporation timing were variable from year to year, probably because of differences in weather and soil conditions and actual manure N rates applied. The fertilizer N equivalence of manure was calculated by comparing the yield achieved from each manure treatment to the yield response function from fertilizer N. Fertilizer N equivalence values were quite variable by year, but 4-year averages expressed as percent of total manure N applied were 52% for injection (pre-plant and sidedress), 37% for 1-hour or 1-day incorporation, and 34% for 3-day incorporation. So, when expressed as a percent of total manure N applied, N availability generally decreased as time to incorporation increased, which reflects the amounts of measured NH3 loss.
In summary, ammonia volatilization losses increased as the time to incorporation of manure increased. Injection of manure resulted in the lowest amount of NH3 volatilization, but higher N2O emissions. In this study, reducing the large NH3 losses by injecting manure provided more environmental benefit compared to the small increase in N2O emissions. In addition, injection or immediate incorporation resulted, on average, in higher fertilizer N value of manure for corn production. The decreased need for commercial fertilizer N could potentially result in greater profitability and a smaller carbon footprint.
Future Plans
We have started other research to evaluate yield response, N cycling, and emission of NH3 and N2O from various low-disturbance manure application methods in silage corn and perennial forage systems.
Authors
Bill Jokela, Research Soil Scientist, USDA-ARS, Dairy Forage Reserch Center, Marshfield, WI, bill.jokela@ars.usda.gov
Carrie Laboski, Assoc. Professor, Dept. of Soil Science, Univ. of Wisconsin
Todd Andraski, Researcher, Dept. of Soil Science, Univ. of Wisconsin
Additional Information
Ball Coelho, B.R., R.C. Roy, and A.J. Bruin. 2006. Nitrogen recovery and partitioning with different rates and methods of sidedressed manure. Soil Sci. Soc. Am. J. 70:464–473.
Intergovernmental Panel on Climate Change (IPCC). 2006 IPCC Guidelines for National Greenhouse Gas Inventories, vol. 4, Agriculture, Forestry and Other Land Use, edited by S. Eggleston et al., Inst. for Global Environ. Strategies, Hayama, Japan.
The authors gratefully acknowledge Matt Volenec and Ashley Braun for excellent technical assistance in conducting this research. Funding was provided, in part, by the USDA-Agricultural Research Service and the Wisconsin Corn Promotion Board.
The authors are solely responsible for the content of these proceedings. The technical information does not necessarily reflect the official position of the sponsoring agencies or institutions represented by planning committee members, and inclusion and distribution herein does not constitute an endorsement of views expressed by the same. Printed materials included herein are not refereed publications. Citations should appear as follows. EXAMPLE: Authors. 2013. Title of presentation. Waste to Worth: Spreading Science and Solutions. Denver, CO. April 1-5, 2013. URL of this page. Accessed on: today’s date.
To provide the best experiences, we use technologies like cookies to store and/or access device information. Consenting to these technologies will allow us to process data such as browsing behavior or unique IDs on this site. Not consenting or withdrawing consent, may adversely affect certain features and functions.
Functional
Always active
The technical storage or access is strictly necessary for the legitimate purpose of enabling the use of a specific service explicitly requested by the subscriber or user, or for the sole purpose of carrying out the transmission of a communication over an electronic communications network.
Preferences
The technical storage or access is necessary for the legitimate purpose of storing preferences that are not requested by the subscriber or user.
Statistics
The technical storage or access that is used exclusively for statistical purposes.The technical storage or access that is used exclusively for anonymous statistical purposes. Without a subpoena, voluntary compliance on the part of your Internet Service Provider, or additional records from a third party, information stored or retrieved for this purpose alone cannot usually be used to identify you.
Marketing
The technical storage or access is required to create user profiles to send advertising, or to track the user on a website or across several websites for similar marketing purposes.