Calibrating Liquid Manure Application Equipment

Types of Liquid Manure Application Equipment

Liquid manure application equipment includes tankers (sometimes called honey-wagons) and hose-drag (also referred to as drag-hose) systems. Depending upon the type of liquid application system being calibrated, calibration may require weighing the tanker, recording the time to empty a load, measuring application spread width and length and/or recording equipment speed. Also, with some calibration methods, determination of manure density is required.

Related: Calibrating solid manure spreaders and irrigation equipment.

Important Factors For Making Calibration Calculations

Normally calibration requirements are specific to the equipment, i.e. one piece of equipment needs only to be calibrated once during the calibration interval, often annually. However, it is a good idea to calibrate equipment that may be used under different conditions. For instance, adding more hose to a hose-drag system when moving from one field to the next can increase friction loss and alter manure flow rates though the applicator. It may also be valuable to calibrate for multiple travel speeds, each representing a different application rate. This allows one to select an application rate that most closely matches the nutrient requirements of individual fields or crops.

It is important to select the calibration procedure that is consistent with your manure analysis. For instance some analysis reports nutrients in a weight per volume measure (e.g. pounds per thousand gallons) while some analysis is provided on a weight per weight basis (e.g. pounds per ton). Calibration of liquid tanker spreaders can be done by weighing a load or knowing the capacity (volume) of the spreader as specified by the manufacturer. Conversion between volume and weight may be done by determining the manure density.

By knowing the spreader capacity, distance traveled to empty the spreader, and width of spread pattern (or distance you move laterally with each pass through the field), a fairly simple estimate of application rate can be made. This should be repeated several times to determine an average application rate each manure source. The speed of the tractor can be varied to adjust the application rate to achieve the planned application rate(s). The general procedure for calibrating a liquid manure tanker spreader is illustrated in the following file Liquid Spreader Calibration.

Hose drag type systems are calibrated by measuring tractor speed, flow rate of the manure through the system and effective width (distance between passes). These factors allow conversion to volume of manure over area applied, e.g. gallons per acre.

Calibration of hose-drag (drag-hose) equipment requires measurement of (a.) tractor speed, (b.) spread width (We in illustration) and (c.) flow through the hose. Photo: Garry Grabow, All Rights Reserved.

Recommended Educational Resources

Author: Garry Grabow, North Carolina State University Reviewers: Marsha Mathews, University of California-Davis, Rick Koelsch, University of Nebraska, Doug Beegle, Pennsylvania State University

Manure Production and Characteristics

Manure is an inevitable byproduct of livestock and poultry production. Manure is a valuable material that can be used as a source of organic matter and fertilizer for crop and pasture production. Manure can also be used as source of energy on the farm through anaerobic digestion to produce biomethane or thermochemical process (such as pyrolysis, gasification, or combustion) to produce heat or electricity. Some of the by-products of energy production can be further processed to produce value added chemicals.

Quantity of Manure Produced

Typically, manure includes excreted material from the animal (feces and urine), used bedding, as well as wasted feed, water (drinking and wash), hair, and soil. The quantity of manure produced depend on several factors including:

  • animal type (ruminant or non-ruminant),
  • diet (forage-based or grain-based),
  • animal age (which can influence the amount of feed consumed),
  • animal environment,
  • and animal productivity as well as other factors.

Composition of Manure

The chemical characteristics of manure primarily depend upon the chemical composition of the feed given to the animal. The animal metabolizes the feed to provide itself with energy and produce new body tissues and products. The waste products of metabolism are largely collected in urine and passed out with the feces (which may contain unused feed).

Nutrient requirements by animals vary with animal type and stage of production. Usually, when the animal’s protein requirements decrease, the concentration of protein in the diet can also be decreased, thereby decreasing the concentrations of nitrogen excreted as a percent of body weight. Similarly, increased levels of minerals fed (e.g. copper, phosphorus, sodium, potassium) increase the level of those nutrients in the manure. It is recommended that manure analysis be done regularly especially if diet formulation and major changes in management of the livestock occurs.

Determining Manure Production and Composition

Manure quantities and characteristics can be estimated on an:

  1. as-excreted basis or as
  2. recoverable manure nutrients (the quantity of manure nutrients available for land application or utilization for other purposes).

The nutrient content of manure is influenced by feed intake (which influences the nutrients excreted), manure storage and management choices (which influences the recovery of nutrients), and water additions/evaporation (which influences the concentration of nutrients).

As-Excreted Basis

There are tabulated values that can be used to estimate the amount of manure an animal produces. The American Society of Agricultural and Biological Engineers (ASABE) has prepared a standard (D384.2) that lists the average quantities of manure and their characteristics. Excreted values are provided in Table 1 and Table 2. These average estimates of manure excreted become obsolete due to changes in animal genetics, feeding program strategies, and available feeds. Table 1 and 2 are representative of typical characteristics in 2002.

Although sampling and the use of tabulated estimates are the most common methods of estimating manure nutrients, ASABE D384.2 provide equations for predicting nutrient excretion (primarily nitrogen and phosphorus), dry matter, and (depending upon species) other potential characteristics have been assembled for beef, dairy, swine, horses, and poultry. Software (listed at the bottom of this page) can simplify the use of these equations.

If you want to calculate quantity of manure produced by your animals based on these equations, here are some guidelines to use to decide when it is appropriate to use the equations to calculate manure excretions:

  • When you want to develop a comprehensive nutrient management plans specific to your animal feeding operation (AFO).
  • When you have farm-specific data for your feeding program and animal performance.
  • When feed intake, feed nutrient concentration, feed digestibility, or animal performance varies from the assumptions used to estimate the typical values in Table 1 and Table 2.
  • When industry trends have changed from the assumptions used in Table 1.

Otherwise, use the typical values found in Table 1 and Table 2 for the following situations:

  • When planning estimates are being made on a scale larger than a single farm (e.g. county or regional estimate of nutrient excretion).
  • When a rough approximation is needed for farm planning.
  • When farm-specific information of animal performance and feed intake is not available.

Caution: When using the typical as-excreted manure production and characteristics presented in Table 1 and Table 2, the user should recognize that the reported typical values may become obsolete with time due to changes in animal genetics, feeding programs, alternative feeding technologies, and available feeds. In addition, users should also recognize that under current conditions, excretion of nutrients and other related characteristics will vary for individual situations from the currently listed values due to variations in animal feed nutrient intake, animal performance, and individual farm management.

Bedding

Bedding is sometimes included in the manure. To estimate the amount of bedding used, weigh the bedding added to each pen per week and multiply the number of pens and the weeks between cleaning. Estimate the total weight of bedding and manure by adding the amount of manure produced using Table 1 or Table 2 or calculated using equations to the amount of bedding; subtract any liquid drained off i.r. not absorbed by the bedding (neglect drainage if well bedded).

Total Weight = manure weight + bedding weight

To estimate the volume of the manure and bedding, add manure production volume to 50% of the bedding volume. The volume of the bedding is usually reduced by half during use.

Total Volume = manure volume + (bedding volume/2)

As-Removed Manure Production and Characteristics

Many physical, chemical, and biological processes can alter manure characteristics from its original as-excreted form. The as-removed manure production characteristics values are reported in Table 3. These values represent typical values based on available data sources. These estimates may be helpful but have very high variability. The values may be helpful for an individual farm’s long-term planning prior to any samples being available and for planning estimates addressing regional issues. Whenever possible, site-specific samples or other more localized estimates should be used instead of the national tabular estimates. Permitted Concentrated Animal Feeding Operations (CAFOs) are required to annually report recovered manure for their individual farm. Use the tabulated values for planning purposes until site-specific values are available.

Manure Handling Characteristics

The handling characteristics of manure vary depending primarily on the solids content (Figure 20-1). Manure is usually classified as liquid, slurry, semi-solid, or solid depending on the total solids content of the manure. The boundary between handling classifications is not fixed but varies with specific composition.

Manure can be classified according to the dry matter content as liquid, slurry, semi-solid and solid.

  • Liquid manure contains up to 4% solids content and can be handled with irrigation equipment. Liquid manure with this kind of solids content can be obtained by removing larger solids from the manure through some form of solids separation, or adding dilution water. Lagoon treatment systems usually have less than 1% solids if designed and operated properly. Overloaded lagoons can reach up to 2% solids.
  • Slurry manure contains 4% to 10% solids and may require special pumps for handling. *Semi-solid manure contains between 10 and 20% solids. The manure is too thick to pump.
  • Solid manure contains 20% solids content or more. This manure can be stacked or be picked up with a fork or bucket loader.


Figure 1. Relative handling characteristics of different types of manure for various animal species (Source: MWPS-18 Section 1, 2004). cc2.5 Jactone Arogo Ogejo


Software

The spreadsheet, Feed Nutrient Management Planning Economics (FNMP$) is a comprehensive program connecting feed ration characteristics, manure storage type and cropping systems impact on the value of manure as a fertilizer. The spreadsheet provides a straightforward approach for estimating manure excretion based on the ASABE equations standard described above. FNMP$ estimates:

  1. manure nutrients
  2. land requirements
  3. labor and equipment application time, and
  4. costs and value for land application.

This is a spreadsheet-based program.

References

  • MWPS. 2004. Manure Characteristics.MWPS-18 Section 1. MidWest Plan Service, Ames. IA
  • ASABE. 2005. Manure production and characteristics. ASABE Standard D384.2. American Society of Agricultural and Biological Engineers. St. Joseph, MI.

Author: Jactone Arogo Ogejo, Virginia Tech

State Specific Manure Nutrient Management Information

Why is State Specific Nutrient Management Information Important?

State or regionally specific factors such as climate and soils impact the many manure nutrient management recommendations for application rates and best management practices (BMPs). In addition, state specific public policy may also establish minimum expectations and required practices.

Finally, state land grant university research may have identified preferred procedures for implementing crop nutrient recommendations or manure nutrient management that may differ from other states. Regardless of the driving force, it is recommended that nutrient management plans follow state specific recommendations for crop nutrient requirements, crop availability of manure nutrients, BMPs, and planning and record expectations.

Click on Your State to View Links to State-Specific Nutrient Management Information

If there is no information linked to your state on this map, it is recommended that you contact your land grant university, county Cooperative Extension office, or county or state USDA Natural Resources Conservation office. If your farm falls among those covered by state or federal regulation, your state’s environmental regulatory agency should also be contacted.

View Larger Map

Additional Information Sources on State Specific Nutrient Management

  • The Manure Management Planner computer program developed at Purdue University is one source of state specific information. The software currently supports 34 states (AL, AR, CA, CO, DE, FL, GA, IN, IL, IA, KS, MA, KY, MD, MI, MN, MO, MS, MT, NE, ND, NJ, NM, OH, OK, OR, PA, RI, SD, TN, UT, VT, WA and WI) by automatically generating fertilizer recommendations and estimating manure N availability based on each state’s Extension and/or NRCS guidelines. Check with your state to be sure the Manure Management Planner meets state specific nutrient management plan criteria.

Page Manager. Rick Koelsch, University of Nebraska, rkoelsch1@ unl.edu
Reviewers: Doug Beegle, Pennsylvania State University, and John Lory, University of Missouri

Whole Farm Nutrient Management – A Dairy Example

Introduction

This fact sheet has been developed to support the implementation of the Natural Resources Conservation Service Feed Management 592 Practice Standard. The Feed Management 592 Practice Standard was adopted by NRCS in 2003 as another tool to assist with addressing resource concerns on livestock and poultry operations. Feed management can assist with reducing the import of nutrients to the farm and reduce the excretion of nutrients in manure.

Please check this link first if you are interested in organic or specialty dairy production

Introduction to Whole Farm Nutrient Management

Whole farm nutrient management (WFNM) includes the consideration of import of nutrients to the farm, movement and transformation (including losses) of nutrients within the farm operation, and export of milk, meat, crops, or manure.

In order to understand WFNM, it is necessary to consider all sources of nutrients, their movement within the farm, and how they might move to the environment. On most dairies, feed represents the largest import of nutrients, with fertilizer as the second largest import of nutrients. Feed Management practices currently exist to reduce imports of nutrients (particularly nitrogen and phosphorus) or decrease their excretion. Many of these specific practices and management considerations will be outlined in two assessment tools (see fact sheets- Opportunity Checklist and Feed Management Plan Checklist) as part of the implementation process of the Feed Management 592 Practice Standard.

Nutrient Utilization by the Dairy Cow

Nitrogen (N) is used for milk production in the dairy cow with an efficiency of ~ 25 to 35%. The remaining 65 to 75% of nitrogen consumed by the dairy cow remains in the initial manure (feces and urine). However, N is lost to the atmosphere via volatilization.

Phosphorus utilization by species varies from approximately 20 to 50%. The 50 to 80% not utilized is excreted in manure. A dairy cow uses approximately 27% of dietary P for milk production and thus approximately 73% of dietary P is not exported as milk from the farm.

“A dairy cow uses approximately 27% of dietary P for milk production and thus approximately 73% of dietary P is not exported as milk from the farm.”

Whole Farm Nutrient Balance

The goal of whole farm nutrient management is to achieve “zero farm balance” through the adoption of a variety of management practices, including Feed Management (see Figure 1). The practices and the relative positive or negative balance (balance = anything that remains or is left over) will be unique to each farm.

It is important to acknowledge that due to biological processes, there will be losses to the environment even when all the best management practices are adopted. Therefore, “zero balance” is difficult to achieve while maintaining high crop productivity.

The concept of Whole Farm Nutrient Balance has been described in different ways progressing from simple to more complex approaches. First, consider various approaches using nitrogen as the nutrient of interest.

1st Approach -The first approach is to estimate Mass-Balance uses the concepts of import and export of managed resources (see figure 2) at the farm boundary. This approach measures only those nutrients that cross the boundary of the farm and does not directly track nutrients flows within the farm or nutrient losses from the farm. The difference between inputs and managed outputs can be used to calculate a positive or negative balance. This positive balance represents nutrients that will be lost to the environment by both air and water pathways as well as those nutrients that accumulate on the farm (e.g. increased soil nitrogen levels). The positive balance provides an estimate of environmental risk.

2nd Approach – The second approach takes into consideration the import-export of nutrients as well as losses due to volatilization of nitrogen from manure during collection, handling, storage, and application (see figure 3). This approach would include the Mass-Balance approach, plus estimates of volatile nitrogen losses. This approach is commonly used for development of Nutrient Management Plans (NMP) and Comprehensive Nutrient Management Plans (CNMP) in many states.

3rd Approach – The third approach takes into consideration the losses of volatile nitrogen as well as leached nitrogen (see figure 4). This approach is also common to NMPs and CNMPs when leaching index tools and soil nitrogen indices are utilized in NM planning.

In contrast to nitrogen, phosphorus (P) is not lost to the atmosphere and therefore, what is not exported from the farm remains within the farmstead or possibly lost due to transport. Thus, the 1st approach (mass-balance) and 3rd approach (mass-balance plus surface and leaching loss) are the approaches that are more common for P based nutrient management planning.

Checklist Tools

The “Opportunity Checklist and Feed Management Plan Checklist” summarize the common Feed Management practices that can be adopted to assist with reducing the import of nutrients to the farm in the form of feedstuffs or reduce the excretion of nutrients in manure (see Figure 4). The opportunity checklist includes Feed Management practices or concepts that usually have the greatest initial impact. These include but are not limited to:

  1. formulation of diets to meet animal requirements,
  2. grouping animals according to nutrient needs,
  3. determining dry matter routinely and adjusting rations accordingly, and
  4. analyzing diet ingredients routinely.

Additional Feed Management practices and strategies that can further assist with reducing the importation of nutrients to the farm are outlined in the Feed Management Plan Checklist.

Spreadsheet Based Whole Farm Nutrient Management Tools

Several spreadsheet based tools are available to estimate the nutrient balance at the whole farm level. The name of these tools and where a copy can be obtained are:

  1. Whole Farm Balance Nutrient Education Tool – Washington State University
  2. Whole Farm Nutrient Balance – University of Nebraska
  3. Cornell Whole Farm Nutrient Balance Assessment Program

Summary

Whole farm nutrient management should include the consideration of import of nutrients to the farm, movement and transformation (including losses) of nutrients within the farm operation, and export of milk, meat, crops, or manure.

Whole Farm Fig 1.jpg


Whole Farm Fig 2.jpg


Whole Farm Fig 3.jpg


Whole Farm Fig 4.jpg


“Extension programs and policies are consistent with federal and state laws and regulations on nondiscrimination regarding race, sex, religion, age, color, creed, national or ethnic origin; physical, mental or sensory disability; marital status, sexual orientation, or status as a Vietnam-era or disabled veteran. Evidence of noncompliance may be reported through your local Extension office.”

Disclaimer

This fact sheet reflects the best available information on the topic as of the publication date. Date 5-30-2007

This Feed Management Education Project was funded by the USDA NRCS CIG program. Additional information can be found at Feed Management Publications.

Image:Feed mgt logo4.JPG

This project is affiliated with the Livestock and Poultry Environmental Learning Center.

Image:usda,nrcs,feed_mgt_logo.JPG

Project Information

Detailed information about training and certification in Feed Management can be obtained from Joe Harrison, Project Leader, jhharrison@wsu.edu, or Becca White, Project Manager, rawhite@wsu.edu.

Author Information

Joe Harrison
Nutrient Management Specialist
WSU-Puyallup
jhharrison@wsu.edu
253-445-4638

Rebecca White
Feed Management Educator
rawhite@wsu.edu

Partners

Image:Logos2.JPG

Estimating Manure Nutrient Excretion

Printer friendly version

Introduction

This fact sheet has been developed to support the implementation of the Natural Resources Conservation Service Feed Management 592 Practice Standard. The Feed Management 592 Practice Standard was adopted by NRCS in 2003 as another tool to assist with addressing resource concerns on livestock and poultry operations. Feed management can assist with reducing the import of nutrients to the farm and reduce the excretion of nutrients in manure.

The Natural Resources Conservation Service has adopted a practice standard called Feed Management (592) and is defined as “managing the quantity of available nutrients fed to livestock and poultry for their intended purpose”. The national version of the practice standard can be found in a companion fact sheet entitled “An Introduction to Natural Resources Feed Management Practice Standard 592”. Please check in your own state for a state-specific version of the standard.

Please check this link first if you are interested in organic or specialty dairy production

Estimating Manure Nutrient Excretion

The front and back end of an animal is connected. While this principle seems obvious, it has historically been ignored in nutrient planning procedures. This fact sheet describes tools that allow integration of feed management and animal performance into nutrient planning processes for animal feeding operations.

A new standard published by the American Society of Agricultural and Biological Engineers (D384.2, Manure Production and Characteristics) is a tool for developing farm specific Comprehensive Nutrient Management Plans (CNMP). This standard allows accurate estimates of nutrient and solids excretion reflective of feed programs and animal performance. Accurate estimates of manure excretion are critical to estimating land requirements and land application costs, sizing manure storage, and planning treatment technologies. This fact sheet will introduce the new manure excretion standard and its application.

Contents of the Manure Production Standard

An ASABE committee of animal scientists and agricultural engineers developed predictive equations for estimating manure excretion for five species (beef, dairy, horse, poultry, and swine) and “typical” characteristics for excreted and as-removed manure. The standard is found at ASABEfollowed by a search of “Standards” and “Title” options for “Manure Production”. The ASABE standard includes seven sections.

Section 1 lists a new “typical” characteristics tabular summary for individual species and groupings of animals. See Tables 1 and 2.(PDF file) These values should provide a reasonable estimate of excretion for animals in the year 2000. As time passes, published typical values become less accurate and should be used with caution for individual herds or flocks. Differences in genetics, feed program, and animal performance between individual farms create a potential for errors when typical values are applied. They may have value for preliminary nutrient planning estimates but should NOT be used in final farm-specific nutrient management plans.

Sections 2 through 7 define the equations for cattle, dairy cattle, horses, poultry (separate sections for meat birds and layers), and swine, respectively. Equation based estimates are provided for all species groups for dry matter, N and P excretion. Equations for estimating additional characteristics are available for some species.

Section 8 of the new standard summarizes As-Removed manure characteristics. The work group summarized a wide range of data sets for inclusion in this section. These values can be beneficial for estimating storage volumes and manure application rates when no other farm-specific information is available. However, when farm specific manure samples are available, they are preferred.

Two Approaches for Estimating Excretion

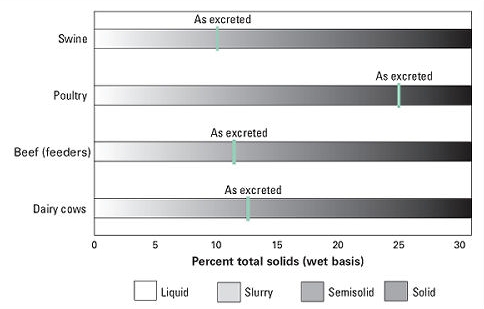
Two distinctly different approaches were used equation based estimates of excretion. The beef, swine, and poultry work groups used an animal mass balance approach (Figure 1). Excretion is estimated as a difference between feed nutrient intake and retention in body mass or animal products (eggs or milk). intake and retention in body mass or animal products (eggs or milk). The dairy and horse work groups used existing data sets as a basis for multi-variable regression analysis. The dairy work group proposed equations for lactating cows, dry cows and heifers. The horse work group chose to publish separate equations for exercised and sedentary horses. See Table 1. Estimated typical manure (urine and feces combined) characteristics as excreted by meat-producing livestock and poultry.(PDF file) Diet based numbers are in BOLD. Source ASAE D384.2 March 2005, Manure Production and Characteristics.

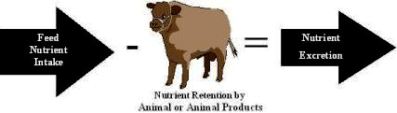
Figure 1. Mass balance approach was used for estimating excretion haracteristics for beef cattle, swine and poultry.

Factors Affecting Nutrient Excretion

The new standard defines the relationship between feed inputs and animal performance and manure excretion characteristics. For example, the quantity of solids excreted is directly tied to the dry matter digestibility of the diet. Since dry matter digestibility for many species is often 80 to 85% (15 to 20% of solids in feed excreted in feces), small changes in dry matter digestibility produce large differences in solids excreted. A dietary modification that changes dry matter digestibility change from 85% to 80% results in 33% more solids in the feces. Similarly, dietary intake of protein and phosphorus is directly related to excreted N and P.

Historically, manure excretion estimates have been based upon standards published by the ASABE, USDA Natural Resources Conservation Service, and Midwest Plan Service. These previous standards varied excretion estimates with species and animal weight only. A linear relationship was assumed between excretion and body weight. However, this approach provides a poor explanation of important biological factors that influence manure excretion. In addition, these standards become dated with time because they do not recognize changes in genetics, animal performance, and feeding options. Current and past excretion estimates based upon species and body weight alone often produce inaccurate estimates of manure excretion for individual farms.

The standard for manure excretion released by ASABE in 2005 was designed to provide farm-specific estimates of excretion reflective of individual farm feed programs and animal performance. In addition, this standard will better adapt to changes in excretion that occur over time due to factors such as improved animal genetics. Thus, the equation based standard for manure excretion released in 2005 should remain accurate well into the future.

Is This Important?

Tables 3, 4, and 5(PDF file) illustrate excretion estimates for beef, swine, and dairy calculated from the new equations. Some of the more dramatic differences between the current ASABE and other standards are associated with P and total solids excretion. These differences tend to become larger as emerging feed technologies reduce nutrient excretion and as feeding of by-products of corn processing and other food processing industries become increasingly popular. To illustrate the importance of the new ASABE standard for farm specific estimates, comparisons are illustrated below for three species.

Beef

A comparison of excretion characteristics estimated by the new ASABE standard with past standards (Table 3, Rows A-C) suggests that previous estimates are in reasonable agreement for N excretion but in poor agreement with P excretion. A significant effort to better match beef cattle rations with phosphorus requirements has reduced P excretion substantially.

Considerable variation exists between individual cattle feedlots relative to performance and feed program strategies. Substantial variation in N and P excretion is anticipated when comparing a corn based ration (Table 3, Row C) and a ration with 40% distillers grains (Table 3, Row D). Combining feed program variation with typical ranges in animal performance can produce a 2-fold range in N excretion and a 3-fold range in P excretion (Table 3, Rows F and G). Large errors in beef cattle excretion estimates are common unless performance and feed program are considered in estimating excretion.

Swine

Typical nitrogen excretion estimates for swine for the new standard have changed little from the past ASAE standard (Table 4, Rows A-B). However, phosphorus excretion is substantially lower than other standards. Total solids excretion is also generally lower than previously accepted values.

Table 4 illustrates the importance of a standard that responds to emerging feeding strategies (Table 4, Row C). Diets based on use of crystalline amino acids and phytase have the potential for lowering dietary CP and P levels and N and P excretion. A low CP diet would produce N excretion levels up to 40% less than new standard typical value. Low P diets would reduce P excretions levels by 33 to 40% from new typical values.

Dairy Cattle

Generally the new ASABE standard predicts greater excretion of nutrients and solids as compared to the past ASAE standard and other existing accepted values for lactating cattle (Table 5, Rows A and B. Steadily increasing milk production will create an even larger disparity between predicted excretion by the new ASABE standard and other past values.

Tools for Applying ASABE Standard

The proposed ASABE equations complicate the process of estimating nutrient and solid excretion. Software tools based upon these equations provides one option for improving the utility of equations and their application to farm specific CNMPs. Two spreadsheet tools use the ASABE estimate of excreted nutrients as a basis for estimating land requirements for managing manure nutrients. A Nutrient Inventory comes with instructions and a one-hour video discussing its application (available at University of Nebraska). A second tool nearing completion (FNMP$) will estimate land requirements, cost and time required for land applying manure, and potential economic benefits of manure nutrients (will be available at the same web site).

A simplified hand calculator of nutrient excretion was introduced in a MWPS publication, Manure Characteristics (Table 6). It uses a mass nutrient balance procedure for estimating excretion for beef, dairy, poultry and swine. It provides a simplified approach that produces similar answers to procedures used in the ASABE standard.

Information Requirements for Using New Standard

The information requirements of the new standard are greater than with past standards. Farm specific information is needed for animal performance ( e.g. weight gain or milk production) and feed program (dry matter intake and nutrient concentration). Those input requirements are summarized in [media:Table7excretion.pdf | Table 7]].

Applications of New ASABE Standard

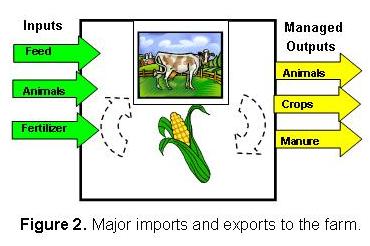
Most nutrient planning processes follow a step-wise procedure similar to that illustrated in Figure 2. At this time, the equation-based estimates of solids and nutrients will have their greatest utility in the strategic or long-term planning. These strategic plans are of greatest value to a new or expanded facility or when a regulatory permit is being assembled.

Figure 2 illustrates a second critical planning phase, the Tactical or Annual Plan. For decisions such as manure application rates, timing, and location, constantly changing conditions such as weather and residual soil nutrients must be considered. On-farm data such as manure samples will likely be of greater value to annual planning processes than the predictions made by the new ASABE equations

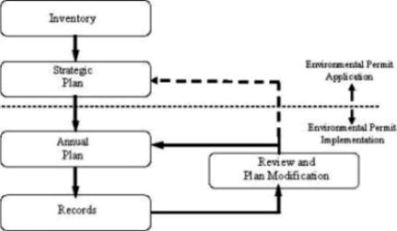
Figure 2. Common planning procedure used for nutrient management planning.

Improvements in nutrient excretion estimates offered by the new equations should improve the accuracy of farm-specific planning for:

  • Land requirements for managing N and P. The equations provide a more accurate estimate of nutrient driven land requirements for manure application when on-farm data on manure production is not available. Nitrogen volatilization and availability estimates remain a weak point for this planning process.
  • Cost of manure application. The ASABE equations are being used to estimate manure nutrient value as well as time, equipment, and labor requirements for handling manure (Kissinger et al., 2005).
  • Ammonia emissions. Ammonia emissions from animal facilities are of increasingly interest to the regulatory community. The equations should provide a mechanism for adjusting farm emission estimates based upon several farm-specific factors.

The equations also allow a prediction of dry matter excretion and possibly volatile solids excretion if feed digestibility values are known. This approach will allow farm specific estimates of solids excretion that will benefit planning estimates of:

  • Anaerobic and aerobic lagoon sizing,
  • Anaerobic digester sizing and gas production,
  • Storage sizing if solids estimates are combined with known moisture contents resulting from specific manure handling systems

Summary

The new ASABE standard for manure excretion provides an important tool for key strategic planning activities important to a comprehensive nutrient management plans. In addition, the new standard provides an important tool for integrating feed management decisions into CNMPs and deciding the environmental and economic benefits and costs of feed program options.

Related Files

To follow the references in this article, it is recommended that you print these four PDF files and refer to them at the appropriate places in the article.
Tables 1 and 2
Tables 3, 4 and 5
Table 6
Table 7

Disclaimer

This fact sheet reflects the best available information on the topic as of the publication date. Date 5-25-2007

Acknowledgements

This Feed Management Education Project was funded by the USDA NRCS CIG program. Additional information can be found at Feed Management Publications.

Image:Feed mgt logo4.JPG This project is affiliated with the Livestock and Poultry Environmental Learning Center.

Image:usda,nrcs,feed_mgt_logo.JPG

Project Information

Detailed information about training and certification in Feed Management can be obtained from Joe Harrison, Project Leader, jhharrison@wsu.edu, or Becca White, Project Manager, rawhite@wsu.edu.

Author Information

R.K. Koelsch, University of Nebraska-Lincoln

Images: CC 2.5 Rick Koelsch

Partners

Logos2.JPG

“Extension programs and policies are consistent with federal and state laws and regulations on nondiscrimination regarding race, sex, religion, age, color, creed, national or ethnic origin; physical, mental or sensory disability; marital status, sexual orientation, or status as a Vietnam-era or disabled veteran. Evidence of noncompliance may be reported through your local Extension office.”

Whole Farm Nutrient Balance

What is Whole Farm Nutrient Balance?

Nutrient management is a process of planning for manure and fertilizer applications to individual crop fields. Whereas whole farm nutrient balance considers the location and flow of nutrients onto, within and off the entire farm. Whole farm nutrient balance involves taking a step back and also comparing the amount of nitrogen (N), phosphorus (P), and potassium (K) and other nutrients entering the farm as purchased feed, fertilizer, animals etc. with the amount of nutrients leaving the farm as milk, animals, crops, manure exports to other farms, etc. Such a comparison can help in determining the economic and environmental impacts of nutrient management on dairy and livestock farms.

A comparison of the flows of nutrients onto and off dairy and livestock farms results in whole farm nutrient balance assessment. This balance is usually calculated from records of the nutrient-containing materials coming onto the farm (feed, fertilizer, purchased animals) and those leaving the farm in the form or products (milk, meat, eggs, crops, etc.). Balances can be expressed as percentage remaining, lbs/acre remaining or, for dairy farms, as lbs remaining per unit milk produced. For an example, see the Cornell Whole Farm Nutrient Balance Software or other such tools.

An estimate of the whole farm nutrient balance can also be determined from the density of livestock on the farm. Animal Density is usually estimated from the number of animal units per acre. (See box below)

Animal Density=Animal Units (AU)/Acre on an annualized basis,

  • AU=1000 lb live weight/A
  • Acres=acres available for manure application
  • Annualized=days our of 365 animals are on the farm producing manure

Animal Density=AU/Acre*(Days/365)

Go to the Animal_density_Calculator (Excel file)

Source: Doug Beegle, Pennsylvania State University.

Why Is the Whole Farm Nutrient Balance Important?

When the inflow of nutrients is greater than the outflow, annual losses and/or accumulation of nutrients will occur. The whole farm nutrient balance can indicate the potential for non-point source pollution from nutrients on the farm which can help to target management efforts to minimize the impact of nutrients on the environment. As such, the assessment of a farm’s nutrient mass balance can assist producers in determining the need for and identification of management practices that can reduce nutrient imports or enhance exports such as off site movement of manure, manure treatment, feed ration adjustments, land purchases and herd size adjustments to land acres. Knowing a farm’s nutrient balance is especially useful for farms looking at expansion or costly upgrades of equipment and buildings to ensure the long term sustainability of the farm.

The whole farm nutrient balance brings a number of important characteristics of the farm to the forefront that can optimize the economics of manure management while minimizing the environmental impacts from manure nutrients. Some of these are summarized in the table below.

The economics of nutrient management are often linked to the whole farm nutrient balance. For example, most people assume that improved nutrient management will always result in a positive economic return for the farm, but in fact, on many of the farms with a high potential for nutrient pollution, the economics of improved nutrient management to protect the environment will be costly. For farms that have excess nutrients the goals become maximizing safe utilization of nutrients and developing a strategy for removing excess nutrients from the farm. Examples of different nutrient management strategies based on nutrient balance can be seen by selecting the appropriate link in the table below.

Characteristics of Farms Based on Manure Nutrient Balance
Manure Nutrient Balance Deficit Balanced Excess
Animal Density* Low (<1.25 AU/A) Medium (1.25-2.25 AU/A) High (>2.25 AU/A)
Feed Source (% Off Farm) <50% 50-80% >80%
Land for Manure Application Adequate Limited Inadequate
Manure Management Strategy Deficit Balance Strategies Nutrient Balance Strategies Excess Nutrient Strategies
Economics of Nutrient Management Positive Neutral Negative
Non-point Source Pollution Potential Low Low to High High

*For P balance assessment, animal densities shown here should be halved.

Recommended Resources for Calculating Whole Farm Nutrient Balance

Excess Nutrients Management Goal = Reduce the Excess

  • Remove manure nutrients from the farm
  • Reduce the animal density
  • Manage nutrients remaining on the farm based on nutrient balance.
  • Example tactics:
    • Sell manure
    • Give manure away
    • Acquire more land
    • Reduce animal numbers

“In Balance” Management Goal = Maximize Safe Use of Manure Nutrients

  • Manage manure based on nutrient balance
  • Manage nutrients so that over time inputs balance outputs
  • Example tactics:
    • Spread manure on legumes
    • Don’t incorporate manure. Note: This strategy is currently sustainable but will likely change if air emissions need to be reduced.
    • Increase intensity of cropping system
    • Detailed plan needed

Deficient Management Goal = Maximize Efficient Use of Manure Nutrients

  • Manage based on expected crop response to manure nutrients.
  • Manage nutrients to increase yields or decrease purchased inputs.
  • Example tactics:
    • Spread manure in the spring as near to the time of crop utilization as practical
    • Use cover crops to conserve nutrients from fall and winter applied manure
    • Incorporate manure immediately to conserve nitrogen
    • Spread manure on N requiring crops
    • Don’t spread manure on legumes – they don’t need the N
    • Spread manure on fields with low P & K soil test levels

Page Manager: Douglas Beegle, Penn State University

Software and Web-Based Resources for Nutrient Management

Why Utilize Tools for Nutrient Planning?

The process of nutrient management planning can be complex and time consuming. Doing a good job requires:

  • collecting and organizing extensive information about a farm;
  • making a diverse series of decisions and calculations about crops, fertilizer and manure management; and
  • communicating the completed plan to a multiple audiences including the farmer.

There is an expanding list of web-based and personal-computer-based tools that can help nutrient management planners write effective nutrient management plans. Some of these tools help with a specific element of the nutrient management process where others perform multiple parts of the process.

The objective of this page is to show some of the diversity in software tools that may be useful to nutrient management planners. The listing is not and cannot be comprehensive and will focus on tools that have a national audience. Some state-specific tools are included if they provide a particularly unique service or approach.

There are many state-specific tools. If you see a helpful resource on this site you may want to search for an analogous program developed in your region or state that may have more relevant supporting data integrated into the program. Links to state-specific nutrient management pages may be listed on State Specific Manure Nutrient Management Information.

Data Collection and General Information

  • Google Map provides aerial view of areas of interest and driving directions. A good place to get started.
  • University of Missouri National Data Finder. Download spatial and soils data needed to run RUSLE2, MMP and SNMP for any location in the U.S. Includes selected soils data and black and white georeferenced aerial photos (DOQ’s). Clip areas up to 10,000 acres.
  • University of Missouri Animal Feeding Operation Site Assessment Tool (AFO SITE): Available only for Missouri. Web-based application that produces a detailed site assessment evaluating the sites suitability for an animal feeding operation.
  • Web Soil Survey. Download tabular and spatial soils data for U.S. counties. Whole county data sets sent in an email.
  • NRCS Geospatial Gateway provides access to a diverse set of spatial layers. Cannot clip to area of interest so file sizes typically too large to download over the internet.
  • USDA National Agricultural Imagery Program provides georeferenced aerial photography of agricultural land taken during the growing season. The imagery is available for download as mosaicked DOQQ’s either individually or as compressed county images.

Nutrient Balance Calculators

Whole farm nutrient balance looks at all nutrient imports and exports on a farm and can be a useful tool to evaluate the nutrient status of a farm. Are there too many nutrients? Is the farm nutrient deficient?

  • University of Nebraska Nutrient Balance Calculator. A spreadsheet based calculator. The web site includes links to good supporting information.
  • Cornell University Nutrient Balance Calculator. A spreadsheet based calculator. The web site includes links to good supporting information.

Nutrient Management Software

This software helps the user through the many steps of completing a nutrient management plan. Many states have there own software including NC, NY, VA, and WI.

  • Purdue’s Manure Management Planner. The most complete multi-state software for writing nutrient management plans. Includes state-specific fertilizer recommendations, manure nutrient availability calculations and generates plans that meet national standards for USDA-NRCS and EPA. Automated links to SNMP for geographic information and to the record keeping program WinMax. A free stand alone program available for 34 states.

Economics of Manure Management

What is manure worth? This can be a complicated question to answer. These tools provide some help in making economic decisions about manure.

  • Feed Nutrient Management Planning Economics (FNMP$): a comprehensive program connecting feed ration characteristics, manure storage type and cropping systems impacts on the value of manure as a fertilizer. FNMP$ estimates: 1) manure nutrients, 2) land requirements, 3) labor and equipment application time, and 4) costs and value for land application. Spreadsheet-based program. Instructions for program.
  • University of Missouri Manure Value Spreadsheet A spreadsheet-based calculator of the fertilizer value of manure based on manure test results, crop fertilizer recommendations and fertilizer prices.
  • University of Minnesota What Is Manure Worth? spreadsheet.

Other Tools and Resources

  • Spatial Nutrient Management Planner (SNMP): an ArcView 3.x program that facilitates delineating farm fields, mapping setbacks and soil test levels and calculating field sizes and spreadable acres. Available for all states. Links automatically to MMP. An ArcView 9.x version to be released soon.
  • Revised Universal Soil Loss Equation ver. 2 (RUSLE(2)): Used by USDA-NRCS to estimate edge-of-field erosion losses. Complicated to get started and not fully intuitive to use. The good news is that it will soon be fully integrated into MMP.
  • NRCS eFOTG (electronic Field Office Technical Guide: This is not software, but this website has links to conservation standards such as Nutrient Management (590) and Waste Utilization (633) for every state. Search in section IV under “Conservation Practices”.
  • Phosphorus Index: There is no national P index. Instead individual states have developed P indexes that meet the needs of their state. Look for information about the P index through the state NRCS office or Land Grant University.
  • Animal Waste Management (AWM) software: Facilitates sizing of manure storage facilities for animal feeding operations. Estimates the volume of manure, waste water and solids generated by animals in confinement. Does not address state-specific requirements. Some states have state-specific programs. To view a tutorial on using this software, see Animal Waste Management Software Training Video

If there is web page or software program you would like to have included on this webpage please contact John Lory.

Author: John Lory, University of Missouri, loryj@missouri.edu
Reviewers: Rick Koelsch, University of Nebraska and Rich Meinert, University of Connecticut

Manure Application to Soybeans

During the last decade, the number and size of confined animal feeding operations has continued to increase. In the Midwest, corn is the primary recipient of liquid manure from these facilities. However, while the density of production animals has continued to increase, the corn acreage available for manure application has not. To avoid over-application of manure to corn land, producers are pursuing other crops such as soybeans and alfalfa as alternative crops to receive manure.

Why Consider Applying Manure to Legumes?

The justification often applied for manure use on legumes is their ability to reduce N fixation when a readily available N source such as manure is applied. In addition, crops such as soybeans and alfalfa can utilize the phosphorus and potassium applied with the manure, thus reducing the costs of commercial fertilizer. For example, a 60 bushel/acre soybean crop in Iowa may remove up to 228 lbs of nitrogen, 48 lbs of phosphorus (P2O5), and 90 lbs of potassium (K2O) per acre. More…

While there may be some economic, practical, and environmental reasons to apply manure to both corn and legumes such as soybeans and alfalfa there are also some disadvantages of such practices. Issues related to manure use on alfalfa will be discussed in Manure Application to Alfalfa. Here, we discuss manure use for soybeans.

Effects of Manure Application to Soybeans

One area of concern is related to the environmental consequences of manure application to row crops such as soybeans, and specifically concerns about nitrate losses through subsurface drainage systems. Relative to environmental considerations, it should be noted that application of manure on corn residue prior to soybeans may have some benefit compared to application of the manure prior to corn on soybean residue since sufficient soil residue cover may be maintained with injection into cornstalks. In addition, there are questions on whether there are any negative impacts of manure application on soybean yields.

Subsurface drainage throughout much of the Midwest U.S. accelerates nitrate loss to downstream waterbodies. (Photo courtesy of the USDA-NRCS)

Yield Impacts

Several studies have been performed in the Midwest region of the U.S. resulting in positive yield increases related to liquid swine manure application on soybeans. However, there is no single conclusion as to why an increase in yield occurs. The studies identify yield increases from manure as the potential result of in-field initial nitrate, P, K, or other nutrient deficiencies. So, manure provided the nutrients that were deficient resulting in a yield increase and offsetting costs for purchased fertilizer. However, not in all cases was the yield increase sufficient to overcome application costs.

In addition to potential environmental concerns some studies have noted rare occurrences of reductions in soybean yield when manure is applied prior to soybeans and higher occurrences of common soybean diseases. A Minnesota study recommended that application of manure be avoided on fields with a history of white mold due to potential yield suppression due to manure application. Others have noted that manure application prior to soybeans can increase certain soybean diseases, specifically Pythium and Phytophthora damping off and Phytophthora root rot.

Another precaution that has been raised relative to liquid swine manure application to soybeans is that soybean seed germination and emergence can be sensitive to salts, so that if manure is applied close to planting time, there is a potential for injury especially if the soybean is planted into the manure or very near the manure.

Environmental Impacts

There have been few studies that have documented the environmental impacts of manure application to soybeans. A Minnesota study in the 1990’s evaluated the impact of liquid swine manure application on nodulating and non-nodulating soybeans. They found that applying manure at greater nitrogen rates than needed for maximum soybean yields did not adversely affect soybean yield. However, they found that application of nitrogen from the liquid swine manure increased post harvest soil nitrate levels. They also found greater increases in soil nitrate levels early in the growing season than post harvest.

Nitrogen

Manure application rates supplying from 0 to 446 lb N/acre in 89 lb N/acre increments were used in the study. Post-harvest soil nitrate levels were on average 37.7 lb N/acre (0-48 in) when no manure was applied and increased to 39.9, 44.4, 51.0, and 60.0 lb N/acre at applied nitrogen application rates of 50, 100, 150, and 200 lb N/acre, respectively. So, at an applied nitrogen application rate of 100 lb N/acre which might be about one-half of crop removal (soybean) the post-harvest soil nitrate was increased by about 15% compared to when no manure was applied.

Two drainage water quality studies in Iowa have evaluated the impact of liquid swine manure application to both corn and soybeans within a corn-soybean rotation. For a four-year study (2001-2004) at the Gilmore City research site in Pocahontas County, applying liquid swine manure at the rate of 150 lb N/acre (total nitrogen) before both corn and soybeans did not increase either corn or soybean yields compared to a rate of 200 lb N/acre of manure applied every other year before corn. In addition, the total of 300 lbs (two years of 150 lb N/acre) versus the 200 lb N/acre two-year-rate resulted in nitrate-N concentrations in tile drainage increasing on average from 17 to 23 mg/L, a 35% increase that was statistically significant.

For a six-year study (2001-2006) at the ISU Northeast Iowa Research Farm, applying liquid swine manure at the rate of 150 lb N/acre (total nitrogen) before corn and 200 lb N/acre (total nitrogen) before soybeans increased corn and/or soybean yields slightly some years (on average 3 and 2 bu/acre for corn and soybeans, respectively) compared to 150 lb N/ac of manure applied every other year before corn. The total of 350 (one year of 150 lb N/acre and one year of 200 lb N/acre) versus the 150 lb N/acre two-year-rate resulted in nitrate-N concentrations in tile drainage increasing on average from 21 to 38 mg/L, an 81% increase.

Both of these studies applied a relatively high nitrogen rate to the soybeans, but at these rates when liquid swine manure was applied every year in a corn-soybean rotation there was an increase in nitrate-nitrogen concentrations in the subsurface drainage water. However, it is unknown what direct water quality risk there would be with lower application rates specifically at rates ranging from 100-125 lb N/acre to soybeans. While the results discussed above were for studies on tile drained soils it is expected that there would be similar risks on non-tile drained soils relative to nitrate concentrations moving below the crop root zone.

Phosphorus

The application of manure to both corn and soybean, as noted above, could increase the risk of nitrate loss. Additionally the annual application of manure could increase the buildup phosphorus which could be of concern mainly from a surface runoff perspective. Considering a 60 bu/acre soybean crop the phosphorus removal (P2O5) might be 48 lb/acre and the potassium removal (K2O) might be 90 lb/acre, and a 200 bu/acre corn crop might remove 75 lb/acre of phosphorus (P2O5) and 60 lb/acre of potassium (K2O). This might result in a two-year removal of 123 lb/acre of phosphorus (P2O5) and 150 lb/acre of potassium (K2O).

Applying liquid swine manure at a nitrogen application rate of 150 lb N/acre to corn and 100 lb N/acre to soybeans (250 lb N/acre in two year rotation) might result in an overall phosphorus application of 172 lb/acre and an overall potassium application of 194 lb/acre (using values for liquid swine manure from a grow-finish operation (wet/dry). More… These application rates could be a long-term concern relative to phosphorus build up since crop removal might be 123 lb/acre for phosphorus with a phosphorus application of 172 lb/acre. A phosphorus buildup could have implications relative to the phosphorus index.

Pros, cons, and recommendations for manure application to soybeans

Pros

  • Manure can supply phosphorus (P), potassium (K) and other nutrients;
  • Manure application on cornstalks can provide greater crop residue cover and lower erosion potential when injected or incorporated into cornstalks instead of soybean stubble on erosive land;
  • Manure application to soybeans can provide flexibility in application plans; and
  • Manure application to soybeans may improve soybean yields in some case.

Cons

  • Manure application to soybeans has the risk to increase nitrate in the soil profile which may increase the risk of nitrate loss;
  • Manure application to both corn and soybeans at an N rate for both crops could lead to a buildup of phosphorus; and
  • Manure application to soybeans under certain conditions may increase the risk of soybean diseases which could negatively impact yield.

Recommendations

  • Limit manure application to soybeans to a rate that compensates for N that would not be fixed by the soybean – this may be in the range of 100 lb N /acre;
  • Possibly limit manure application to soybeans to rates that fulfill the P and/or K requirements of the soybean crop or two-year corn-soybean rotation; and
  • Avoid manure applications when there is low crop utilization (i.e. fall applications).

Additional Resources

Author: Matt Helmers, Iowa State University Reviewers: Rick Koelsch, University of Nebraska, Quirine Ketterings, Cornell University and John Lory, University of Minnesota

Manure Application to Legumes

Legume crops can provide a means of utilizing significant quantities of manure nitrogen, phosphorus, and potassium. Sequestering manure nitrogen and phosphorus in harvested legume crops should minimize the environmental risk of manure nutrients. Economic value will be realized from phosphorus and potassium but not from nitrogen since legume crops can supply their own nitrogen needs by fixing nitrogen from the air. However, if nitrogen is available in the soil, legumes will generally harvest this nitrogen first. The following articles discuss the benefits and challenges of applying manure on legumes:

  • Manure Application to Alfalfa by John A. Lory, University of Missouri. Alfalfa has many characteristics that make it a desirable crop for manure applications. However there are significant challenges in managing manure on alfalfa.
  • Manure Application to Soybeans by Matt Helmers, Iowa State University. A 60 bushel/acre soybean crop in Iowa may remove up to 228 lbs of nitrogen, 48 lbs of phosphorus (P2O5), and 90 lbs of potassium (K2O) per acre. While there may be some economic, practical, and environmental reasons to apply manure to soybeans, there are also some disadvantages of such practices.
  • Webcast Presentation discusses the ban Iowa is phasing in for manure application to soybeans. The web cast discusses what we currently know about managing manure applications to legume crops and the potential impacts on water quality. The presenters are Jim Baker and Matt Helmers, Iowa State University, Steve Herbert, University of Massachusetts and Charles Shapiro, University of Nebraska.

Author: Matt Helmers, Iowa State University and John Lory, University of Manure Reviewers: Rick Koelsch, University of Nebraska

Alfalfa can serve as an excellent use of manure nutrients if manure is applied without the quality of the alfalfa stand. Photo: Stephen Herbert, University of Massachusetts.

Soybeans can utilize significant manure nutrients, but there are potential environmental challenges for protecting groundwater and tile drain water quality. Photo: Stephen Herbert, University of Massachusetts

Manure Application to Alfalfa

Reasons to Apply Manure to Alfalfa

  • Alfalfa requires high phosphorus (P) and potassium (K) soil fertility and has a high demand for these nutrients.
  • Alfalfa can benefit from the micronutrients in manure, particularly boron.
  • Alfalfa removes large amounts of nitrogen (N) and K from the field when harvested as hay.
  • Alfalfa has the ability to draw down nitrate levels within its root zone.
  • Forages like alfalfa have low erosion, nutrient runoff and nutrient leaching potential.
  • Alfalfa offers opportunities for manure application throughout the year.

Challenges In Applying Manure to Alfalfa

  • Poorly timed applications can damage the alfalfa stand through physical damage to plants.
  • Manure applications can increase weed competition particularly in mixed grass-alfalfa stands.
  • Alfalfa is a legume so has no requirement for applied N limiting manure nutrient value.
  • Manure can be an unbalanced fertilizer (i.e. does not exactly match crop needs for all nutrients) so applying manure based on N often results in the build up of excess P and K in the soil.
  • Manure applications at the end of stand life can result in soil N supply in excess of the following crop needs potentially increasing N losses to water and the atmosphere.

Alfalfa Corn Rotation

Alfalfa is predominantly grown in alfalfa-corn rotations associated with dairy production. The alfalfa stand can last five years or more and then the field is rotated to corn for two to three years before returning to alfalfa. In these systems the crop rotation has the dual role of utilizing the fertilizer value of manure and providing a place to apply manure to prevent overflow of manure storage facilities.

One challenging characteristic of alfalfa-corn rotations is the relatively low demand for external inputs of N. Alfalfa, as a legume crop, fixes the N it needs and typically requires no N applications to maximize yield. Residual benefits from the N fixed by alfalfa will provide most of the N needed by first-year corn following alfalfa and frequently reduce N needs in the second-year crop following alfalfa. See state-specific recommendations on the N value of an alfalfa stand to the subsequent crop. In most states the only significant fertilizer N need in alfalfa-corn rotations is on second- and third-year corn following alfalfa.

The best opportunity to maximize the value of manure in alfalfa-corn rotations is to apply manure to second- and third-year corn following alfalfa to at rates that meet N needs of corn. In this system all the N, P and K fertilizer value will be realized. Manure eliminates the need to purchase N, P and K fertilizer for corn and any excess P and K reduces fertilizer need of the following alfalfa crop.

Manure on established alfalfa can increase yields. In this study, swine slurry (4.5% dry matter) was surface-applied to alfalfa at four rates (0, 300, 450 and 600 kg/ha/year) in 1994 and 1995. Manure was applied four times per year typically a few days after cutting. Alfalfa yield was increased in the years of application and the two years following application. Reference: Ceotto, E and P. Spallacci. 2006. Pig slurry applications to alfalfa: Productivity, solar radiation utilization, N and P removal. Field Crops Res. 95:135-155.

Farmers benefit from maximizing manure applications to this portion of the rotation but there are limitations. The optimal timing of application is limited to a relatively short period in spring prior to planting and early in crop growth. There also typically is not enough land in second- and third-year corn following alfalfa to utilize all manure produced by the farm. Consequently dairy farmers frequently are looking for opportunities to apply manure on the alfalfa phase of alfalfa-corn rotations. However, this can result in a steady buildup of P and K in the soil.

Repeated applications of manure to meet both the nitrogen need of corn and the nitrogen removal capacity of alfalfa can excessively raise soil test P and K levels. Use nutrient management planning to balance manure application rates with rotation P and K needs. Manure on second- or third-year corn following alfalfa has the added benefit that the crop needs N. Figure from D. Beegle, The Pennsylvania State University.

image:Crop rotation 1.jpg image:Crop rotation 2.jpg

cc2.5 manure nutrient mgmt group

Opportunities to Apply Manure on Alfalfa

A prerequisite to making smart decisions about applying manure on alfalfa requires an understanding of the impact of applied N on alfalfa stands. Alfalfa has the capacity to fix N from the atmosphere to meet its needs. Each ton of harvested alfalfa can contain 50 pounds of N and in low N-supply soils most of this N will be derived from N fixation. Total N fixation can reach hundreds of pounds of N per acre per year. There is an energy benefit to the alfalfa plant to use N from the soil in preference to fixing N from the atmosphere. Alfalfa plants that have access to alternative N supplies will reduce N fixation and preferentially use the alternative N supply. This buffering process means manure applications that meet alfalfa N need will not lead to over-application of N. Such applications are not economically beneficial because there is no yield value to the applied N. But there is no water quality cost from applying this N even though the alfalfa does not need it.

There are three potential opportunities to apply manure on alfalfa:

  1. Preplant applications.
  2. Application to established productive stands.
  3. Post production applications prior to destroying the stand.

The first two strategies can be conditionally recommended as long as farmers are aware of the limitations and challenges of manure applications during these periods of alfalfa production. The final strategy, post production applications, cannot be recommended because manure applied at this time is likely to lead to potential increases in N loss.

Preplant Applications

Preplant manure applications for alfalfa can meet P and K requirements of manure for the first years of production. The application rate is limited by the lower yield and N demand during alfalfa establishment. Care must be taken insure that the seed is not in direct contact with fresh manure through injection or incorporation of manure. The N in the manure can promote weed competition during establishment. It also can promote lodging of oats if oats are used as a nurse crop for establishing alfalfa.

Application to Established Stands

Manure applications to established stands can provide needed P, K and boron. Alfalfa also provides windows of opportunity for manure application through the whole growing season. High yielding alfalfa has a high capacity to buffer high amounts of manure N. The primary concern with manure applications to established alfalfa is damage to the stand from the manure. Alfalfa plants can be damaged by high salt or ammonia concentration in the manure, by physical damage to the crowns by manure application equipment or by water deficits induced by high salt concentrations in the manure. The greatest danger is from slurry or solid manure that is applied with large manure spreaders. Lagoon water from unagitated lagoons typically posses less risk because nutrient and salt concentrations are lower. Another concern is manure may increase competition from grass or weeds if they are present in the stand.

diagram

Legumes like alfalfa have the capacity to buffer applications of manure N. When manure is applied alfalfa fixes less nitrogen. Figure used with permission from US Dairy Forage Research Center. cc2.5 John Lory

To minimize potential damage to the stand:

  • Make sure application equipment breaks up large lumps of solid manure and applies manure in a uniform pattern on the field.
  • Limit manure application rates. High rates increase potential for stand damage.
  • Apply manure immediately after cutting alfalfa and before budding on the alfalfa crowns. The alfalfa plant is less vulnerable to salt damage when no green leaves are showing. This is particularly important for surface applications of slurry.
  • When using manure that has a high potential to damage the stand apply to older stands that have a high grass or weed component. Mistakes with manure applications on these stands are less costly.

Applications at or Near the End of Stand Life

Applications at or near the end of stand life cannot be recommended because they lead to applications that exceed N utilization capacity of the rotation. Farmers frequently want to apply manure to alfalfa in the fall just prior to killing the stand. Manure applications at this stage occur after alfalfa N demand. It is really an application that will supply the subsequent crop with N; typically there is limited need for added N in the crop following alfalfa. Under these conditions manure applications will easily lead to excess N in the soil profile. Such conditions promote N losses to water and air resources.

Other resources

There are excellent extension publications further detailing the opportunities and challenges of managing manure for alfalfa. These include:

Recommendations

  • In alfalfa-corn rotations maximize manure value by applying to second- and third-year corn following alfalfa.
  • Applications to established alfalfa stands are conditionally recommended to meet P, K and boron needs. Manure N will have no value but alfalfa can buffer applied N minimizing over application concerns.
  • If manure is applied based on N need of the corn and N uptake by alfalfa, excess P and K buildup can be a problem. Therefore, try to balance P and K over the whole rotation.
  • Steps need to be taken to minimize potential damage to established alfalfa stands particularly when applying slurry or solid manure.

Author: John A. Lory, University of Missouri