Due to a technical glitch, the beginning of the recorded presentation was not recorded. Please accept our apologies.
Purpose
Manure management technologies are constantly being developed. But do these technologies meet their intended purpose? How effectively do they perform? Providing impartial evaluations on the effectiveness and longevity of these technologies requires time, finances, and expertise.
Newtrient, with support from a Natural Resources Conservation Service (NRCS) Conservation Innovation Grant (CIG) and a New York Farm Viability Institute Grant, has been evaluating 15 manure-related technologies with a focus on water quality. Through this effort, Newtrient will document the findings from each study to promote the broader adoption of these technologies in livestock manure management. One of the technologies evaluated, N2 Applied, explored the use of plasma treatment to increase nitrogen content in the manure waste stream, while simultaneously reducing ammonia and greenhouse emissions. This presentation will primarily highlight the results from the N2 Applied evaluation.
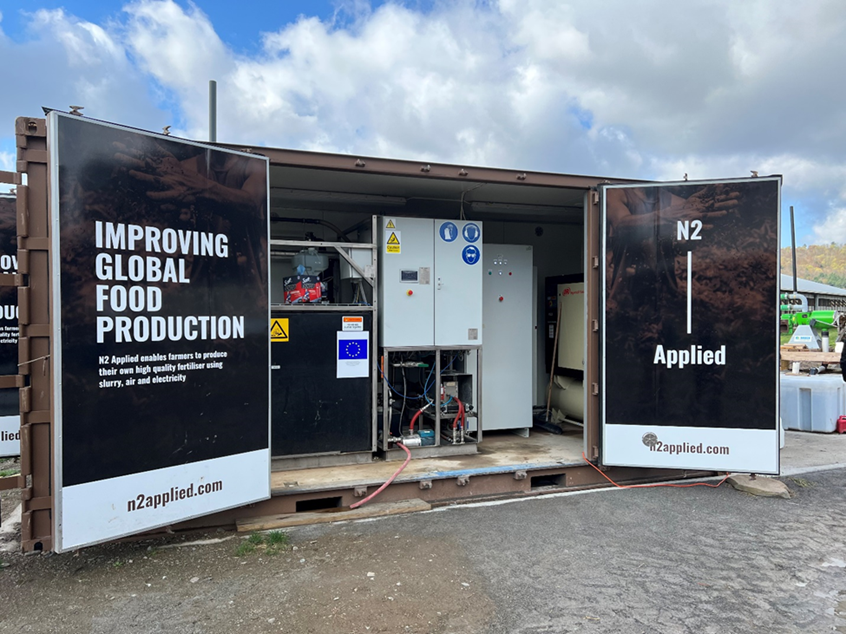
Figure 1. N2 Applied Demonstration Unit.
What Did We Do?
Newtrient collaborated with Washington State University to develop a technology review protocol. This evaluation process was modeled after the NRCS approach for assessing Waste (Manure) Treatment technologies, as outlined in Conservation Practice Standard 629, Waste Treatment. One of the challenges in reviewing manure management technologies has been obtaining technical third-party evaluations. This protocol established a comprehensive method for reviewing and evaluating these technologies.
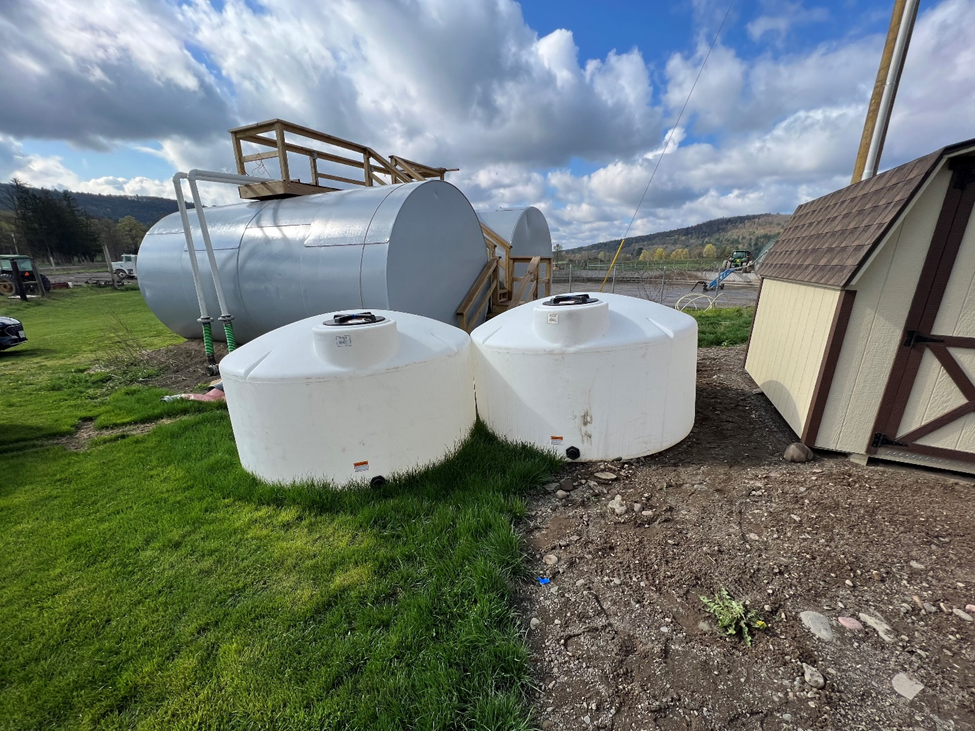
For the N2 Applied system, Newtrient contracted with Cornell University as the third-party evaluator. This evaluation compared the nitrogen content and stability of untreated and treated dairy manure over a 15-week period. Both static and flow-through tanks were studied to assess the effectiveness of this treatment process. Liquid samples were analyzed for nutrient content, with a focus on water quality issues, and a limited number of air samples were collected to evaluate greenhouse gas emissions and air quality.
The N2 Applied plasma technology uses electricity to split atmospheric nitrogen and oxygen which then forms into reactive nitrogen gas. This gas is absorbed into the manure waste stream raising the amount of plant available nitrogen while also lowering the pH. This demonstration unit was delivered and operated from a 20 feet long cargo bin.
Figure 2. Static and Flow Through Tanks Utilized for Technology Evaluation.
What Have We Learned?
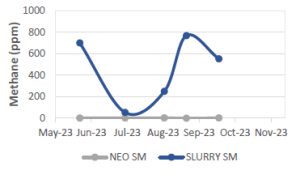
The N2 Applied technology increased the nitrogen content of the dairy manure by more than 50% in the static tanks and nearly 50% in the flow-through tanks. The plasma torch created nitrogen oxides by combining atmospheric nitrogen and oxygen gases. This treatment process lowered the pH to a set point, initially set at 5.5 but later adjusted to 5.0. This lower pH inhibited the microbial production of methane (CH4) and converted more of the nitrogen to ammonium (NH4+) instead of the more volatile ammonia (NH3). The following two figures show the impact of the N2 Applied technology on methane and nitrogen stability for the static tank portion of the study.
Figure 3. CH4 from static tanks
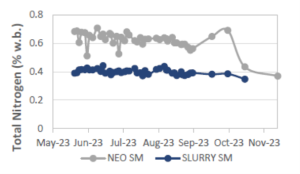
The nitrogen content remained stable for more than 4 months, and methane production was significantly reduced through this process. Coarse solid/liquid separation was a key component ensuring the efficient operation of the technology.
Figure 4. Nitrogen Levels with and without N2 Applied Technology.
For this demonstration unit, the plasma torch used approximately one-half of the energy consumed. The estimated annual electrical cost to operate this unit was $26,800. With the lessons learned from this evaluation, the new commercial unit will have much lower electrical costs.
Future Plans
The N2 Applied system evaluated for this study was a demonstration unit. Based on the lessons learned, a commercial unit is currently being developed, with deployment to the United States expected in late 2025. Once a new unit is installed, another series of studies will be conducted following a similar testing protocol.
For the commercial unit, a critical factor to evaluate will be the long-term stability of the nitrogen-enriched manure. Additionally, it will be important to assess production rates, along with capital and operating costs. Agronomic trials, combined with field emission measurements, will determine the impact on crop yield and air quality once the product is land applied.
Special thanks to the USDA-NRCS Conservation Innovation Grant program and the New York Farm Viability Institute for providing funding to allow for this technology evaluation to take place.
Videos, Slideshows and other media
Webinar Highlighting Evaluation Results: N2 Applied – Insights and Innovation
The authors are solely responsible for the content of these proceedings. The technical information does not necessarily reflect the official position of the sponsoring agencies or institutions represented by planning committee members, and inclusion and distribution herein does not constitute an endorsement of views expressed by the same. Printed materials included herein are not refereed publications. Citations should appear as follows. EXAMPLE: Authors. 2025. Title of presentation. Waste to Worth. Boise, ID. April 7–11, 2025. URL of this page. Accessed on: today’s date.
New technologies have been developed to extract and recover concentrated nitrogen (N) and phosphorus (P) from animal manure which can be upcycled as substitutes for conventional nitrogen (Urea) and triple super phosphate (TSP) fertilizers. In this study, the effectiveness of recovered nitrogen (RN) and phosphorus (RP) from liquid swine manure were compared with conventional N (CN) and conventional P (CP). Further, the availibility of RP to crop was enhanced using acidification of the material.
What Did We Do?
The RN was captured from liquid swine manure using a gas permeable membrane technology (Vanotti and Szogi, 2015). The RP was also captured from liquid swine manure using nitrification followed by chemical precipitation with calcium hydroxide (Vanotti et al., 2005). We evaluated annual ryegrass growth response to conventional and recovered nutrients using four nutrient combinations: CN+CP, RN+CP, CN+RP, and RN+RP at five N rates and three P rates (Figures 1 & 2). In a subsequent experiment, the solubility of RP was modified by acidifying the material before its application.
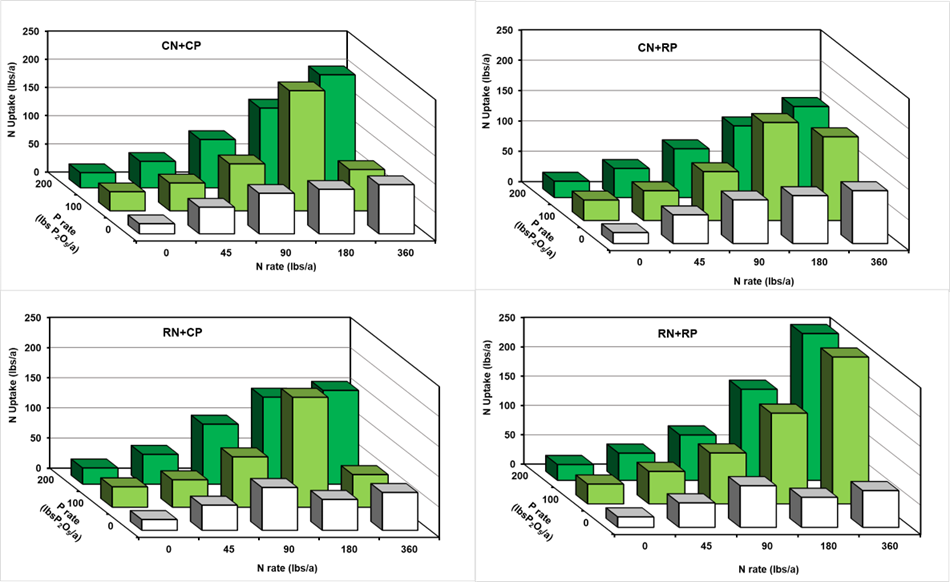
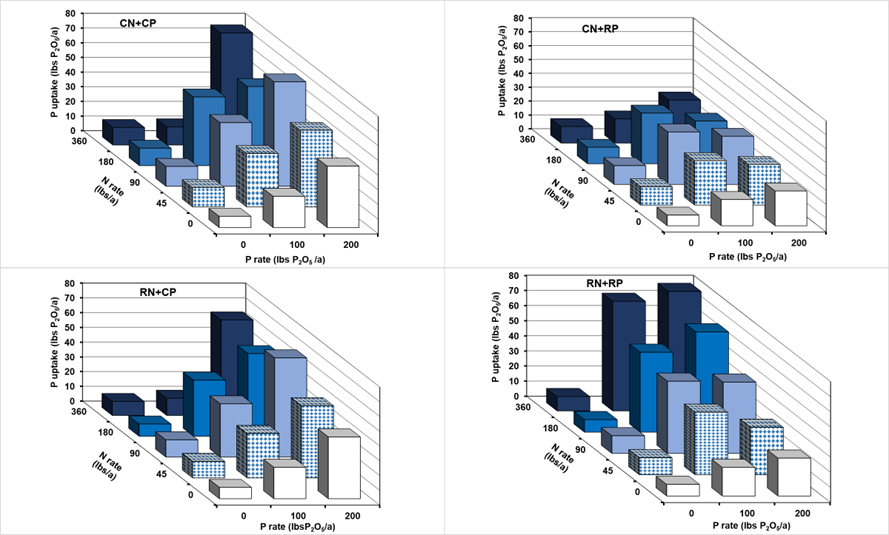
Figure1. Annual ryegrass N uptake in response to N and P under the different nutrient combinations. CN, conventional nitrogen, CP, conventional phosphorus, RN, recovered nitrogen, RP, recovered phosphorus. (Paye et al., 2024a)Figure 2. Annual ryegrass P uptake in response to N and P applications under the different nutrient combinations. CN, conventional nitrogen, CP, conventional phosphorus, RN, recovered nitrogen, RP, recovered phosphorus. (Paye et al., 2024a)
What Have We Learned?
The experimental soil was deficient in N and P, thus, the ryegrass responded to application of both nutrients. The ryegrass N uptake under RN was similar to N uptake under CN when using CP (Figure 1). When RN was blended with RP, the N uptake was significantly greater than the N uptake of conventional (CN+CP) nutrients blend. The P uptake of CP was greater than RP when using CN. However, the P uptake of RP blended with RN was substantially greater than CN+CP (Figure 2). The Acidification of RP improved its solubility and agronomic effectiveness (Paye et al., 2024b). Ryegrass supplied with acidified RP produced 8 – 38% greater dry matter yield and had 48 – 72% greater P uptake than ryegrass supplied with CP or non-acidified RP. The greater overall biomass yield and nutrient uptake of the recovered N and P combination demonstrate this as a novel nutrient combination that could be critical for improving crop yield and nutrient use efficiency in a circular agricultural system.
Future Plans
Crop response to these recovered nutrient blends will be evaluated using other crops under both greenhouse and field conditions.
Authors
Presenting & Corresponding Author
Wooiklee S. Paye, Research Soil Scientist, USDA-ARS Coastal Plains Soil, Water and Plant Research Center, Florence, SC, wooiklee.paye@usda.gov
Additional authors
Raul Moral, Professor, Miguel Hernandez University, Orihuela, 03312 Alicante, Spain.
Matias B. Vanotti and Ariel A. Szogi, Research Soil Scientists, USDA-ARS Coastal Plains Soil, Water and Plant Research Center, Florence, SC 29501 USA.
Quentin D. Read, Statistician, USDA-ARS Southeast Area, 840 Oval Drive, Raleigh, NC 27606 USA.
Additional Information
Paye, W. S., Herrero, R. M. Vanotti, M. B., Szogi, A. A., & Read, Q.D. (2024a). Agronomic Effectiveness of Nitrogen and Phosphorus Recovered from Swine Manure. Agrosystems, Geosciences and Environment. (In Press).
Paye, W. S., Vanotti, M. B., Szogi, A. A., & Herrero, R. M. (2024b). Enhancing the Agronomic Efficiency of Calcium Phosphate Recovered from Swine Manure. In ASA, CSSA, SSSA International Annual Meeting. ASA-CSSA-SSSA.
Vanotti, M.B., & Szogi, A.A. (2015). Systems and methods for reducing ammonia emissions from liquid effluents and for recovering the ammonia. U.S. Patent No. 9,005,333 B1, U.S. Patent and Trademark Office.
Vanotti, M.B., Szogi, A.A., & Hunt, P.G. (2005). Wastewater treatment system. U.S. Patent No. 6,893,567, U.S. Patent and Trademark Office.
Acknowledgements
This research was part of USDA-ARS National Programs 212 Soil and Air, ARS Project 6082-12630-001-00D. Raul Moral’s scientific visit to USDA-ARS Florence, SC, was funded by the Government of Spain, Ministry of Science & Innovation, through Fellowship Award PRX21/002116. The authors are thankful to Paul Shumaker and William Brigman for greenhouse and laboratory assistance. Mention of trade names or commercial products in this article is solely for the purpose of providing specific information and does not imply recommendation or endorsement by the U.S. Department of Agriculture.
The authors are solely responsible for the content of these proceedings. The technical information does not necessarily reflect the official position of the sponsoring agencies or institutions represented by planning committee members, and inclusion and distribution herein does not constitute an endorsement of views expressed by the same. Printed materials included herein are not refereed publications. Citations should appear as follows. EXAMPLE: Authors. 2025. Title of presentation. Waste to Worth. Boise, ID. April 7–11, 2025. URL of this page. Accessed on: today’s date.
Due to a technical glitch, the beginning of the recorded presentation was not recorded. Please accept our apologies.
Purpose
A common media used for woody ornamental production is a mixture of 8 parts pine bark and 1 part sand on a volume basis combined with various amounts of peat moss, sphagnum moss, or vermiculite to improve the aeration porosity (AP) and water holding capacity (WHC). Lime is also added to raise the pH to the level needed for the plant to be grown, and slow-release pellet fertilizer (14-14-14) is mixed in the range of 3 to 8 lb per cubic yard of media to provide a base level of fertility.
While materials such as peat moss and vermiculite hare valuable ingredients to improve the physical characteristics of potting media, there are some significant concerns. Peat moss is obtained from wetlands (peat bogs) and is a non-renewable resource that has increased in price. Vermiculite is a product of heat-treating ore mined from the earth to make the product used in horticulture. The rising energy costs associated with mining and heat processing have caused the costs of vermiculite to increase.
The purpose of this study was to determine if blending 20%, 40%, and 60% (volume basis) of composted poultry litter (CPL) with a bark-sand base mix could replace or reduce the need to mix in non-renewable ingredients to improve the physical properties (AP, WHC, bulk density, pH), and reduce the amount of pellet fertilizer (14-14-14) needed to provide typical levels of fertility for potting media used in ornamental plant production. The anticipated benefits would be reduced production costs for the horticulturalist and development of a consistent market for producers of compost products made from poultry litter mixed with locally sourced plant waste.
What Did We Do?
The first step in the study was to obtain large amounts of composted poultry litter (broiler or breeder litter mixed with wood and other plant waste) and screened pine bark from two separate manufacturers in South Carolina. The other material that was included in the media blends was builder’s sand. Three well-mixed pine bark and compost samples were sent to the Clemson University Agricultural Services Laboratory to determine the concentrations of major and minor plant nutrients, organic matter, carbon, pH, electrical conductivity (EC5), moisture content, and the dry matter bulk density. The only measurements obtained for the sand were the moisture content (3.7%) and density (1.143 g DM/cm3). The pH was assumed to be 7.0 based on published information. The average chemical and physical characteristics of the pine bark and compost are provided in Table 1. The complete details are given by Chastain et al. (2023).
The next step was to make the four different potting mixes using the three ingredients. The base mix was made by blending 8 parts pine bark with 1 part sand. The other three mixes were blends of the base mix and the compost product (CPL) on a volume basis. The 20% CPL mix was 1 part CPL blended with 4 parts of the base mix. The 40% CPL mix was 2 parts CPL blended with 4 parts of the base mix, and the 60% CPL mix was 3 parts CPL blended with 2 parts of the base mix.
The third step was to measure the dry matter bulk density, aeration porosity (AP), water holding capacity (WHC), and pot water capacity. The density of the four mixes was determined as the dry mass of material in a container with a calibrated volume. The AP and WHC were measured in the laboratory using a test chamber and procedure designed for this purpose (Chastain et al., 2023). The pot water capacity (g water/pot) was measured by filling 6, 6-inch pots with the same volume of each of the 4 mixes (24 pots total). The pots were brought to saturation and the water contained in the pots was measured. The pots were allowed to dry in the laboratory for 4 days and the mass of water in each pot was measured again. The complete details are provided by Chastain et al. (2023).
Table 1. Chemical and physical characteristics of the bark and composted poultry litter used to make the four potting mixes (mean of 3 reps). The moisture content of the sand used was 3.7%, the pH was 7.0, and the bulk density was 1.143 g DM/cm3.
Screened Pine Bark
(% d.b.)
Composted Poultry Litter
(% d.b.)
TAN (NH4-N + NH3-N)
0.00
0.00
Organic-N
0.33
0.96
Nitrate-N
0.00
0.12
Total-N
0.33
1.08
P2O5
0.12
2.45
K2O
0.22
0.82
Calcium
0.33
4.35
Magnesium
0.11
0.36
Sulfur
0.05
0.20
Zinc
0.004
0.02
Copper
0.001
0.02
Manganese
0.014
0.02
Sodium
0.023
0.15
Organic Matter
92.6
13.7
Carbon
52.4
9.94
C:N
161:1
9.2:1
EC5 (mmhos/cm)
2.56
0.71
pH
5.10
7.33
Moisture (%)
59.4
25.6
Density (g DM/cm3)
0.164
0.607
The final step involved calculating the concentrations of plant nutrients and other characteristics from the data shown in Table 1 as a weighted mean based on mass. These nutrient concentrations were converted to a volume basis (lb/yd3) using the mix bulk densities. The volumetric nutrient concentrations of the three CPL and base mix blends were compared with the range of nutrient concentrations that would result from mixing a 14-14-14 pellet fertilizer with the base mix at the rate of 3 to 8 lb per cubic yard.
What Have We Learned?
The results of mixing 20%, 40% and 60% CPL with the base mix on important properties of potting media are given in Table 2 along with target values from the literature. As the amount of composted litter (CPL) was increased the aeration porosity decreased from an unacceptable value of 30% for the base mix to 18% for the 20% CPL mix and 12% for the 60% CPL mix. The target range for water holding capacity is 45% to 65%. The highest WHC of 50% was for the 40% CPL mix followed by a WHC of 48% for the 20% CPL mix. The most limiting media characteristic appeared to be pH. The desirable range for media pH ranges from 5.5 to 6.4 depending on the plant to be grown. Based on the upper limit of this range, the highest amount of this compost product that would be recommended based on this study was 40%. Therefore, these results indicate that the amount of CPL that should be considered for most potting media would be in the range of 20% to 40% of the mix. The actual percentage of CPL that should be used will depend on the pH requirements of the plants to be grown. The pot water capacity results also showed that increasing the percentage of CPL in the mix increased the amount of water that would be held in a container at saturation and after 4 days of evaporation. If a media pH of 6.1 is suitable for the plant to be grown then these results suggest that the 40% CPL mix would be the best since it would provide an AP of 15%, a WHC of 50%, and an increase in pot water capacity of 20% at saturation and 29% following 4 days of evaporation with no irrigation. Using 40% CPL in a potting mix would also provide a 35% increase in dry bulk density which should reduce pot tipping in a production or retail nursery.
Table 2. Impact of adding composted poultry litter (CPL) to a bark-sand base mix on key potting media characteristics. The amount of CPL in the mix was 0%, (100% Base Mix), 20% (20% CPL), 40% (40% CPL), and 60% (60% CPL). AP is the aeration porosity, and WHC is the water holding capacity.
Media Property
100% Base Mix
20% CPL
40% CPL
60% CPL
AP (%) – Target: 10% to 20%
30
18
15
12
WHC (%) – Target: 45% to 65%
46
48
50
46
pH – Target: 5.5 to 6.4
5.3
5.7
6.1
6.5
Density (g DM/cm3)
0.31
0.37
0.42
0.47
Pot Water Capacity – at saturation (g/pot) A
390
420 (+8%)
468 (+20%)
523 (+34%)
Pot Water Capacity – after 4 days (g/pot) B
316
355 (+12%)
407 (+29%)
413 (+31%)
A The average mass of water contained in a 6-inch pot after adding enough water to bring the contents to saturation.
B The average mass of water contained in a 6-inch pot after allowing water to evaporate from the pots for 4 days.
The volumetric nutrient contents of the base mix, the fertilized base mix, and the 20% and 40% CPL mixes are compared in Table 3. The results for the 60% CPL mix were not included since the pH of 6.5 (Table 2) exceeded the upper value of the target range (pH = 6.4). Addition of the pellet fertilizer to the base mix and the 20% and 40% CPL mixes were able to reduce the C:N of the mix and change the plant available-N estimate from – 0.36 lb /yd3 to a positive value. That is, one of the goals of fertilizing a potting mix is to overcome the impact of nitrogen immobilization from the large amount of carbon in the pine bark. The actual target for plant available-N will vary with the plant to be grown. A similar result can be seen for the plant available P2O5. The base mix was not estimated to contain any useful P2O5. The addition of pellet fertilizer or using a CPL blend provided similar amounts of P-fertility. The two CPL mixes provided more K2O than the typical range of pellet fertilized mixes included in this study. The use of CPL instead of pellet fertilizer also added calcium, magnesium, sulfur, and other minor plant nutrients. The only elevated element that was undesirable was sodium. These results point out that potential minor nutrient toxicities (e.g. Mn, Zn) should also be considered when selecting the precise percentage of compost product to use in a potting mix.
Table 3. Comparison of the plant nutrients contained in the bark-sand base mix, fertilized base mix (3 to 8 lb slow-release fertilizer / cubic yard), and the 20% and 40% CPL mixes. The units are pounds of nutrient per cubic yard (lb/yd3)
Plant Nutrients
Base Mix
Fertilized
Base Mix
20% CPL
40% CPL
TAN (NH4-N + NH3-N)
0
0.28 to 0.69
0
0
Organic-N
0.81
0.80 to 0.81
2.61
4.41
Nitrate-N
0
0.20 to 0.49
0.24
0.48
Total-N
0.81
1.28 to 1.98
2.85
4.89
C:N
159:1
65:1 to 101:1
43:1
24:1
Plant Available-N A
– 0.36
0.29 to 1.09
0.19
0.70
P2O5
0.29
0.77 to 1.47
5.25
10.20
Plant Available P2O5B
0
0.47 to 1.17
0.42
1.63
Potash (K2O)
0.54
1.01 to 1.71
2.11
3.68
Calcium
0.82
0.82
9.56
18.3
Magnesium
0.27
0.27
0.95
1.62
Sulfur
0.11
0.11
0.50
0.89
Zinc
0.008
0.008
0.054
0.099
Copper
0.003
0.003
0.039
0.074
Manganese
0.034
0.034
0.072
0.111
Sodium
0.057
0.057
0.359
0.661
A Plant Available-N = m f CS [Org-N] + TAN + NO3-N, where m f CS = 0.139 – 0.0036 C:N, R2 = 0.84 (regression by Franklin et al., 2015, method given by Chastain et al., 2023).
P Plant Available P2O5 = PRf [P2O5] Potting MIX + [P2O5] Fertilizer, PRf = 0 for the base mix and blends with fertilizer and 0.40 for CPL. (data from Franklin et al., 2015, method given by Chastain et al., 2023).
The results of this study indicated that composted poultry litter can replace a significant portion or all the expensive, non-renewable ingredients that are currently used to improve the AP, and WHC of a potting mix. The additional water capacity per pot may also reduce irrigation frequency, but additional work is needed. Also, use of CPL in the range of 20% to 40% of the mix can eliminate or reduce the need for lime for pH adjustment and pellet fertilizer to provide common levels of potting mix fertilization. These results only apply directly to the compost product used in this study. A similar study using composted cow manure (Owino et al., 2024) showed similar positive results. However, that product could not be used to adjust AP and WHC and media fertility in the same way as the product used in this study. These studies (Chastain et al., 2023; Owino et al., 2024) are intended to be used as a guide to determine the best compost and base mix proportions based on analysis of the initial ingredients. The final choice concerning the amount of compost to use should be made after growing trial pots of the plant to be produced in a the most beneficial mix.
Future Plans
This information has been used to develop extension programs for poultry and livestock producers that manufacture compost or who are considering composting litter as a treatment option. The other target audience for this information is producers of container ornamentals. Additionally, plant specific trials would be helpful to communicate information concerning the use of compost products in container production. An easy-to-use program or spreadsheet that would allow comparison of potting mix characteristics based on laboratory analysis would allow producers to design one or two mixes that may meet the specific needs of their plants. This would greatly reduce the amount of time needed to test the most beneficial blends.
Authors
Presenting & corresponding author
John P. Chastain, Professor and Extension Agricultural Engineer, Clemson University, jchstn@clemson.edu
Additional authors
Hunter F. Massey, Principle Lecturer, Department of Agricultural Sciences; Tom O. Owino, Associate Professor, Department of Environmental Engineering and Earth Sciences, Clemson University
Additional Information
Chastain, J.P., Massey, H.F., Owino, T.O. 2023. Benefits of Adding Composted Poultry Litter to Soilless Potting Media for the Production of Woody Ornamentals. In: Barbosa, J.C., Silva, L.L., Rico, J.C., Coelho, D., Sousa, A., Silva, J.R.M., Baptista, F., Cruz, V.F., (Eds.) Proceedings of the XL CIOSTA and CIGR Section V International Conference: Sustainable Socio-Technical Transition of Farming Systems. Évora, Universidade de Évora, pp. 10-21, https://rdpc.uevora.pt/rdpc/handle/10174/35910.
Franklin, D., D. Bender-Ӧzenҫ, N. Ӧzenҫ, and M. Cabrera. 2015. Nitrogen mineralization and phosphorus release from composts and soil conditioners found in the southeastern United States. Soil Science Society of America Journal 79:1386-1395. doi:10.2136/sssaj2015.02.0077.
Owino. T.O., Chastain, J.P., Massey, H.F. 2024. Using Composted Cow Manure to Improve Nutrient Content, Aeration Porosity, and Water Retention of Pine Bark-Based Potting Media. In: Cavallo, E., Cheein, F.A., Marinello, F., Saҫilil, K., Muthukumarappan, K., Abhilash, P.C., (Eds.) 15th International Congress on Agricultural Mechanization and Energy in Agriculture ANKAgEng’2023, Lecture Notes in Civil Engineering, Springer Nature Switzerland, 458, pp. 240–261, https://doi.org/10.1007/978-3-031-51579-8_23.
Acknowledgements
This work was supported by the Confined Animal Manure Managers (CAMM) Program of Clemson University Extension. Composted poultry litter was supplied by Mr. Tim McCormick, and the pine bark was supplied by a manufacturer of soil amendments located in, Anderson, SC. Dr. R.F. Polomski, Associate Extension Specialist–Horticulture/Arboriculture at Clemson University, provided valuable assistance in selecting the ingredients for the base mix and provided valuable insight concerning woody ornamental production. Dr. K. Moore, retired director of the Agricultural Service Laboratory, directed the chemical analyses.
The authors are solely responsible for the content of these proceedings. The technical information does not necessarily reflect the official position of the sponsoring agencies or institutions represented by planning committee members, and inclusion and distribution herein does not constitute an endorsement of views expressed by the same. Printed materials included herein are not refereed publications. Citations should appear as follows. EXAMPLE: Authors. 2025. Title of presentation. Waste to Worth. Boise, ID. April 7-11, 2025. URL of this page. Accessed on: today’s date.
The forms of nitrogen contained in poultry litter are organic-N, ammonium-N, ammonia-N, and nitrate-N. One of the challenges in using poultry litter as a fertilizer substitute is making a good estimate of the plant available nitrogen (PAN). The value of PAN will depend on estimates of the amount of N that is lost to the air as ammonia following land application and the amount of organic-N that will be mineralized in the soil. The objectives of this workshop are to: (1) summarize organic-N mineralization data, (2) summarize the available data concerning ammonia loss following surface application of poultry litter, (3) review data concerning how fast ammonia is lost from a field to determine how quickly incorporation should be scheduled post-application, (4) provide means values from data to provide a practical guide for PAN calculations, and (5) compare the PAN estimates from the new method with current recommendation used by Clemson University Cooperative Extension.
What Did We Do?
Not all the nitrogen in poultry litter is available for plant use during the first growing season. The amount of N that can be used as a fertilizer substitute is the fraction of the organic-N (Org-N) that will be mineralized to ammonium-N following land application, the fraction of the ammonium-N (NH4-N) that is not lost as ammonia (NH3-N) and any nitrate-N (NO3-N) that is present in the litter. The recommended equation to estimate the plant available-N (PAN) is:
(1) PAN = mf Org-N + Af TAN + NO3-N (Evanylo, 2000; Chastain et al., 2001).
The amount of organic-N that will be mineralized depends on the organic-N content of the litter (lb Org-N/ton) and the mineralization factor, mf. The total ammoniacal-N (TAN) is usually reported on a litter analysis sheet as ammonium-N, but it is the sum of the ammonium-N and ammonia-N contained in the litter (TAN = NH4-N + NH3-N). It is the ammonia part of TAN that can be lost to the air following broadcast application of litter. Loss of PAN as volatilized ammonia is of concern because it represents a loss of N that may be used for plant production, and it contributes to air pollution. The amount of TAN that remains contributes to the estimate of PAN and is described by an availability factor, Af. The value of Af is the percentage of TAN lost as ammonia (AL) following application of litter is calculated as Af = 1 – (AL/100) where the value of AL is obtained from field measurements. Poultry litter generally only contains very small amounts of nitrate-N (1 to 5 lb NO3-N/ton) and all of it counts toward PAN.
Several publications have reported measurements of the mineralization factor, mf, for a variety of manure types. A summary of the literature was provided by Evanylo (2000) and the practical range of values for poultry litter are compared with other types of manure in Table 1. In South Carolina, an mf of 0.60 has shown to work well in practice. However, in cooler climates the best value may be 0.50 since low soil temperatures generally slow the mineralization rate. Other factors such as soil pH, and moisture content can result in variation in the amount of organic-N that will actually be mineralized in a particular field. The values shown in the table are good recommendations for practical use unless a better value is available for a particular state or region. Some organizations (e.g. Clemson University Extension) use a single value of mf for manure from all types of animals. However, the available data indicates that the value of mf to be used in equation 1 should vary with animal type.
Table 1. Mineralization factors (mf) for common types of animal manure (Evanylo, 2000; Chastain et al., 2001).
Recommended mineralization factors
Poultry
0.60 (0.50 to 0.70)
Swine
0.45 (0.40 to 0.50)
Dairy
0.35 (0.25 to 0.35)
Beef
0.40 (0.30 to 0.45)
Several studies and literature reviews provided data concerning the maximum amount of ammonia that was lost after applying poultry litter to hay or ryegrass fields (Lockyer et al., 1989; Marshall et al., 1998; Meisinger and Jokela, 2000; Nathan and Malzer, 1994; Montes, 2002). The theory and data contained in these publications indicated that the amount of ammonia that was lost from surface applied broiler and turkey litter was influenced by the pH of the litter, the pH of the soil or residue that was on the field at time of application, and the temperature. In general, it was shown that if the litter was applied to residue with a high pH (8+) the amount of ammonia lost following broadcast application was increased and if the pH of the residue was low (about 5, Montes, 2002) the amount of ammonia lost decreased. The air temperature on the day of application also influenced the amount of ammonia that was lost with an increase in temperature from 68 degrees to 85 degrees causing an increase in ammonia loss by a factor of about 2. The average maximum ammonia loss (AL) following broadcast of bedded poultry litter to a mowed grass field was determined to be 37% (n = 6, coefficient of variation = ± 19.7%) with a 95% confidence interval that ranged from 29% to 44%. Much less data was available concerning the amount of ammonia lost after application of bedding-free poultry litter. This type of litter is removed from high-rise layer buildings, manure below the roost areas in broiler breeder barns, and un-bedded litter removed from some broiler barns. The data indicated that less ammonia was lost as compared to bedded litter due to the lower pH of the material. The recommended estimate of AL for un-bedded litter is 28%. Therefore, the recommended values for Af to be used in equation 1 for broadcast application of litter during the cooler weather of spring and fall is 0.63 for bedded poultry litter (most broiler and turkey barns) and 0.72 for un-bedded litter. If litter is applied during summer, which is not common, the AL values were doubled based on theory and practical measurements and gave a summertime Af value of 0.26 for bedded litter and a summertime Af value of 0.44 for un-bedded litter.
A common recommendation to reduce ammonia loss after spreading poultry litter, or granular N fertilizer, is to incorporate the litter into the soil with a disk harrow on the same day or provide irrigation of more than 0.25 inches of water. Light disking has been shown to reduce ammonia loss significantly (Chastain et al., 2001; Pote and Meisinger, 2014). The resulting value of Af that has been recommended for use is 0.80 if litter is incorporated on the same day that it was spread. The key question is how much time can lapse between spreading litter and incorporation to get an Af of 0.80? The measurements provided by Montes (Montes, 2002; Montes and Chastain, 2005) indicated that 98% of the total ammonia loss occurred 24 hours after application and 70% of the total had already been lost to the air after 8 hours. The results provided by Montes along with the average maximum ammonia loss values from the literature were combined to provide the recommended Af values given in Table 2. These results indicate that if the goal of incorporation is to yield an Af of 0.80 the litter must be incorporated within 2 to 8 depending on the season of the year and whether the litter contained bedding.
Table 2. Recommended TAN availability factors, Af, for application of poultry litter with and without incorporation.
Bedded Litter
Un-Bedded Litter
Spring and Fall
Summer
Spring and Fall
Summer
Af
Af
Af
Af
Broadcast – no incorporation
0.63
0.26
0.72
0.44
Time lapse before incorporation
1 hour
0.95
0.90
0.96
0.92
2 hours
0.90
0.81
0.93
0.85
3 hours
0.87
0.73
0.90
0.80
4 hours
0.83
0.67
0.87
0.75
6 hours
0.78
0.56
0.83
0.67
8 hours
0.74
0.48
0.80
0.61
What Have We Learned?
The impact of the method to estimate PAN using the Af values developed from the literature (Table 2) is best demonstrated by a practical example using nitrogen concentrations obtained from a broiler barn with bedded litter. The nitrogen contents and the estimates of PAN based on the current Clemson Extension recommendation and the PAN estimates using the new information are compared in Table 3. For this litter analysis, the PAN estimate using the new recommendation was 6% larger indicating a small increase in useful N. It was assumed that the litter application rate would be based on an agronomic rate of 100 lb N/ac. The calculated application rates were rounded to the nearest ton/ac and gave 3 tons of litter per ac in both cases. The estimate of ammonia emissions per 100 acres was decreased from 1650 lb NO3-N/ac using the old values to 1221 lb NO3-N/ac based on the mean Af from the available data. These results indicate that the current Clemson Extension recommendations are under predicting the amount of PAN that could be used as an N-fertilizer substitute. The more significant impact is that the current recommendations over predict ammonia-N emissions by 26%.
Table 3. Comparison of the PAN estimates and the ammonia-N emissions per 100 acres using the current Clemson Extension recommendations and the new values of Af based on a review of the literature. The calculations are for bedded broiler litter that contains 42 lb Org-N/ton, 11 lb TAN/ton, 1.4 lb NO3-N/ton and spread to provide 100 lb of N/acre. Both litter application rates rounded to 3.0 tons/acre.
Clemson Extension Recommendation
New Recommendation Based on Tables 1 & 2
mf
0.60
0.60
Af
0.50
0.63
PAN estimate (equation 1) – lb PAN/ton
32
34
Percent difference
+6%
Litter Application Rate – tons/acre
3.0
3.0
Ammonia loss – lb NH3-N/100 ac
1650
1221
Percent difference
(-26%)
Future Plans
The immediate plans are to use these results to provide a more realistic estimate of PAN and ammonia emissions for poultry litter in South Carolina. These results can also be used by Extension Educators in other states and regions to revise estimates of PAN for their conditions. The method presented in this paper can also be used in the future as better estimates of mf and Af are empirically determined.
Authors
Presenting & corresponding author
John P. Chastain, Professor and Extension Agricultural Engineer, Clemson University, jchstn@clemson.edu
Additional Information
Chastain, J.P., J.J. Camberato, and P. Skewes. 2001. Poultry Manure Production and Nutrient Content. Chapter 3B in Confined Animal Manure Managers Certification Program Manual: Poultry Version, Clemson University Extension, Clemson SC, pp 3b-1 to 3b-17. https://www.clemson.edu/extension/camm/manuals/poultry/pch3b_00.pdf.
Lockyer, D., B. F. Pain, J. V. Klarenbeek. 1989. Ammonia Emissions from Cattle, Pig and Poultry Wastes Applied to Pasture. Environmental Pollution 56:19-30.
Marshall, S.B., C. W. Wood, L. C. Braun, M. L. Cabrera, M. D. Mullen, E. A. Guertal. 1998. Ammonia Volatilization from Tall Fescue Pastures Fertilized with Broiler Litter. Journal of Environmental Quality 27(5): 1125-1129.
Meisinger, J.J., W.E. Jokela. 2000. Ammonia Volatilization from Dairy and Poultry Manure. In: Managing Nutrients and Pathogens from Animal Agriculture (NRAES-130). 334-354. Ithaca, NY: NREAS, Cooperative Extension, Cornell University.
Nathan, M.V., G. L. Malzer. 1994. Dynamics of Ammonia Volatilization from Turkey Manure and Urea Applied to Soil. Journal of Environmental Quality 58(3): 985-990.
Montes, F. 2002. Ammonia Volatilization Resulting from Application of Liquid Swine Manure and Turkey Litter in Commercial Pine Plantations. MS Thesis, Clemson University, Clemson, SC.
Montes, F., J.P. Chastain, 2005. Ammonia Volatilization from Turkey Litter Application in a Pine Plantation in South Carolina. ASAE Paper No. 054077, St. Joesph, Mich.: ASABE.
Pote, D., J.J. Meisinger. 2014. Effect of Poultry Litter Application Method on Ammonia Volatilization from a Conservation Tillage System. Journal of Soil and Water Conservation 69(1):17-25.
Acknowledgements
This work was supported by the Confined Animal Manure Managers (CAMM) Program of Clemson University Extension.
The authors are solely responsible for the content of these proceedings. The technical information does not necessarily reflect the official position of the sponsoring agencies or institutions represented by planning committee members, and inclusion and distribution herein does not constitute an endorsement of views expressed by the same. Printed materials included herein are not refereed publications. Citations should appear as follows. EXAMPLE: Authors. 2025. Title of presentation. Waste to Worth. Boise, ID. April 7-11, 2025. URL of this page. Accessed on: today’s date.
Methane emissions from liquid manure storage systems contribute a significant portion of methane emissions from the US agricultural sector (EPA, 2024). There is a need for more farm-level methane emission values to guide decision-making activities within the dairy industry and by government agencies. Cost, time, and labor constraints are challenges related to on-farm methane emission measurements. There is a need for simpler emission measurement methods.
The purpose of this work was to investigate relationships between methane emission rates (MER) in a laboratory assay and commonly measured characteristics including total solids (TS), volatile solids (VS), ash, and total Kjeldahl nitrogen (TKN). The relationships were also examined in conjunction with storage type, season, manure type, and storage duration.
What Did We Do?
We collected dairy manure samples from manure storages at 27 farms in Minnesota and Wisconsin at 2 to 4-month intervals throughout 2024. These samples represented various storage types, storage durations, and manure temperatures. To date, a majority of these samples have been processed for TS, VS, Ash, and TKN using standard methods for manure chemical analyses (American Water Works Association, 2017; Wilson et al., 2022). Additionally, MER were estimated in triplicate with a 3-day in vitro assay (Andersen et al., 2015). Relationships between MER and these manure chemical constituents were examined using Spearman correlation analysis and bivariate plots across all manure samples and with respect to other manure management characteristics. These include storage type, season, manure type, and storage duration. Manure chemical constituents were treated as numerical data whereas storage characteristics were treated as categorical data in the analysis. It is important to note that many samples may only have a partial set of manure analyses completed at this point. This resulted in varying counts of available samples used in the statistical analyses below (Table 1-3). Summary statistics (mean, median, range) are also presented for the different manure chemical constituents.
What Have We Learned?
Table 1 shows summary statistics of dairy manure samples processed for this work (wet basis). There was a wide range of concentrations observed for each manure chemical constituent; however, average values were comparable to American Society of Agricultural and Biological Engineers (ASABE) manure characteristics values (ASABE, 2019).
Table 1: Summary statistics of dairy manure chemical characteristics (% wet basis) (n = 148 for TKN, n = 155 for other manure constituents)
Mean
Median
Min
Max
TS
5.92%
4.98%
0.53%
17.89%
VS
4.39%
3.50%
0.27%
16.60%
Ash
1.53%
1.21%
0.26%
11.12%
TKN
0.31%
0.29%
0.08%
0.83%
Generally, overall correlations (Table 2) and correlations within categories (Table 3) were not strong, however there were some exceptions. These exceptions were observed in TS and VS relationships with MER for flush water and long-term storage duration (Table 3). Here, both positive and negative correlations that were at least moderately strong (rs ≥ |0.5|) were observed. Since methane emissions are a product of organic matter degradation, positive correlations between VS and MER were expected, but not always reflected in the results. Other trends in relationships between other manure constituents and MER are not well understood. However, manure management factors may also influence other microbial activity with respect to TS, Ash, and TKN content, which may have indirect effects on MER that cannot be discerned from a correlative relationship.
Additionally, given the wide range in the concentrations of all manure constituents and MER, it may be difficult to distinguish these relationships when comparing across the aggregate values. Instances where the strongest correlations were observed (Table 3) describe samples from a single farm, which suggests conducting a similar analysis within individual farms to better understand these relationships.
Table 2: Overall Spearman correlation values (rs) between manure constituents and MER
Total solids
Volatile solids
Ash
Total Kjeldahl Nitrogen
MER
0.060
0.052
0.137
-0.046
Table 3: Spearman correlation values (rs) between manure constituents and MER by manure storage type, manure type, storage duration, and season
TS vs MER
VS vs MER
Ash vs MER
TKN vs MER
Manure storage type
Transfer pit (n = 169)
0.150
0.124
0.271
0.075
Underfloor pit (n = 34)
-0.103
-0.121
-0.125
-0.153
Manure type
Raw manure (including bedding (n=36)
0.270
0.267
0.312
0.369
Raw manure (including bedding + others) (n = 140)
0.042
0.047
0.094
-0.093
Liquid separated manure (n =24)
-0.213
-0.297
-0.025
-0.156
Flush water (n = 9)
0.800
0.800
0.883
0.833
Storage duration
Short term (< 1 month) (n = 176)
0.082
0.090
0.117
-0.020
Long term (> 1 month) (n =6)
-0.771
-0.771
-0.143
-0.200
Point sample (not a storage) (n= 29)
0.029
-0.078
0.350
-0.136
Season
Winter (n= 23)
0.013
0.081
-0.011
0.132
Spring (n= 57)
0.406
0.399
0.411
0.238
Summer (n = 46)
-0.268
-0.291
-0.165
-0.436
Fall (n =66
-0.188
-0.198
-0.023
-0.011
Future Plans
We plan to conduct a stepwise regression analysis to better understand the significant independent variables (manure constituents) that influence MER. Correlations between manure constituents and MER using measurements from samples within individual farms will also be conducted.
Authors
Presenting author
Noelle Soriano, PhD candidate, University of Minnesota
Corresponding author
Erin Cortus, Associate Professor and Extension Engineer, University of Minnesota, Ecortus@umn.edu
Additional author
MaryGrace Erickson, Postdoctoral associate, University of Minnesota
Additional Information
Andersen, D. S., Van Weelden, M. B., Trabue, S. L., & Pepple, L. M. (2015). Lab-assay for estimating methane emissions from deep-pit swine manure storages. Journal of Environmental Management, 159, 18-26.
American Water Works Association. (2017). Standard Methods for the Examination of Water and Wastewater. American Water Works Association.
ASABE. (2019). Manure Production and Characteristics (ASAE D384.2). ASABE.
Wilson, M., Brimmer, R., Floren, J., Gunderson, L., Hicks, K., Hoerner, T., Lessl, J., Meinen, R. J., Miller, R. O., Mowrer, J., Porter, J., Spargo, J. T., Thayer, B., & Vocasek, F. (2022). Recommended Methods Manure Analysis (M. Wilson & S. Cortus, Eds.; 2nd ed.). University of Minnesota Libraries Publishing.
Acknowledgements
We are grateful to the farms that participated in this research for providing samples and for sharing their observations with us. We are also grateful to Kevin Bourgeault, Seth Heitman, Sabrina Mueller, and Jacob Olson for contributing to sampling and laboratory analysis.
This research is supported by through USDA NIFA Award 2023-68008-39859, and the Minnesota Rapid Agricultural Response Fund.
The authors are solely responsible for the content of these proceedings. The technical information does not necessarily reflect the official position of the sponsoring agencies or institutions represented by planning committee members, and inclusion and distribution herein does not constitute an endorsement of views expressed by the same. Printed materials included herein are not refereed publications. Citations should appear as follows. EXAMPLE: Authors. 2025. Title of presentation. Waste to Worth. Boise, ID. April 7-11, 2025. URL of this page. Accessed on: today’s date.
Methane (CH4) emissions from manure storage are a substantial contributor to the cradle-to-farmgate climate footprint for many dairy farms, especially for farms storing manure as liquid or slurry (Rotz et al., 2021). Dairy systems handle, treat, and store manure in various ways. In combination with environmental conditions, these differences in manure-related structures and processes potentially cause substantial farm-to-farm variability in CH4 production and intensity. However, few methods are available to estimate CH4 emissions specific to a manure storage or farm system.
To enable estimation of CH4 emission rate per unit of manure (methane emission rate, MER), research by Andersen et al. (2015) tested a laboratory assay on swine manure from deep pits. These authors showed that MER was related to manure chemical composition and varied across the year, with the highest values recorded in late fall. Our research aimed to build on Andersen et al. (2015) by testing dairy rather than swine manure to 1) compare MER across a variety of manure types, storage types, and typical storage durations, 2) examine seasonal differences in MER, and 3) quantify farm-to-farm and storage-to-storage variation in MER. Ultimately, we expected to illustrate how the MER laboratory assay could be used in estimating farm-specific CH4 emission rates from dairy manure storages.
What Did We Do?
We partnered with 27 dairies in the U.S. Upper Midwest with liquid and slurry manure storages. At approximately 2–4-month intervals throughout 2024, we collected composite samples (n = 208) representing various manure types, typical storage durations, and storage types. Most samples were whole manure (n = 165, 79%) or liquid separated manure (n = 34, 16%), with remaining samples representing flush water and digestate. Samples represented areas where manure was stored for short durations (≤1 mo.; n = 120, 58%) and long durations (>1 mo.; n = 88, 42%). Most long-term storage was unroofed, and most short-term storage was roofed. Samples represented transfer pits (n = 84, 40%), unroofed basins or pits (n = 67, 32%), and below-building pits (n = 30, 14%), among other storage types. Samples were distributed evenly across seasons for most farms, except that fewer samples were collected during winter due to outdoor storages freezing over.
For the MER assay, we incubated 75.06 ± 0.02 g (mean ± standard error) of manure at 72°F in triplicate 100 mL serum bottles for 2.99 ± 0.01 days. Then, we measured gas displacement with a syringe and headspace CH4 concentration with gas chromatography (Agilent 490 Micro GC, Agilent Technologies, Inc., Santa Clara, CA). We calculated MER as the average CH4 emission (mL) at 72°F per liter of manure per day. To examine differences due to manure type, typical storage duration, storage type, and season, we fit linear mixed models to log-transformed MER, then back-transformed model-implied means and standard errors. Additionally, we examined variance components attributable to individual storages and farms in relation to the residual variance. Storage-to-storage differences explained a small amount of total variance, so the random effect of storage was removed. Significance was declared at p<0.05.
What Have We Learned?
Across samples, the MER was highly variable and right-skewed (mean = 37, median = 21, standard deviation = 45 mL CH4 L-1 d-1; Figure 1), with a small fraction of extremely high values (maximum = 236 mL CH4 L-1 d-1). In contrast with our expectations, we found no effect of manure type, typical storage duration, and storage type on MER. Season influenced MER (F [3, 183.4] = 11.3, p < 0.001), with Fall samples exhibiting a larger MER compared with other seasons (Table 1). Larger MERs in Fall samples were driven by greater gas volume and CH4 concentrations in headspace; model-implied means of both variables nearly doubled in Fall compared with other seasons. Considering that all samples were incubated at the same temperature during the MER assay, greater MER during Fall may indicate that these samples had more abundant and active methanogen populations. Additionally, differences in chemical and physical properties of manure may have enhanced substrate availability for methanogenesis in Fall samples relative to other seasons.
Table 1. Results of a laboratory assay to estimate methane emission rate from dairy manure samples (n = 208) by incubating at 72°F in serum bottles for 3 days.
Model-Implied Mean (Confidence Interval)
Variable
Spring
Summer
Fall
Winter
Volume displacement, mL
14 (3, 25)
16 (4, 27)
26 (14, 37)
13 (0, 26)
Headspace methane, %
5 (3, 10)
8 (5, 16)
14 (8, 26)
6 (3, 12)
Methane emission rate,
mL CH4 L-1 d-1
13 (7, 25)
22 (11, 43)
41 (21, 79)
15 (7, 33)
Although our results illustrated that the mean MER was generally similar across categories of manure types, storage durations, and storage types, we found that between-farm differences accounted for 18% of the total variance in MER. In other words, samples from the same farm were correlated on average 0.18. This suggests that there are farm-to-farm differences in MER that were not explained by the predictors we considered as fixed effects.
Figure 1. Methane emission rates of samples (n = 208 points) showing the median and first and third quartiles (box) with whiskers 1.5 times the interquartile range.
Future Plans
In future work on this project, we plan to explore if between-farm differences in MER can be explained by other farm meta-data such as bedding type, manure removal frequency, storage volume, and surface area of manure. Additionally, we will explore relationships between manure chemical composition (total solids, volatile solids, total nitrogen) and MER. Similar to Andersen et al. (2015), we are examining the temperature sensitivity of methanogenesis in different sample types. In subsequent work, we may consider relating MER to other chemical constituents in manure samples related to substrate availability (e.g., fiber fractions) or fermentation end-products (e.g., volatile fatty acids).
Authors
Presenting author
MaryGrace Erickson, Postdoctoral Associate, University of Minnesota
Corresponding author
Erin Cortus, Associate Professor and Extension Engineer, University of Minnesota, ecortus@umn.edu
Additional author
Noelle Cielito Soriano, Ph.D. Candidate, University of Minnesota
Additional Information
Andersen, D. S., Van Weelden, M. B., Trabue, S. L., & Pepple, L. M. (2015). Lab-assay for estimating methane emissions from deep-pit swine manure storages. Journal of Environmental Management, 159, 18–26. https://doi.org/10.1016/j.jenvman.2015.05.003
Rotz, A., Stout, R., Leytem, A., Feyereisen, G., Waldrip, H., Thoma, G., Holly, M., Bjorneberg, D., Baker, J., Vadas, P., & Kleinman, P. (2021). Environmental assessment of United States dairy farms. Journal of Cleaner Production, 315, 128153. https://doi.org/10.1016/j.jclepro.2021.128153
Acknowledgements
We thank the farms who participated in this research for providing samples and data. Additionally, we are grateful to Kevin Bourgeault, Seth Heitman, Sabrina Mueller, and Jacob Olson for contributing to sampling and laboratory analysis. This research is supported by USDA NIFA Award 2023-68008-39859, and the Minnesota Rapid Agricultural Response Fund.
The authors are solely responsible for the content of these proceedings. The technical information does not necessarily reflect the official position of the sponsoring agencies or institutions represented by planning committee members, and inclusion and distribution herein does not constitute an endorsement of views expressed by the same. Printed materials included herein are not refereed publications. Citations should appear as follows. EXAMPLE: Authors. 2025. Title of presentation. Waste to Worth. Boise, ID. April 7-11, 2025. URL of this page. Accessed on: today’s date.
According to the latest estimation of Food and Agriculture Organization of the United Nations, the global dairy cattle stocks reached over 265 million in 2019. The massive stocks of dairy cows excrete an enormous amount of manure, which is a huge burden to the environment if unproperly disposed of, thus necessitating proper manure treatment. As such, anaerobic digestion (AD) has been widely adopted as a practice to manage dairy cattle manure. Within the United States, digesters at dairy farms started to be widely constructed after 2000, and the number of these on-farm digesters in operation or under construction has increased to over 400 in 2024. During the AD treatment of dairy manure, the sulfate-reducing microorganisms are active under anaerobic conditions, therefore high levels of hydrogen sulfide (H₂S) are common in biogas because of the degradation and conversion of sulfur-bearing organics in feeding materials and sulfate-bearing minerals in bedding materials within the manure stream. As an extremely toxic gas with an acute rotten egg odor, H₂S is one of the leading causes of workplace gas inhalation deaths in the US according to the Bureau of Labor Statistics. In addition to the health risks, high H₂S levels can be also very corrosive to the equipment and infrastructure: long-term exposure to concentration of H₂S greater than 1 ppm reduces the lifespan of structural materials, equipment, and electronic devices inside the facilities. Therefore, it is an urgent task to mitigate the H₂S emissions in manure management.
Conventional H₂S removal technologies typically include two categories, namely ex-situ and in-situ. The ex-situ biogas cleaning technologies (e.g., biofilters, aqueous solutions, iron sponge, etc.) require a separate unit to house the facilities and are chemical- and energy-intensive. In-situ H₂S mitigation methods usually require less energy and chemical input as well as an easier operation. In our previous study which employed bio-electrochemical (BEC) treatment concurrently with AD of dairy manure, a H₂S removal efficiency of over 95% was successfully achieved, thus offering a very promising in-situ H₂S remediation method. Nonetheless, it was operated in a continuous mode with electrodes inserted into the digester, which would require significant modification of existing AD systems when scaled up. Therefore, developing new strategies that can advance the application of BEC H₂S remediation within the conventional AD system is critical.
What Did We Do?
Most large sized farms collect liquid manure and slurry in a reception pit (or transition pit) before manure is pumped to the anaerobic digesters. This pit is usually open to the air, thereby offering a great opportunity to integrate the BEC treatment in dairy manure management. In the present lab-scale study, a BEC unit was applied to pretreat the dairy manure collected from the transition pit. On the basis of our previous study, a combination of low carbon steel (LCS) anode and stainless-steel cathode was selected as the electrode pair. At the applied voltages of 1.0-2.5 V, the dairy manure was pretreated for 24 hours prior to AD tests. After the BEC pretreatment, the peak H₂S concentration in the biogas was reduced from approximately 6,000 ppm (in the control without BEC pretreatment) to below 420 ppm in the groups at the applied voltages over 1.5 V. The total H₂S removal efficiencies reached 48.9%, 89.1%, 98.5%, and 100% at 1.0 V, 1.5 V, 2.0 V, and 2.5 V, respectively, equivalent to the sulfide removal of 18.6, 33.4, 36.9, and 37.4 mg S²⁻/g wet dairy manure. Nonetheless, higher voltages did not trigger higher biogas production. Besides, due to the anodic oxidation that released some CO₂ and the precipitation of carbonate (e.g., CaCO₃) in BEC pretreatment, the CH₄ contents in the yielded biogas from BEC groups (64.5-65.6%) were all slightly higher than that from the control (63.4%). Moreover, it was noteworthy that the technical digestion time (T80) (i.e., the time needed to produce 80% of the maximal digester gas production) was shortened to 28.0-29.3 d in the BEC groups at 1.5-2.5 V as compared to 32.8 d in the control. This suggests that the BEC pretreatment can remarkably accelerate biogas production in addition to the H₂S remediation. Groups using non-sacrificial electrodes (e.g., graphite sheets and rods) were also established for the 24-h BEC pretreatment of dairy manure. However, in subsequent AD tests, a large quantity of gaseous H₂S was still emitted. The comparison between the groups with and without sacrificial LCS anodes indicates that the formation of insoluble ferrous sulfide (FeS) was the main route of sulfide removal, whereas the contribution of anodic sulfide oxidation to sulfate and elemental sulfur was relatively limited.
With all the selections and optimizations above, a pilot-scale electrochemical unit was accordingly designed and then installed and operated in the dairy manure pit in a local dairy farm in Minnesota for over two months (as shown in Fig. 1), and its effects in in-situ H₂S remediation in a real application scenario were documented. This pilot-scale BEC system reduced the headspace H₂S level from 1,808 ppb to 390 ppb with a removal efficiency of 78.4%.
Fig. 1 Pilot-scale BEC system installation and operation in dairy manure transition pit
What Have We Learned?
This lab-scale success as well as the pilot-scale implementation supports BEC as a promising method for integration into existing on-farm AD systems treating dairy manure. With its incorporation of a BEC unit into the open-air manure transition pit, the operation could be simplified to a large extent without the considerable modification of existing AD systems, whilst the H₂S remediation and the improvement in biogas production (in both CH₄ content and technical digestion time) could be simultaneously achieved at an optimum applied voltage. In summary, this proposed BEC system can successfully reduce the H₂S and improve the safety of a dairy farm during manure storage and treatment.
Future Plans
In our future research, we will further assess the sulfur distribution and microbial community changes after both lab-scale and pilot-scale BEC treatment and also optimize the BEC strategy to reduce anode consumption. Besides, a techno-economic analysis and a life cycle assessment are now under evaluation, based on the data obtained through both the lab-scale tests and the pilot-scale demonstration, to further explore the feasibility and applicability of a full-scale BEC system in a real dairy farm scenario.
Authors
Presenting author
Lingkan Ding, Researcher Pro 5, University of Minnesota
Corresponding author
Bo Hu, Professor, University of Minnesota, bhu@umn.edu
Acknowledgements
The authors greatly appreciate funding support from USDA NRCS Conservation Innovation Grant (NR213A750013G029) and the assistance of Dennis Haubenschild for on-site work on the farm.
The authors are solely responsible for the content of these proceedings. The technical information does not necessarily reflect the official position of the sponsoring agencies or institutions represented by planning committee members, and inclusion and distribution herein does not constitute an endorsement of views expressed by the same. Printed materials included herein are not refereed publications. Citations should appear as follows. EXAMPLE: Authors. 2025. Title of presentation. Waste to Worth. Boise, ID. April 7-11, 2025. URL of this page. Accessed on: today’s date.
Dairy manure was once considered a waste, but it can be transformed into a valuable resource. As demand for sustainable waste management grows, innovative ways for converting dairy manure are being actively researched to enhance both dairy productivity and environmental sustainability. One such method, hydrothermal carbonization (HTC), has recently garnered significant attention due to its ability to convert wet biomass into value-added products. HTC involves treating wet biomass, such as dairy manure with high water content, at moderate temperatures (180℃-250℃) and pressure. The outcome of HTC is hydrochar, a solid product with high carbon and nutrient content.
Hydrochar has strong potential as a means of soil amendment, carbon sequestration and/or biofuel. Our lab scale experiments showed that hydrochar retains more than 90% phosphorus (P) from dairy manure. For hydrochar production to become a viable technology for dairy farms, a continuous system is essential. Such a system would offer numerous benefits, including increased production, enhanced efficiency, and greater potential for commercialization. The purpose of this study is to design a pre-commercial conceptual process for the continuous production of hydrochar from dairy manure.
What Did We Do?
Manure management consists of collecting manure from the floor to utilize it in the best possible way. Most dairy farms treat manure through anaerobic digestion to produce energy, separate the solids for use as a bedding material, and/or apply directly to field applications. To explore alternative ways of handling the large quantities of manure in a quick chemical method and recycling nutrients back to the cropland, dairy manure is processed into P-rich hydrochar via an HTC process. Based on the results of our laboratory experiments, a conceptual process was developed, which is capable of treating dairy manure from a mid-size farm with 1,000 lactating cows and equates to 38,000 tons of manure per year with 8-10% solids. The process design includes engineering designing details of manure preparation and handling, feeding and discharge mechanisms, main equipment (such as HTC reactor and heat exchangers), heating and temperature controls, and schemes for post-HTC process wastewater (post-water) handling. Figure 1 is the schematic of the conceptual process with major process equipment, where the thick, black lines indicate the flow of dairy manure slurry containing solids, while the thin, blue lines represent the flow of post-processed water.
Firstly, dairy manure collected from the dairy barns (approx. 10% solids) is stored in a storage tank (T-101) before being pumped into the feeding tank (T-102), where it is heated to 167°F (75°C) by the recycled post-water from preheater I (E-201) through internal heating coils. The feeding tank is equipped with a marine-style impeller for agitation to maintain solid suspension. Two preheaters (E-201 and E-202) are used to further heat the slurry to the required HTC temperature before entering the reactor (R-301). Preheater I is a shell-and-tube heat exchanger to heat the slurry up to 320°F (160°C) by heat recovery using the hot post-water from post-water tank (T-304). Preheater II is a tubular electric heater and is to finish the last stage of heating to 437°F (225°C). A continuously stirred tank reactor (CSTR) with agitation is the main equipment to thermochemically process dairy manure into hydrochar. After a 30-minute retention time in the reactor, the resulting product mixture is collected in the receiving tank/separator (T-302). Then the hot post processed-water is separated from the solid (the wet hydrochar cake) and collected in a storage tank (T-304) before being used as a heating medium for heat recovery. The wet hydrochar cake coming out of decanter centrifuge (T-303) is dewatered through an air-drying unit (C-305) to a water content of 12% or less, which can be used directly for land applications or packaged and transported to other markets.
Figure 1 Schematic of the conceptual process with major process equipment.
What Have We Learned?
Continuous hydrochar production holds great potential for recycling phosphorus from dairy manure back into the cropland as a soil amendment and for sequestrating carbon back to the soil. The conceptual process represents a significant step towards practically promoting this alternative manure treatment technology and creating a value-added product for nutrient cycling. This process is capable of producing approximately 5 million pounds (2,300 metric tons) of air-dried hydrochar per year, a yield of about 60% of the solid matter from dairy manure, and with a phosphorus concentration of approx. 1.4 lb/100 lb. Hydrochar is hydrophobic and can be sufficiently dried by ambient air. The air dried hydrochar contains a moisture content of 12% or less (as low as 5% per laboratory results due to hydrochar’s hydrophobic characteristics) and is suitable for long term storage and/or distance transportation. Because the raw, wet dairy manure can be processed directly from the farm without any pretreatment, the HTC process offers a good possibility for a cost-effective waste management alternative while producing valuable hydrochar for phosphorus recycling.
Future Plans
Upon completing this continuous flow process design, we will conduct a techno-economic assessment (TEA) to provide insights into the system’s economic feasibility, cost structure, and profitability. The TEA study will also offer a better perspective on the economic viability, technical challenges, and potential profitability of adopting and investing in the continuous hydrochar production system from dairy manure for waste management and nutrient cycling.
Authors
Presenting author
Imran Hussain Mahdy, Graduate Student (Ph.D.), University of Idaho
Corresponding author
Brian He, Professor, University of Idaho, bhe@uidaho.edu
Acknowledgements
USDA AFRI, UADA NIFA and Idaho Agricultural Experiment Station are acknowledged for their financial support through Sustainable Agricultural Systems (SAS) program (Grant 2020-69012-31871), and hatch project of IDA0-1716 (Accession number1012741).
The authors are solely responsible for the content of these proceedings. The technical information does not necessarily reflect the official position of the sponsoring agencies or institutions represented by planning committee members, and inclusion and distribution herein does not constitute an endorsement of views expressed by the same. Printed materials included herein are not refereed publications. Citations should appear as follows. EXAMPLE: Authors. 2025. Title of presentation. Waste to Worth. Boise, ID. April 7–11, 2025. URL of this page. Accessed on: today’s date.
The overall objectives of this research are to investigate the design, implementation, and evaluation of a pilot-scale composting system for dairy manure. This composting system was developed because of the significant quantities of dairy manure produced in Idaho and the need to improve dairy compost quality while reducing air emissions during the composting process. This composting system provides the ability to simulate on-farm composting in Idaho while measuring and regulating key composting parameters, gas emissions, and implementing changes during operation.
What Did We Do?
This pilot-scale composting system was developed by adapting a home composter to simulate a mechanically turned windrow system. The composters were modified to include aeration control, air monitoring equipment (Gasmet), and measure key composting parameters throughout the process. Ten compost reactors were built, which allowed for several combinations of treatments and multiple replications. Each reactor is connected to a plenum with the capacity to interconnect several reactors or isolate each one and regulate airflows and chamber pressure. During the initial trial, two replications of each amendment: control, biochar, pumice, wood chips, and zeolites were evaluated. A follow-up trial will repeat the two replications per treatment, for a total of four replications. Modifications of the composting system during the trial addressed challenges with moisture control, odor, temperature regulation, air velocity, and compost balling.
Figures 1 and 2 define the blocking pattern and layout of the composting system for all ten compost reactors. The blocking pattern was generated for two primary reasons: Create replications for each treatment and compensate for a temperature differential between both ends of the research space caused by the cooling method in the greenhouse.
What Have We Learned?
We learned that the pilot-scale composting system can effectively simulate different types of on-farm composting methods, demonstrating its adaptability for research. During the composting trial, the aeration was regulated to simulate forced and natural airflow composting systems. The ability to continuously measure the headspace size confirmed a significant decrease in composting volume, as expected in a full sized composting system. The temperature monitoring showed we were able to reach thermophilic composting for the first two weeks of the trial and showed temperature increases at each turning event. These findings indicate that this system can be a valuable tool for developing more efficient on-farm dairy manure management practices at the pilot-scale.
Future Plans
The design and implementation of this composting system have only completed one trial run. The immediate next step is to complete another round of the compost trial. Each resulting compost mix with the corresponding amendment will be tested in a crop-testing greenhouse trial. The amount of compost, or any other products, handled by these reactors allows for further tests in the lab, at the pilot scale, or in a greenhouse.
In the short term and beyond the dairy manure trials, the reactor system will be tested for other processes, including different composting techniques and amendments. Other processes to be tested include soil amendments and their impact on air emissions, anaerobic digestion without mixing, emissions from diverse waste streams and amendment combinations, among others.
Authors
Presenting author
Anthony Scott Simerlink, Assistant Professor, Extension Educator – Power County, University of Idaho
Corresponding author
Mario E. de Haro-Martí, Professor, Extension Educator – Gooding County, University of Idaho, mdeharo@uidaho.edu
Acknowledgements
Funding for this project was provided by a USDA-NIFA Sustainable Agriculture Systems (SAS) grant #2020-69012-31871.
The authors are solely responsible for the content of these proceedings. The technical information does not necessarily reflect the official position of the sponsoring agencies or institutions represented by planning committee members, and inclusion and distribution herein does not constitute an endorsement of views expressed by the same. Printed materials included herein are not refereed publications. Citations should appear as follows. EXAMPLE: Authors. 2025. Title of presentation. Waste to Worth. Boise, ID. April 7–11, 2025. URL of this page. Accessed on: today’s date.
In Nebraska, approximately 117 out of nearly 550 groundwater-based community public water systems are required to conduct quarterly sampling due to elevated nitrate-N levels, with ten systems having already implemented costly treatment measures such as reverse osmosis to mitigate this issue. The intensive production of row crops under irrigation in the state are a primary reason for elevated nitrate concentrations in groundwater. However, the environmental impact of nitrate leaching from agricultural fields is not confined to Nebraska; it is a widespread issue across the US Midwest, where intensive crop production is prevalent.
Despite advances in N management stemming from studies comparing nitrogen fate and transport under synthetic versus manure fertilizers, cover crops versus no cover crops, and other practices, research indicates that when manure is applied following research-based best management practices (BMPs), the risk of nitrate leaching is significantly lower compared to when synthetic fertilizers are applied following BMPs. While individual practices such as cover cropping or manure application have been shown to reduce nitrate leaching, their combined effects on both nitrate leaching potential and crop productivity, particularly in corn (Zea mays L.) systems, have not been thoroughly studied. There remains a critical need to comprehensively evaluate implementation of BMPs that can reduce nitrogen losses to groundwater in Nebraska and utilize evidence-based research to motivate the implementation of BMPs.
This study was conducted to evaluate the effects of the integrated use of beef manure, woodchips, and cover crops on corn (Zea mays L.) productivity and nitrate leaching.
What Did We Do?
A two-year study was conducted on drip-irrigated land with a loamy sand soil having 0 to 2% slopes at UNL’s Haskell Agricultural Laboratory research site near Concord, Nebraska from 2022 to 2023. A total of 24 plots were established, each measuring 6.1 m x 30.48 m, and six treatments were randomly assigned to plots in a factorial combination of two fertilizer sources (manure and inorganic fertilizer), two cover crops (rye cover crop and no cover crop), and two carbon amendment treatments (woodchips of mixed species and no woodchips). Each year, all the plots received the same total N rate, equating to 30% of the total N application broadcasted at planting in the form of Agrotain coated urea, which was calculated using University of Nebraska’s N rate algorithm. The manure plots received the remaining N (70% of the total) in the form of beef manure at planting using a manure spreader. The inorganic plots received the remaining N in the form of UAN side-dressed at the V6 corn growth stage. Each year, inorganic fertilizer plots received additional P, S, and Zn at the time of planting to balance the amount of these nutrients supplied by the manure.
Data collected included:
Soil. Deep core soil samples up to 120 cm were collected before planting in the spring and after harvest each fall, divided into four depths of 30 cm increment, composited by depth within each plot, and stored in a cooler before being transported to the lab for analysis.
Crop. Plant growth parameters assessed at V10 (±1) stage included plant height, leaf chlorophyll, and canopy fullness. Grain yield, harvest index, nitrogen harvest index and partial factor productivity were determined at harvest.
Water. Concentration of NO3-N and NH4-N in the pore water below the root zone was measured one to two times each week throughout the growing season with the help of suction cup lysimeters, two of which were installed 6 m apart between the center two rows of each plot at a depth of 1.2 m.
Cover crop failed to establish in 2023 spring due to dry conditions, therefore, cover crop data and its effects are not reported in this paper.
What Have We Learned?
Key results of this study include:
Manure significantly reduced nitrate leaching by providing a slower, more synchronized N release compared to inorganic fertilizers.
Woodchip mulch initially delayed N availability and biomass N uptake but ultimately helped reduce nitrate leaching by improving soil moisture retention and temperature moderation.
Aboveground biomass N uptake was significantly affected by fertilizer source with manure improving biomass N uptake by 11% compared to inorganic fertilizer.
Inorganic fertilizers boosted corn yields by 9% compared to manure treatments, but increased the risk of nitrate leaching, highlighting a trade-off between productivity and environmental impact.
Integrated management of manure and mulch was deemed crucial for optimizing N use efficiency and minimizing environmental risks in irrigated corn systems.
Future Plans
Identifying nutrient and land management practices that support sustainable agricultural practices by safeguarding groundwater quality while maintaining farm productivity are critical to the future of agriculture. Future research is expected to focus on refining the practices used in this study to maximize their benefits, including other practices such as in-season nitrogen management, and assessing outcomes under varying environmental conditions and soil types. Nitrogen availability from manure is heavily influenced by environmental and soil conditions, so multi-year data from this site and others should help determine when in-season nitrogen supplementation with inorganic fertilizer is needed to offset nitrogen deficits caused by slow conversion of organic nitrogen.
Because of the failure of cover crops to thrive in this study, future research to assess multiple practices in combination should include a cover crop versus no cover crop treatment.
Combining crop productivity and nitrogen fate and transport data with measures of soil biological conditions may also help identify trends in biological characteristics that contribute significantly to factors like nitrogen conversion and plant nitrogen uptake.
Authors
Presenting & corresponding author
Amy Millmier Schmidt, Professor and Livestock Bioenvironmental Engineering Specialist, University of Nebraska-Lincoln, aschmidt@unl.edu
Additional authors
Swetabh Patel, Assistant Professor, University of Minnesota; Michael Kurtzhals, Graduate Research Assistant, University of Nebraska-Lincoln; Arshdeep Singh, Graduate Research Assistant, University of Nebraska-Lincoln; Leslie Johnson, Extension Educator, University of Nebraska-Lincoln; Javed Iqbal, Assistant Professor, University of Nebraska-Lincoln
This research was funded by USDA-NIFA Award No. 2022-68008-36509.
The authors extend their sincere gratitude to Logan Dana, Operations Manager at the UNL Haskell Ag Lab, for his role in supporting this project.
The authors are solely responsible for the content of these proceedings. The technical information does not necessarily reflect the official position of the sponsoring agencies or institutions represented by planning committee members, and inclusion and distribution herein does not constitute an endorsement of views expressed by the same. Printed materials included herein are not refereed publications. Citations should appear as follows. EXAMPLE: Authors. 2025. Title of presentation. Waste to Worth. Boise, ID. April 7–11, 2025. URL of this page. Accessed on: today’s date.
Manage Cookie Consent
To provide the best experiences, we use technologies like cookies to store and/or access device information. Consenting to these technologies will allow us to process data such as browsing behavior or unique IDs on this site. Not consenting or withdrawing consent, may adversely affect certain features and functions.
Functional
Always active
The technical storage or access is strictly necessary for the legitimate purpose of enabling the use of a specific service explicitly requested by the subscriber or user, or for the sole purpose of carrying out the transmission of a communication over an electronic communications network.
Preferences
The technical storage or access is necessary for the legitimate purpose of storing preferences that are not requested by the subscriber or user.
Statistics
The technical storage or access that is used exclusively for statistical purposes.The technical storage or access that is used exclusively for anonymous statistical purposes. Without a subpoena, voluntary compliance on the part of your Internet Service Provider, or additional records from a third party, information stored or retrieved for this purpose alone cannot usually be used to identify you.
Marketing
The technical storage or access is required to create user profiles to send advertising, or to track the user on a website or across several websites for similar marketing purposes.