Land disposal of manure is a challenging environmental problem in areas with intense confined pig production. When manure is land applied at optimal nitrogen rates for crop growth, phosphorus can accumulate in excess of soil assimilative capacity because of the disproportion of nitrogen and phosphorus contents in animal manures relative to plant biomass. In turn, excess manure phosphorus lost through soil leaching or runoff has the potential to reach and pollute water resources. To reduce manure phosphorus losses into the environment, a substantial amount of phosphorus needs to be moved off the pig farm but transporting manure to phosphorus-deficit croplands becomes less cost effective with increasing distance from the pig farm. Yet, conservation and recovery of phosphorus is a concern in modern agriculture because of the high cost and possible insufficient supply of mined phosphates in the future. Thus, manure management in regions with intense animal production could benefit from new technologies that would recover manure phosphorus in a concentrated, usable form. This approach would make more economical the long distance transfers of manure phosphorus while reducing both agronomic phosphorus imbalances and adverse effects of soil P losses on water resources.
What did we do?
A patented treatment process, called “Quick Wash”, was developed for extraction and recovery of phosphorus from animal manure solids, but research has shown that the approach is equally effective with municipal biosolids. In the Quick Wash process, phosphorus is selectively extracted from pig manure solids by using mineral or organic acid solutions. Following, phosphorus is recovered by addition of liquid lime and an organic poly-electrolyte to the liquid extract to form a calcium-containing P precipitate. The quick wash process generates two products: 1) manure solids low in phosphorus; and 2) recovered phosphorus material.
What have we learned?
The Quick Wash process selectively extracts and recovers as much as 90 % of the phosphorus from pig manure solids while leaving most of the nitrogen in the washed manure solids. Consequently, the washed solid residue has a more balanced nitrogen and phosphorus composition for crop production and is environmentally safer for land application. The concentrated phosphorus product contains more than 90% of its phosphorus in plant available form for use as crop fertilizer. The inclusion of this process in a waste management system offers pig producers a new and welcomed opportunity to minimize phosphorus losses into the environment, while recovering and recycling phosphorus as a valuable product.
Future Plans
USDA granted an exclusive license of the invention to Renewable Nutrients, LLC (Pinehurst, NC). The Quick Wash is being commercialized by Renewable Nutrients, LLC for the municipal wastewater treatment sector and its partner TRIEA Technologies, LLC (Frederick, MD) for phosphorus recovery in the animal agriculture market.
Authors
Ariel A. Szogi, Research Soil Scientist, USDA-ARS Coastal Plains Soil, Water, and Plant Research Center, Florence, SC ariel.szogi@ars.usda.gov
Matias B. Vanotti, Patrick G. Hunt – USDA-ARS Coastal Plains Soil, Water, and Plant
Szogi, A.A., Vanotti, M.B., Hunt, P.G., 2014. Process for removing and recovering phosphorus from animal waste. U.S. Patent 8,673,046 B1. U.S. Patent and Trademark Office.
Acknowledgements
This work is part of USDA-ARS National Program 214: Agricultural and Industrial Byproducts; ARS Project 6657-13630-005-00D “Innovative Bioresource Management Technologies for Enhanced Environmental Quality and Value Optimization.”
The authors are solely responsible for the content of these proceedings. The technical information does not necessarily reflect the official position of the sponsoring agencies or institutions represented by planning committee members, and inclusion and distribution herein does not constitute an endorsement of views expressed by the same. Printed materials included herein are not refereed publications. Citations should appear as follows. EXAMPLE: Authors. 2015. Title of presentation. Waste to Worth: Spreading Science and Solutions. Seattle, WA. March 31-April 3, 2015. URL of this page. Accessed on: today’s date.
In the U.S., the first compost bedded loose housing (CBP) dairy barns were developed by Virginia dairy producers in the 1980’s to increase cow comfort and longevity. The key component of a CBP dairy barn is a large, open resting area generally bedded with sawdust or dry, fine wood shavings that is tilled to support aerobic composting. Studies in Minnesota in the early 2000’s built a knowledge base which researchers in Kentucky have utilized during the past 5 years as the foundation for our research and extension activities on the CBP barns, herds housed within them, and assessing compost fertility. CBP barns fit within goals of sustainable agriculture for dairies with less than 500 lactating cows because of benefits to the cow (space, rest, exercise, and social interaction – Videos 1 & 2), the farmer (low investment, labor-extensive, reduced manure storage costs with composted manure under roof), milk production (milk quality, milk yield), and the environment (reduced ammonia and greenhouse gas emissions, odor and dust emissions, reduced energy consumption, improved manure fertility and flexibility to meet nutrient management plans). Operator experiences and research results of completed and on-going CBP barn projects are presented.
What we did
Our first activity was to assess the existing CBP barns in KY to establish the reasons for success. Fifty-five known existing CBP dairy barns in KY were visited from September 2010 to March 2011 to determine the management, barn construction details and management factors that lead to successful operation and herd improvements. Five areas of research were subsequently identified. Critics have expressed concerns about mastitis risks in barns. Environmental mastitis has been the main concern due to the bacterial load in the CBP barn compost. A study was conducted of mastitis incidence and milk Somatic Cell Count (SCC) of CBP barns relative to “gold standard”, sand bedded free stall barns. Dairymen also wanted to have more certainty of the compost nutrient value for land application. A study was initiated to determine N and P in compost and their release for plant uptake during the first year. For one year, bed data for temperature, moisture, nutrient content by depth, and barn climate were collected to understand the seasonal climatic effects on the compost bed and how quickly these effects are seen. Finally, bed tillage, using cultivators or rototillers, was evaluated for effects on bed performance.
What we learned
Facility design, ventilation, timely addition of fresh, dry bedding, frequent and deep stirring, and avoidance of overcrowding are the keys to a good working CBP barn. Poor management may lead to very undesirable compost bed conditions, dirty cows, elevated SCC, and increased clinical mastitis incidence. Most Kentucky dairy producers listed increased cow comfort and welfare as the main benefit to the CBP barn system, while others cited increased cow cleanliness, low maintenance nature of the system, and the barn’s usefulness for special needs and problem cows. Evaluation of annual bed performance data led to development of new compost bed management strategies. Instead of using the hygiene score for cows or bed temperature, moisture content was viewed as the primary measure since it was a leading indicator of the bed before failure. The time between a good performing bed and a poor performing bed was a matter of days when the moisture content exceeds 60% – wb. The comparison of CBP barns to sand bedded freestall barns validated producers’ observations of comparable SCC and mastitis incidence prevalence in CBP barns. Finally, CBP compost added to soil differs in P dynamics depending on soil test P level. In Low Soil Test P (STP) soils the CBP tended to slowly mineralize, and like inorganic P fertilizers, was subject to adsorption. In High STP soil, P in compost was first adsorbed, but then slowly released with time.
Future plans
Computational Fluid Dynamics (CFD) modeling of the compost bed management and barn design alternatives for demonstration to dairymen for planned and existing facilities.
Effect of Rapid Eye Movement (REM) sleep on cow health, production and comfort.
Mastitis incidence as affected by microbial ecology of the cow udder and compost bedded pack.
Life Cycle Assessment (LCA) and economic analysis of system: milk production, barn, and compost disposal.
Authors
Joseph L Taraba, Extension Professor, Biosystems and Agricultural Engineering, University of Kentucky, Lexington KY – joseph.taraba@uky.edu. 859.218.4353.
Jeffery M Bewley, Associate Extension Professor, Animal Food Sciences, University of Kentucky, Lexington KY
George B Day, Adjunct Instructor, Biosystems and Agricultural Engineering, University of Kentucky, Lexington KY
Mark S Coyne, John H. Heick Professorship, Plant and Soil Sciences; University of Kentucky, Lexington KY
Michael Sama, Assistant Professor, Biosystems and Agricultural Engineering, University of Kentucky, Lexington KY
Randi A Black, PhD Graduate Student , Animal Sciences, University of Tennessee, Knoxville TN
Flavio A Damasceno, Professor (Associate), Departamento de Engenharia, Universidade Federal de Lavras, Lavras, MG – Brasil
Elizabeth A Eckelkamp, Graduate Research Assistant, Animal Food Sciences, University of Kentucky, Lexington KY
Leslie A Hammond, Graduate Research Assistant , Plant and Soil Sciences; University of Kentucky, Lexington KY
John Evans, Graduate Research Assistant, Biosystems and Agricultural Engineering, University of Kentucky, Lexington KY
The authors are solely responsible for the content of these proceedings. The technical information does not necessarily reflect the official position of the sponsoring agencies or institutions represented by planning committee members, and inclusion and distribution herein does not constitute an endorsement of views expressed by the same. Printed materials included herein are not refereed publications. Citations should appear as follows. EXAMPLE: Authors. 2015. Title of presentation. Waste to Worth: Spreading Science and Solutions. Seattle, WA. March 31-April 3, 2015. URL of this page. Accessed on: today’s date.
Determine the effects of moisture, temperature and within pen location on odorous emissions from pen surfaces generated from cattle fed a diet containing 30% wet distillers grain plus soluble (WDGS). This work is focused on developing precision practices for mitigating odor.
What did we do?
A laboratory study was conducted to determine effects of pen location, moisture, and temperature on emissions of volatile organic compounds (VOC). Feedlot surface material (FSM) was obtained from pens where cattle were fed a diet containing 30% wet distillers grain plus soluble (WDGS). The FSM were collected from the bunk, drainage, and mound areas within three feedlot pens. The FSM were mixed with water to represent dry, wet, or saturated conditions and then incubated at temperatures of 5, 15, 25 and 35ºC. A wind tunnel and TD GC/MS were used to quantify emissions of eight volatile fatty acids (VFA), five aromatics and two volatile sulfur compounds (VSC).
What have we learned?
Evaluation of emissions as affected by the specified environmental conditions was performed on individual compounds which were normalized using an odor activity value (OAV). When the odor compounds were normalized with respect to their activity value, many of the measured compounds contributed minimally to the overall odor activity. Approximately 10% of the OAV was contributed by three VFAs and one aromatic (4-methylphenol) compound. The VSC contributed the most with 87.3% of the total OAV.
More than half of the OAV occurred at the base of the mound with the bunk and drainage contributing approximately equally to the remainder. The frequent wetting and drying cycles occurring near the base of the mound may contribute to a more diverse microbial population when compared with the chronically wet to saturated conditions existing behind the feed bunk.
The addition of water significantly increased the OAV. Approximately 92% of the OAV was accounted for by wet and saturated conditions. In general, the addition of water decreased emissions of VFA and aromatics, and increased the emission of sulfides. Two possible causes were offered. First, the greater solubility of the VFA and aromatics allowed them to be retained in the solution fraction of the FSM and not be emitted. Second, the addition of water results in an anaerobic environment and reducing conditions, which are conducive to production of VSC.
Temperature significantly affected OAV with over 60% of the total OAV occurring at 35ºC. The 35ºC temperature increased each odor compounds with the impact being the greatest for VSCs. It appears from this study, odor emissions are greatest during warm (i.e. > 25ºC) wet periods and from specific location within the pen.
Future Plans
Understanding the spatial variability of odor emission is important in the development of cost-effective management practices. Based on the results from this investigation, field-scale studies will be conducted to develop precision odor mitigation practices.
Authors
Bryan L. Woodbury, Agricultural Engineer, USDA-ARS, U.S. Meat Animal Research Center, Clay Center, NE bryan.woodbury@ars.usda.gov
John E. Gilley, Agr. Eng, USDA-ARS. David B. Parker, Prof., Life, Earth and Environ. Sci., West Texas A&M University. David B. Marx, Prof, Statistics, Univ. of NE. Roger A. Eigenberg, Agr. Eng., USDA-ARS, U.S.
The authors are solely responsible for the content of these proceedings. The technical information does not necessarily reflect the official position of the sponsoring agencies or institutions represented by planning committee members, and inclusion and distribution herein does not constitute an endorsement of views expressed by the same. Printed materials included herein are not refereed publications. Citations should appear as follows. EXAMPLE: Authors. 2015. Title of presentation. Waste to Worth: Spreading Science and Solutions. Seattle, WA. March 31-April 3, 2015. URL of this page. Accessed on: today’s date.
Many malodorous compounds emitted from the feedlot surface of beef finishing facilities result from protein degradation of feces and urine (Mackie et al., 1998; Miller and Varel, 2001, 2002). The inclusion of wet distillers grain with solubles (WDGS) in beef finishing diets has been shown to increase nitrogen excretion (Spiehs and Varel, 2009; Hales et al., 2012) which can increase odorous compounds in waste (Spiehs and Varel, 2009). Zilpaterol hydrochloride (ZH) is a supplement fed to cattle for a short period of time (21 days) near the end of the finishing phase to improve efficiency of lean gain. Improvements in feed efficiency and lean tissue accretion potentially decrease nitrogen excretion from cattle. Therefore, the use of ZH in feedlot diets, especially those containing WDGS, may reduce the concentration of odorous compounds on the feedlot surface. The objective of this study was to determine if the addition of ZH to beef f inishing diets containing 0 or 30% WDGS would decrease odor and gas production from the feedlot surface.
What did we do?
Sixteen pens of cattle (25-28 cattle/pen) were used in a 2 x 2 factorial study. Factors included 0 or 30% WDGS inclusion and 0 or 84 mg/steer daily ZH for 21 d at the end of the finishing period. Each of the four following treatment combinations were fed to 4 pens of cattle: 1) finishing diet containing 0% WDGS and 0 mg ZH, 2) finishing diet containing 30% WDGS and 0 mg ZH, 3) finishing diet containing 0% WDGS and 84 mg/animal daily ZH and 4) finishing diet containing 30% WDGS and 84 mg/animal daily ZH. A minimum of 20 fresh fecal pads were collected from each feedlot pen on six occasions. Samples were mixed within pen and a sub-sample was placed in a small wind-tunnel. Duplicate samples for each pen were analyzed. Odorous volatile organic compounds were collected on sorbent tubes and analyzed for straight-chain fatty acids, branched-chain fatty acids, aromatic compounds, and sulfide compounds using a thermal desorption-gas chromatograph-mass spectrometry (Aglient Technologies, Inc, Santa Clara, CA). Ammonia (NH3) production was measured using a Model 17i Ammonia Analyzer (Thermo Scientific, Franklin, MA), and hydrogen sulfide (H2S) was measured using a Model 450i Hydrogen Sulfide Analyzer (Thermo Scientific, Franklin, MA).
What have we learned?
Inclusion of ZH in beef finishing diets was effective in lowering the concentration of total sulfides, total branched-chain fatty acids, and hydrogen sulfide from fresh cattle feces. Inclusion of 30% WDGS to beef feedlot diets increased the concentration of odorous aromatic compounds from feces. Ammonia concentration was not affected by the inclusion of either WDGS or ZH in the finishing diet. Producers may see a reduction in odorous emissions when ZH are fed to beef finishing cattle.
Future Plans
Additional research is planned to evaluate the use of β-agonists, such as ZH, with moderate and aggressive implant strategies. These implants may further improve feed efficiency and lean gain, thereby potentially reducing excess nutrient excretion and odorous emissions. Evaluation odorous emissions from the feedlot surface when ZH are fed is also needed.
Authors
Mindy J. Spiehs, USDA, ARS, U.S. Meat Animal Research Center, Clay Center, NE mindy.spiehs@ars.usda.gov
Kristin E. Hales, USDA, ARS, U.S. Meat Animal Research Center, Clay Center, NE
Additional information
Mention of trade names or commercial products in their article is solely for the purpose of providing specific information and does not imply recommendation or endorsement by the USDA. USDA is an equal opportunity provider and employer.
Literature cited
Hales, K. E., N. A. Cole, and J. C. MacDonald. 2012. Effects of corn processing method and dietary inclusion of wet distillers grains with solubles on energy metabolism, carbon-nitrogen balance, and methane emissions of cattle. J. Anim. Sci. 90:3174-3185.
Mackie, R. I., P. G. Stroot, and V. H. Varel. 1998. Biochemical identification and biological origin of key odor components in livestock waste. J. Anim. Sci. 76:1331-1342.\
Miller, D. N. and V. H. Varel. 2001. In vitro study of the biochemical origin and production limits of odorous compounds in cattle feedlots. J. Anim. Sci. 79:2949-2956.
Miller, D. N. and V. H. Varel. 2002. An in vitro study of manure composition on the biochemical origins, composition, and accumulation of odorous compounds in cattle feedlots . J. Anim. Sci. 80:2214-2222.
Spiehs, M. J. and V. H. Varel. 2009. Nutrient excretion and odorant production in manure from cattle fed corn wet distillers grains with solubles. J. Anim. Sci. 87:2977-2984.
Acknowledgements
The authors wish to thank Alan Kruger and Elaine Ven John for assistance with data collection.
The authors are solely responsible for the content of these proceedings. The technical information does not necessarily reflect the official position of the sponsoring agencies or institutions represented by planning committee members, and inclusion and distribution herein does not constitute an endorsement of views expressed by the same. Printed materials included herein are not refereed publications. Citations should appear as follows. EXAMPLE: Authors. 2015. Title of presentation. Waste to Worth: Spreading Science and Solutions. Seattle, WA. March 31-April 3, 2015. URL of this page. Accessed on: today’s date.
The Environmentally Friendly Farm program was developed by Penn State Equine Extension and is designed to recognize farms that adopt environmentally sound management practices that protect water quality and the environment. The program is supported by funds from the USDA Natural Resource Conservation Service (NRCS), Conservation Innovation Grant. Strategies are employed on Environmentally Friendly Farms to maintain productive pastures, reduce soil erosion, limit nutrient runoff from animal facilities and barnyards, safely store manure, recycle nutrients, and control animal access to surface waters. Excess sediment and nutrient runoff from manure poses health threats not only to the environment, but also to animals and people. Farm managers who practice environmental stewardship maintain healthy environments for their animals, their families, and their community.
What did we do?
Farm managers can apply for the program by request a copy of the application from Penn State Equine Extension by visiting us online at http://www.extension.psu.edu/equine, emailing or calling our extension office. Second, complete the Environmentally Friendly Farm application requesting background information about the farm operation.
Next, complete the Environmentally Friendly Farm Self-Assessment Checklist. Each statement is checked “yes” if the practice is in place on the farm, “no” if the practice is not in place or “non-applicable if the statement does not pertain to the farm operation. The checklist consists of a series of statements that identify potential on-farm practices in the following areas: Environmentally Sensitive Areas, Pastures, Animal Concentration Areas, Manure Storage, and Mechanical Manure Application.
Once the paperwork has been received, a farm site visit will be scheduled. Personnel from Penn State Extension, the County Conservation District, or the Natural Resource Conservation District (NRCS) will visit farms to verify that statements made in the application and checklists are accurate. At the same time, additional information and assistance will be provided to help improve farm management and develop any necessary plans for the farm.
The farm will be recognized by the public, conservation and agricultural agencies, and other farm managers as an operation that is committed to clean water and a healthy environment. Each farm manager will receive an Environmentally Friendly Farm sign that can be displayed on the farmstead. Farms that qualify will also be given permission to use the Environmentally Friendly Farm artwork on their website, brochure, and other marketing materials. Approved farms will be listed on the Penn State Equine Extension website.
This recognition will reflect the commitment of the farm manager to environmental stewardship and can serve as a marketing tool for the farm.
What have we learned?
After personnel visited farms to verify that statements made in the application and checklists are accurate. At the same time, additional information and assistance is provided to help improve farm management and develop any necessary plans for the farm. In addition, agency personal developed a personal relationship with the farm manager. The farm managers who practice environmental stewardship maintain healthy environments for their animals, their families, and their community.
Future Plans
This program will be continued through 2016. We hope to provide additional information and assistance to help improve farm management.
Donna Foulk, Helene McKernan, Pennsylvania State University, University Park, PA 16802
Additional information
Farms can request a copy of the application from the Penn State Extension Equine Team by visiting us online at http://www.extension.psu.edu/equine
Acknowledgements
This program was funded partly by a USDA NRCS-CIG grant.
The authors are solely responsible for the content of these proceedings. The technical information does not necessarily reflect the official position of the sponsoring agencies or institutions represented by planning committee members, and inclusion and distribution herein does not constitute an endorsement of views expressed by the same. Printed materials included herein are not refereed publications. Citations should appear as follows. EXAMPLE: Authors. 2015. Title of presentation. Waste to Worth: Spreading Science and Solutions. Seattle, WA. March 31-April 3, 2015. URL of this page. Accessed on: today’s date.
This project was started to work with regional CIG projects to calibrate and harmonize Phosphorus Indices across the U.S., demonstrate their accuracy in identifying the magnitude and extent of phosphorus loss risk, and provide suggestions to refine or improve existing Indices. This research is important to provide consistency among state Phosphorus Indices and their subsequent recommendations.
What did we do?
We will combine and compare results from each of the four regional and state Phosphorus Index CIG-funded projects, in order to synthesize, summarize, and describe the science-based information and lessons learned from the individual Phosphorus Index assessment projects (i.e., Chesapeake Bay Watershed, Heartland Region, Southern States and Ohio Lake Erie Basin) and build a harmonized framework that yields consistent Phosphorus-based risk assessment across the U.S. by doing this, we plan to ensure that the refinement of Phosphorus Indices is grounded in the best available science, reflects local environmental and agronomic conditions, anticipates impacts to water quality and farm management, and provides consistent recommendations within and across varied physiographic regions of the U.S.
What have we learned?
Despite the success of the Phosphorus Index concept in state-level nutrient management planning strategies as part of the NRCS 590 Standard, there remain concerns about the effectiveness of the Indexing approach for attaining water quality goals. Different versions of the Phosphorus Index have emerged to account for regional differences in soil types, land management, climate, physiographic and hydrologic controls, manure management strategies, and policy conditions. Along with this development, differences in Phosphorus Index manure management recommendations under relatively similar site conditions have also emerged. To date, we have learned that the individual projects with slightly differing objectives have shown there to be a paucity of field measured runoff, against which to reliably compare Index performance. Thus, several off-the shelf and pre-calibrated models (e.g., APEX) were tested to provide adequate phosphorus runoff information to validate Indices. Use of off-the-shelf models can provide unreliable estimates of phosphorus runoff, while calibrate models can provide more reliable estimates when given adequate site information.
Future Plans
It is planned to have extend the research for one more year to the end of 2016 to continue model assessment, compile field runoff databases, conduct statistical and uncertainty analyses, and compile cross project findings.
Authors
Andrew Sharpley, Distinguished Professor, Division of Agriculture University of Arkansas System sharpley@uark.edu
Deanna Osmond, Professor and Soil Science Department Extension Leader; David Radcliff, Professor; Peter Kleinman, Research Leader; Doug Beegle, Distinguished Professor of Agronomy; John Lory, Associate Professor of Extension; and Nathan Nelson, Professor.
Additional information
Sharpley, A.N., D. Beegle, C. Bolster, L. Good, B. Joern, Q. Ketterings, J. Lory, R. Mikkelsen, D. Osmond, and P. Vadas. 2011. Revision of the 590 Nutrient Management Standard: SERA-17 Recommendations. Southern Cooperative Series Bulletin No. 412. Published by SERA-IEG-17, Virginia Tech. University, Blacksburg, VA. Available at https://sera17dotorg.files.wordpress.com/2015/02/590-sera-17-recommendations.pdf 2011.
Sharpley, A.N., D. Beegle, C. Bolster, L. Good, B. Joern, Q. Ketterings, J. Lory, R. Mikkelsen, D. Osmond, and P. Vadas. 2011. Revision of the 590 Nutrient Management Standard: SERA-17 Supporting Documentation. Southern Cooperative Series Bulletin No. 412. Published by SERA-IEG-17, Virginia Tech. University, Blacksburg, VA. Available at https://sera17dotorg.files.wordpress.com/2015/02/590-sera-17-recommendations.pdf
Sharpley, A.N., D.G. Beegle, C. Bolster, L.W. Good, B. Joern, Q. Ketterings, J. Lory, R. Mikkelsen, D. Osmond, and P.A. Vadas. 2012. Phosphorus indices: Why we need to take stock of how we are doing. J. Environ. Qual. 41:1711-1718.
Osmond, D.L., A.N. Sharpley, C. Bolster, M. Cabrera, S. Feagley, B. Lee, C. Mitchell, R. Mylavarapu, L. Oldham, F. Walker, and H. Zhang. 2012. Comparing phosphorus indices from twelve southern USA states against monitored phosphorus loads from six prior southern studies. J. Environ. Qual. 41:1741-1750.
The authors are solely responsible for the content of these proceedings. The technical information does not necessarily reflect the official position of the sponsoring agencies or institutions represented by planning committee members, and inclusion and distribution herein does not constitute an endorsement of views expressed by the same. Printed materials included herein are not refereed publications. Citations should appear as follows. EXAMPLE: Authors. 2015. Title of presentation. Waste to Worth: Spreading Science and Solutions. Seattle, WA. March 31-April 3, 2015. URL of this page. Accessed on: today’s date.
Why Look at Environmental Practices of Horse Farms?
Equine farms are often small acreages that may not have ready access to technologies and information appropriate to their farms. Westendorf et al. (2010a) found that many equine farmers use extension services less than other sources of information, but they may use feed stores or neighbors for information (Table 1); Marriott et al. (2012) also found a limited understanding of available conservation resources among equine farmers. Best Management Practice (BMP) adoption on equine farms is the focus of this paper.
Table 1. Manure management information sources on equine farms (Total Respondents – 442)
Another Horse Farmer
Trade Magazines
Cooperative Extension
Other
Feed Dealer
Internet
Other Retailer
221
183
229
116
97
89
26
Westendorf et al. (2010a,b)
What did we do?
Equine farms generally dry stack their waste; in a NJ survey (Westendorf, et al. 2010b) over 70% of farms indicate storing manure on farm, many of these sites may lack BMP’s appropriate for a storage (Table 2, 3). Eighty-three percent in this survey had manure storages located greater than 61m from water or wetlands, and 86% had storages located greater than 61m from neighbors; this might indicate their storage does not pose a significant water quality or nuisance risk. Fiorellino et al. (2010) found that even with low levels of BMP adoption, most equine farms had a reduced water quality risk. Over 50% of NJ farmers indicate that they compost manure, but it is my observation that few actually do; the definition of compost may vary from mature compost to rotting decomposition. Seventy-five percent of farms bed with wood shavings, 25% with straw and the remainder with a combination of wood chips, wood pellets, and paper.
Table 2. Percentage of New Jersey equine survey farms implementing various management practices (%)
Spread manure on farm
Manure storage area
Compost horse manure
Off-farm manure disposal
Maintain and use dry lot areas
Credit manure as a fertilizer
Regular soil tests
Drag pastures regularly
Clean stalls daily
Manure storage <50 ft. from water
Manure storage >200 ft. from water
Manure storage <50gt. from neighbor
Manure storage >200 ft. from neighbor
54
74
47
58
47
39
32
75
70
1.1
83.2
1.1
86.4
Westendorf, et al. (2010b)
Table 3. Percentage of equine survey farms spreading or storing manure (%)
No. of horses
Spread Manure (n = 442)
Manure Storage (n = 434)
1 to 2
55.2
65.3
3 to 5
59.2
62.9
6 to 10
55.3
80.7
11 to 20
50.0
87.9
21 to 40
37.8
94.4
> 40
37.5
93.3
Westendorf, et al. (2010b)
Nearly 60% of horse farms dispose of some manure off the farm; for use as fertilizer, to a centralized composter, on-farm compost for sale, or to be given away are the prime means of disposal; unfortunately some is removed by dumpster. Fifty-four percent spread some manure on-farm, of these only 39% account for any fertilizer value. If we trust the survey, then probably only 20-25% of the farms have an understanding of the fertilizer value of manure; this survey did find a positive correlation between manure spreading and soil testing (P<.05), suggesting some understanding of soil fertility basics.
Fifty-three percent of farms had a sacrifice or exercise lot that provides horses an area for eating, drinking, shelter, and relaxing if needed. A sacrifice area can help to protect pasture and grazing areas. Many farms only have a turnout lot for both exercise and grazing; this can result in greater mud accumulation and other possible water quality concerns.
A feed management survey (Westendorf, et al. 2013) was sent to 500 NJ equine farmers (see Table 4). Forty-five percent received feeding and nutrition information from a feed store, 20% from a veterinarian, only 3% from a professional consultant and 2% from extension. Most farmers had no concept of feeding to reduce excretion of nutrients such as phosphorus. Monitoring intake, cleaning feed bunks and contaminated lots regularly, and disposing all waste feed in the manure storage are good recommendations for all producers. Please see the Williams et al. (2015) abstract in the poster session for more information about an on-farm feeding project.
Table 4. Description of how feeding decisions are made (%)
Balance diets on your own
Veterinarian advice
No plan at all
Feed store advice
Consulting nutritionist
Extension advice
45
20.5
15
14.5
3
2
Westendorf, et al. 2013
What have we learned?
In summary: 1. Many horse farms dispose some or all manure off-site; 2. Between 50 and 75% spread manure on crop or grazing land; 3. Most have at least a designated location for manure storage; 4. Larger farms are more likely to store manure. 5. Many farms have a low non-point source (NPS) pollution risk, but little understanding of BMP’s; and 6. Pasture management BMP’s are seldom applied.
Future Plans
Outreach should focus on the implementation of low-cost management practices that equine farmers are likely to adopt.
Author
Michael L. Westendorf, Extension Specialist in Animal Science, Rutgers, the State University of New Jersey westendorf@aesop.rutgers.edu
Reference
Fiorellino, N. M., J. M. McGrath, B. Momen, S. K. Kariuki, M. J. Calkins and A. O. Burk. 2014. Use of Best Management Practices and Pasture and Soil Quality on Maryland Horse Farms. J. Equine Vet. Sci. 34:257-264.
Westendorf, M. L., T. Joshua, S. J. Komar, C. Williams, and R. Govindasamy. 2010a. Effectiveness of Cooperative Extension Manure Management Programs. J. Equine Vet. Sci. 30:322-325.
Westendorf, M. L., T. Joshua, S. J. Komar, C. Williams, and R. Govindasamy. 2010b. Manure Management Practices on New Jersey Equine Farms. Prof. Anim. Sci. 26:123-129.
Westendorf, M. L., V. Puduri, C. Williams, T. Joshua, and R. Govindasamy. 2013. Dietary and Manure Management Practices on Equine Farms in Two New Jersey Watersheds. J. Equine Vet. Sci. 33:601-606.b
Acknowledgements
This work supported by the New Jersey State Equine Initiative, the Rutgers Equine Science Center, and the New Jersey State Department of Agriculture.
Special thanks to Troy Joshua, USDA-NASS, New Jersey for help in setting up some of the surveys.
The authors are solely responsible for the content of these proceedings. The technical information does not necessarily reflect the official position of the sponsoring agencies or institutions represented by planning committee members, and inclusion and distribution herein does not constitute an endorsement of views expressed by the same. Printed materials included herein are not refereed publications. Citations should appear as follows. EXAMPLE: Authors. 2015. Title of presentation. Waste to Worth: Spreading Science and Solutions. Seattle, WA. March 31-April 3, 2015. URL of this page. Accessed on: today’s date.
[Abstract] Subsurface manure application is theoretically susceptible to greater denitrification losses and nitrous oxide (N2O) emissions compared to surface application methods – primarily attributed to manure being placed in a more anaerobic environment. A review of field studies suggest N2O emissions typically range from 0.1% to 3% of total applied N from subsurface application methods, but there is considerable variation in emissions depending on pre- and post-application soil moisture conditions, readily-available carbon content in manure compared to background levels in soil, localized nitrogen form and oxygen concentration at the application site, and application depth. This paper will summarize peer-reviewed literature of field studies that quantify N2O emissions subsequent to subsurface manure application and identify the most prominent determining factors cited by authors.
Why Study Nitrous Oxide Emissions of Manure?
Ammonia abatement efficiencies of up to 90 percent have been documented with subsurface application and incorporation of animal manures compared to conventional surface application methods. While reducing ammonia emissions has positive implications for air and water quality, a portion of the nitrogen conserved may come at the expense of increased nitrous oxide emissions produced during denitrification and nitrification processes in the soil. As a greenhouse gas 300 times more potent than carbon dioxide at trapping heat, nitrous oxide has been linked to anthropogenic climate change and depletion of stratospheric ozone. Release of nitrous oxide from agriculturally-productive soils into the atmosphere also represents a loss of crop nutrients. Understanding the circumstances and manageable factors that contribute to nitrous oxide formation in soils subsequent to manure application is important for retaining crop nutrients and preventing greenhouse gas emissions.
What did we do?
A literature review was performed to investigate the factors that contribute to nitrous oxide emissions following subsurface application of animal manure to both grassland and arable land, compare results from different application techniques, and examine the conditions and circumstances that lead to nitrous oxide emissions.
What have we learned?
Several studies demonstrate significant increases in nitrous oxide emissions (from 0.1 to 3 percent) attributable to factors including increasing soil moisture content, high concentrations of readily-available carbon in manure substrate, increased nitrate concentration in soil, shallow application depth, high soil temperature, and ambient conditions during and immediately following application (table 1). Other studies show no difference in nitrous oxide emissions as compared to surface application methods. Reasons that subsurface application techniques will not necessarily result in greater nitrous oxide emissions were: 1) the length of the diffusion path from the site of denitrification to the soil surface may lead to a greater portion of denitrified nitrogen being emitted as nitrogen gas; 2) the soil moisture conditions and aeration level at the time of application may not be suitable for increased nitrous oxide production; 3) prior to manur e application, soils may already contain readily-metabolizable carbon and mineral nitrogen, thus any increase in nitrous oxide emission following application may not have a significant impact; and 4) weather events subsequent to manure application may effect soil moisture content and water-filled-pore-space, thereby affecting nitrous oxide emissions. Several studies document nitrous oxide emissions due to subsurface application methods (including manure incorporation and shallow injection) but research comparing nitrous oxide emissions from different subsurface application techniques and application depth is limited. Lack or absence of data in literature about manure chemistry, nitrogen application rates, application technique or method, as well as soil and atmospheric conditions during and after application made it more difficult to draw specific conclusions on factors affecting nitrous oxide emissions from subsurface-applied manure.
Further research is needed to determine the environmental and economic tradeoffs of implementing subsurface manure application methods for abatement of NH3 considering different future greenhouse gas emissions and market scenarios. Recent work suggests a link between denitrifier community density, organic C, and N2O emissions. Characterization of these biological mechanisms and identification of genetic markers for key enzymes should continue, particularly with respect to various subsurface manure application techniques, different manure types and N application rates, soil types, environmental conditions, and soil chemistry. Subsurface application depth plays an important role in determining the proportion of N2O to N2 emitted during denitrification; however, the number of field studies that examine the impact of application depth is limited. More research is needed to determine optimal manure application depth as influenced by soil type, soil chemistry, timing of application, and vegetative cover. Finally, future research on subsurface manure application will allow existing and future prediction models to improve estimation of annual N2O emissions at landscape scale and airshed levels. Refinement of greenhouse gas inventories, including N2O emissions from agricultural production systems, will assist agriculture producers, scientists, and policy makers in making informed decisions on greenhouse gas emission mitigation.
Future Plans
Future agricultural greenhouse gas regulations and/or carbon market incentives have potential implications for agricultural producers, including the method and timing of manure application. Controlled, replicated, and well-documented research on subsurface manure application and subsequent nitrous oxide release is critical for estimating the costs and benefits of different manure application techniques.
Authors
David W. Smith, Extension Program Specialist, Texas A&M AgriLife Extension DWSmith@ag.tamu.edu
Dr. Saqib Mukhtar, Professor and Associate Department Head for Extension, Texas A&M AgriLife Extension
Additional information
The publication ‘Estimation and Attribution of Nitrous Oxide Emissions Following Subsurface Application of Animal Manure: A Review’ has been accepted for publication in Transactions of the ASABE.
Acknowledgements
Funding for this effort provided by USDA-NIFA grant No. 2011-67003-30206.
The authors are solely responsible for the content of these proceedings. The technical information does not necessarily reflect the official position of the sponsoring agencies or institutions represented by planning committee members, and inclusion and distribution herein does not constitute an endorsement of views expressed by the same. Printed materials included herein are not refereed publications. Citations should appear as follows. EXAMPLE: Authors. 2015. Title of presentation. Waste to Worth: Spreading Science and Solutions. Seattle, WA. March 31-April 3, 2015. URL of this page. Accessed on: today’s date.
Why Study the Impacts of Poultry Litter on Phosphorus Cycling?
Livestock manures, including poultry litter, are often applied to soil as crop fertilizer or as a disposal mechanism near livestock housing. Manures can improve soil quality and fertility; however, over-application can result in negative environmental consequences, such as eutrophication of surface waters following runoff of soluble or particulate-associate phosphorus (P). In soil, P exists in many forms (inorganic/organic, labile/stable) and the fate of manure P is highly dependent upon soil properties, including soil texture and microbial activity. The Houston Black series is a calcareous (~17% calcium carbonate), high-clay soil that occupies roughly 12.6 million acres in east-central Texas. These Blackland vertizols are agronomically important for the production of cotton, corn, hay, and other crops, but their high calcium and clay content could lead to accumulation of P in forms that are not readily available for plant utilization. Accumulated P could serve as a source of legacy P if mineralized or otherwise transformed in situ or transported with soil particles in runoff.
Very few studies have investigated the long-term effects of manure or litter application on soil P distribution: almost no data exist on manure impacts on calcium-associated organic P in soil. Sequential fractionation techniques, coupled with phosphatase hydrolysis, have allowed for greater understanding of manure/litter effects on soil P distribution and transformation. A fairly standardized designation is separation of extracted P into labile P (H2O- and NaHCO3-P), moderately labile P (NaOH-P; assumed to be associated with amorphous Al/Fe oxides and organic matter), and stable P (HCl-P; assumed to be Ca-associated phosphates). Incubation of the extracted fractions with excess P hydrolyzing enzymes enables further characterization of organic P as phosphomonoester-like, nucleotide-like, phytate-like, or non-hydrolyzable organic P.
The specific objectives of this study were to investigate effects of long-term poultry litter application and land-use type (cultivated, grazed/ungrazed improved pasture, native rangeland) on soil P distribution in watershed-scale plots. The goal of this work is an improved understanding of how litter impacts P cycling and availability in these agronomically important calcareous soils.
What did we do?
We evaluated the effect of long-term (> 10 years) poultry litter (broiler and turkey litter) application at rates of 4.5, 6.7, 9.0, 11.2, and 13.4 Mg/ha (wet weight) on P distribution in cultivated (4.0 to 7.4 ha) and pasture (1.2 to 8.0 ha) watersheds near Riesel, Texas. The experiment was initiated in 2000 by the USDA-ARS Grassland Soil and Water Research Laboratory in Temple, Texas (Harmel et al., 2004), where cultivated fields were in a 3-year corn-corn-wheat rotation and received an annual application of poultry litter at predetermined rates. Litter was incorporated into cultivated plots with a disk or field cultivator. Improved pastures received surface-application of litter. Control treatments (no litter application) included cultivated, native rangeland, and grazed improved pasture.
Soil samples were collected from each watershed and subjected to sequential fractionation with water (H2O), sodium bicarbonate (0.5 M NaHCO3), sodium hydroxide (0.1 M NaOH), and hydrochloric acid (1.0 M HCl) (He et al., 2006; Waldrip-Dail et al., 2009). Total P in the extracts was determined by inductively coupled optical-emission plasma spectroscopy. Inorganic P was determined colorimetrically using a modified molybdenum blue method (He and Honeycutt, 2005). Concentrations of organic P forms (monoester-, DNA- phytate-like, and non-hydrolyzable organic P) were determined following enymatic hydrolysis with acid phosphomonoesterases and nuclease P1 (He and Honeycutt, 2001; He et al., 2003, 2004).
What have we learned?
This research clearly showed that use of poultry litter as a nutrient source for both cultivated and pasture watersheds increased concentrations of total P in all extractable fractions, especially at high litter application rates (Figure 1).
The majority of the total extractable P was found in the fractions that are associated with calcium in the soil (HCl and NaHCO3). An average of 68% of total P was extractable with HCl. However, differences were observed in extractable P distribution due to land-use type and litter application rate. In cultivated watersheds, the inorganic pools primarily affected were H2O- and NaHCO3-P, with some treatments having as much as four times more inorganic P in the labile pool compared with the stable pool. Whereas in the pastureland, increases in soil inorganic P were only found in pasture when either cattle was grazed or when poultry litter was applied at the highest rate.
The addition of litter increased all forms of labile, enzyme hydrolyzable organic P in cultivated plots, compared to plots that did not receive litter (Figure 2).
In cultivated fields, litter application significantly increased monoester-, DNA-, and phytate-like P; in contrast, only monoester-like P was increased in pasture, and phytate- and DNA-like P concentrations were actually lower in litter-amended pasture than native rangeland. The majority of the extractable organic P was non-hydrolyzable calcium-associated P (HCl-P), and this fraction was increased up to 217% by 10 years of poultry litter application. Thus, we concluded that repeated litter application increased levels of both soluble inorganic P and stable, non-hydrolyzable organic P, but specific response varied with application rate and management.
Future Plans
The fate of manure P in the environment is not yet well understood, and the fact that a large fraction of calcium-associated P was not accessible to the enzymes used in this study does not necessarily indicate that this fraction is not accessible to other soil phosphatases. Only very limited studies have been conducted on organic P in the HCl fraction, and more work is required to provide a clearer understanding of how this fraction interacts with soil minerals and organic matter. Results like this long-term study show the potential for high levels of accumulation of P that is not readily available for plant uptake and that could be transferred to surface or groundwaters. In addition, further applications of poultry litter, other livestock manure, or inorganic fertilizer, could lead to increased concentrations of labile P due to lack of available sorption sites in soil. Further study is warranted to evaluate the long-term effects on P distri bution and accumulation of legacy P following application of different manure types (e.g., beef and dairy cattle, swine) and on soils with contrasting physicochemical properties.
Paulo Pagliari, Univ. Minnesota; Zhongqi He, Research Chemist at USDA-ARS, New Orleans, LA; R. Daren Harmel, Agricultural Engineer at USDA-ARS, Temple, TX; N. Andy Cole, Animal Scientist at USDA-ARS, Bushland, TX; Mingchu Zhang, Univ. Alaska
Additional information
Heidi M. Waldrip, Research Chemist, USDA-ARS Conservation and Production Laboratory, PO Drawer 10, Bushland, TX 79012. Tel: 806-356-5764. email: heidi.waldrip@ars.usda.gov.
Harmel, R. D., H. A. Torbert, B. E. Haggard, R. Haney, and M. Dozier. 2004. Water quality impacts of converting to a poultry litter fertilization strategy. J. Environ. Qual. 33: 2229-2242.
References:
He, Z., T. S. Griffin, and C. W. Honeycutt. 2006. Soil phosphorus dynamics in response to dairy manure and inorganic fertilizer applications. Soil Sci. 171: 598-609.
He, Z., and C. W. Honeycutt. 2001. Enzymatic characterization of organic phosphorus in animal manure. J. Environ. Qual. 30: 1685-1692.
He, Z., and C. W. Honeycutt. 2005. A modified molybdenum blue method for orthophosphate determination suitable for investigating enzymatic hydrolysis of organic phosphates. Commun. Soil Sci. Plant Anal. 36: 1373-1385.
He, Z., C. W. Honeycutt, and T. S. Griffin. 2003. Enzymatic hydrolysis of organic phosphorus in extracts and resuspensions of swine manure and cattle manure. Biol. Fertil. Soils. 38: 78-83.
He, Z., T. S. Griffin, and C. W. Honeycutt. 2004. Enzymatic hydrolysis of organic phosphorus in swine manure and soils. J. Environ. Qual. 33: 367-372.
Waldrip-Dail, H., Z. He, M. S. Erich, and C. W. Honeycutt. 2009. Soil phosphorus dynamics in response to poultry manure amendment. Soil Sci. 174: 195-201
The authors are solely responsible for the content of these proceedings. The technical information does not necessarily reflect the official position of the sponsoring agencies or institutions represented by planning committee members, and inclusion and distribution herein does not constitute an endorsement of views expressed by the same. Printed materials included herein are not refereed publications. Citations should appear as follows. EXAMPLE: Authors. 2015. Title of presentation. Waste to Worth: Spreading Science and Solutions. Seattle, WA. March 31-April 3, 2015. URL of this page. Accessed on: today’s date.
Animal agriculture is a significant source of ammonia (NH3). Dairy cattle excrete most ingested nitrogen (N); most urinary N is converted to NH3, volatilized and lost to the atmosphere. This fugitive NH3 can contribute to negative environmental effects such as degraded air quality and excessive N in ecosystems. Open lot dairies on the southern High Plains are a growing industry and face challenges that include reporting requirements for NH3 emissions and potential regulation. However, producers and regulators lack a clear quantitative understanding of NH3 losses from the open lot production system.
What did we do?
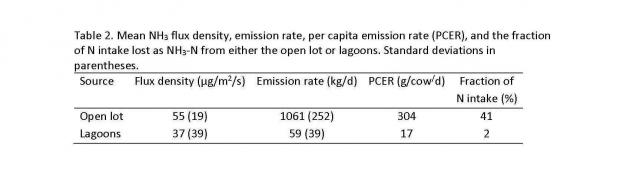
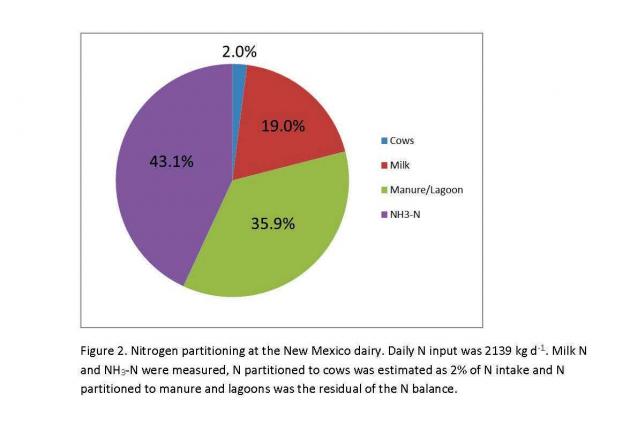
We quantified NH3 emissions from the open lot and wastewater lagoons of a typical open lot New Mexico dairy during two weeks in summer, 2009. The 3500-cow dairy consisted of open lot, manure-surfaced corrals (22.5 ha). A flush system using recycled water removed manure from the feed alley to three lagoons (1.8 ha). Most manure was retained on the corral surface. Open path lasers measured atmospheric NH3 concentration downwind from the open lot and lagoon sources, sonic anemometers characterized turbulence, and inverse dispersion analysis (Windtrax) was used to quantify emissions every 15 minutes (Fig. 1). A dairy N balance was constructed using measured and calculated values to partition N to different stores in the dairy system. Milking cows comprised 73% of the herd, with the remainder dry or fresh cow. Dry matter intake averaged 22.5 kg/cow/d, with a mean crude protein content of 16.7% (Table 1).
What have we learned?
Most NH3 loss was from the open lot. Ammonia emission rate averaged 1061 kg/d from the open lot and 59 kg/d from the lagoons; 95% of NH3 was emitted from the open lot (Table 2). The per capita NH3 emission rate was 304 g/cow/d from the open lot (41% of N intake) and 17 g/cow/d from lagoons (2% of N intake). Mean N intake was 612 g/cow/d and N exported in milk averaged 145 g/cow/d. The dairy N balance showed that most N was lost as NH3. Daily N input at the dairy was 2139 kg/d, with 43, 36, 19 and 2% of the N partitioned to NH3 emission, manure/lagoons, milk, and cows, respectively (Fig. 2). The NH3 production intensity was 13.7 g NH3/kg milk. We estimated that on an annual basis, from 30 to 35% of fed N would be lost as NH3. Ammonia loss from open lot dairies is more similar to that from open lot beef feedyards than from dairies with closed housing where manure is more intensively managed.
Future Plans
Next steps include sampling during additional seasons to better characterize annual emissions.
Corresponding author, title, and affiliation
Richard W. Todd, Research Soil Scientist at USDA ARS Conservation and Production Research Laboratory, Bushland TX
N. Andy Cole, Res. Animal Scientist at USDA ARS CPRL, Bushland, TX; G. Robert Hagevoort, Ext. Diary Specialist at New Mexico State University; Kenneth D. Casey, Air Quality Engineer and Brent W. Auvermann, Agricultural Engineer at Texas A&M AgriLife.
Additional information
For more information, contact Richard Todd, 806-356-5728.
Acknowledgements
Research was partially funded with a USDA NIFA Special Research Grant through the Southern Great Plains Dairy Consortium.
Table 1.
Figure 1.
The authors are solely responsible for the content of these proceedings. The technical information does not necessarily reflect the official position of the sponsoring agencies or institutions represented by planning committee members, and inclusion and distribution herein does not constitute an endorsement of views expressed by the same. Printed materials included herein are not refereed publications. Citations should appear as follows. EXAMPLE: Authors. 2015. Title of presentation. Waste to Worth: Spreading Science and Solutions. Seattle, WA. March 31-April 3, 2015. URL of this page. Accessed on: today’s date.
Manage Cookie Consent
To provide the best experiences, we use technologies like cookies to store and/or access device information. Consenting to these technologies will allow us to process data such as browsing behavior or unique IDs on this site. Not consenting or withdrawing consent, may adversely affect certain features and functions.
Functional
Always active
The technical storage or access is strictly necessary for the legitimate purpose of enabling the use of a specific service explicitly requested by the subscriber or user, or for the sole purpose of carrying out the transmission of a communication over an electronic communications network.
Preferences
The technical storage or access is necessary for the legitimate purpose of storing preferences that are not requested by the subscriber or user.
Statistics
The technical storage or access that is used exclusively for statistical purposes.The technical storage or access that is used exclusively for anonymous statistical purposes. Without a subpoena, voluntary compliance on the part of your Internet Service Provider, or additional records from a third party, information stored or retrieved for this purpose alone cannot usually be used to identify you.
Marketing
The technical storage or access is required to create user profiles to send advertising, or to track the user on a website or across several websites for similar marketing purposes.

 A patented treatment process, called “Quick Wash”, was developed for extraction and recovery of phosphorus from animal manure solids, but research has shown that the approach is equally effective with municipal biosolids. In the Quick Wash process, phosphorus is selectively extracted from pig manure solids by using mineral or organic acid solutions. Following, phosphorus is recovered by addition of liquid lime and an organic poly-electrolyte to the liquid extract to form a calcium-containing P precipitate. The quick wash process generates two products: 1) manure solids low in phosphorus; and 2) recovered phosphorus material.
 What have we learned?
 Purpose
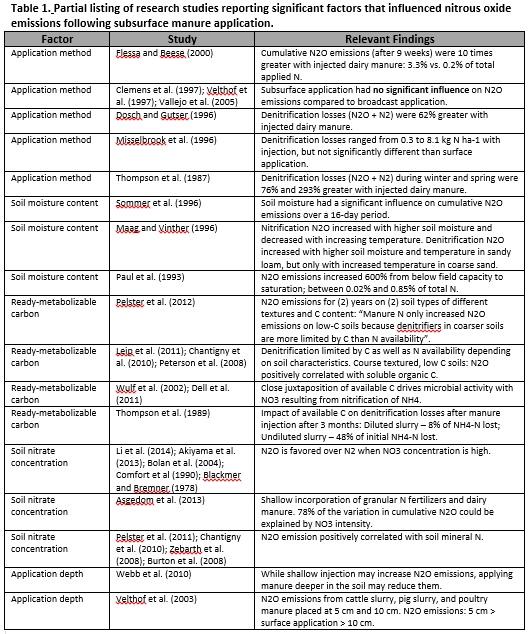


