PEDV Survivability in Swine Mortality Compost Piles


*Purpose

PEDv has caused significant losses in the Nebraska pork industry and mortality can approach 100%. Disposal of these carcasses is a challenge as they serve as a source of tremendous amounts of infectious virus. Current alternative methods of disposal include rendering, incineration and burial. Rendering trucks may serve as a farm-to-farm vector. Incineration is not feasible for the significant number of mortalities and burial may enable long-term survival of virus in soil and may cause re-infection after disease elimination. Therefore, composting may serve as an ideal solution for disposal and mortalities this would provide a biosecure, safe, and cost-effective method to mitigate on-farm sources of virus. The overall objective of this study was to determine the efficacy of composting as a mortality disposal method following death loss from the porcine epidemic diarrhea virus (PEDv). Validation of time-temperature combinations for PEDv inactivation in mortality compost piles was the primary intended outcome of this project.

What did we do?

PEDv virus challenge protocol modeled one that has shown previous success using weanling pigs (Hesse et al., 2013). Twenty-seven animals (approximately 21-day-old weaned piglets) were sourced from a high-health commercial source that had no history of PEDv and with dams that tested negative for the presence of PEDv-specific antibodies and were negative for fecal virus shedding as determined by PCR. Experimental groups were housed in pens and maintained at appropriate temperature and in accordance with national animal care space requirements. Pigs were given five days of acclimation and maintained on commercial nursery pig diets. Following acclimation, each pig was inoculated orally with 5 mL of virus inoculum (NE 9282) supplemented with gentamicin that had been diluted to a real time PCR assay cycle threshold (Ct) 22. Inocula (feces/intestinal contents) from a natural outbreak of PEDv were used. Pigs were evaluated twice daily for evidence of infection: temperature, pulse, respiration, dehydration, and diarrhea. Fecal samples were collected daily for evaluation of fecal shedding of PEDv. When significant clinical signs of enteric disease were present or pigs became sufficiently ill that the attending veterinarian determined euthanasia was appropriate, animals were humanely euthanized and samples taken for necropsy.

Following necropsy, carcasses from infected and euthanized pigs were composted inside biosecure rooms in the Veterinary and Biomedical Sciences Research Facility at the University of Nebraska – Lincoln. Three compost piles were constructed using commercial sawdust and wood shavings at a target moisture content of 50% w.b. For each pile, an insulated platform with internal dimensions of 121.92 cm (W) x 152.4 cm (L) (48 in x 60 in) was used to contain piles. Platforms were constructed of an outer layer of plywood and an inner layer of PolyBoard sheeting with foam board insulation in between to simulate the linear continuation of the pile and the insulative properties of a compacted soil base. Compost piles were constructed by placing a layer of wood shavings on each base to a depth of 60 cm (24 in), followed by placement of five carcasses in a single layer in the center of the pile followed by a 15 cm (6 in) layer of pile material and a second layer of four carcasses in a single layer. Additional sawdust was placed over and around the carcasses to achieve 60 cm of coverage on the top of the pile. Rooms were maintained at approximately 21°C (70°F) and 25% RH throughout the duration of the project.

Temperature was monitored at ten locations within each pile using Apresys in-transit digital temperature recorders (Apresys, Inc., Duluth, GA) beginning at establishment of the piles and continuing at a 20-min sampling frequency (duration of primary compost cycle not established at time of proceedings submission). Temperature within each pile was also monitored manually using a thermometer at 0, 24, 48, 96 h, and 168 h, and then weekly for the duration of the compost cycle to confirm success of the heating process.

Following completion of the primary compost cycle, temperature loggers will be recovered and each pile will be mixed, sampled for analysis of survivability of PEDv at five locations, moisture will be added, and piles will be re-established for a secondary composting cycle with temperature loggers placed as previously described. At the completion of the secondary composting cycle, piles will again be sampled for analysis of survivability of PEDv (5 samples per pile) and temperature loggers will be recovered.

PEDv survivability will be determined via two independent assay methods. Reverse transcription quantitative polymerase chain reaction (RT-qPCR) is a rapid and sensitive method that will be used to quantify the amount of virus RNA genome in the samples. The Nebraska Veterinary Diagnostic Center currently has a validated RT-qPCR test to assay for the presence of PEDv in manure sample matrices. To validate results from the RT-qPCR in laboratory assays, sawdust simulated compost matrix will be spiked with known concentrations of PEDv target RNA and compared to known standards to ensure no inhibition is present and that proper extraction methods are being used. An alternative method using virus isolation will also be conducted to determine whether viable virus is present in flasks at a smaller subset of time points. To do this, Vero cell monolayers will be infected with filter sterilized aliquots of compost exudate, blindly passaged once after seven days, and examined for virus p resence using IFA with a PED specific monoclonal antibody. At specific time points, RT-qPCR Ct values and Virus Isolation will be run in parallel to ensure sensitivity of testing and to evaluate correlation of the testing modalities under the simulated testing conditions and matrices. If these testing methods show agreement, and/or no virus is isolated, RT-qPCR testing will be utilized to facilitate rapid and consistent assessment of virus persistence during the majority of experimental time points.

What have we learned?

Biosecurity is essential to controlling the spread of PEDv and any facility that is currently positive for PEDv should work diligently to prevent contamination of neighboring facilities. Vehicle transport has been shown as a high-risk activity that may facilitate spread of PEDv (Lowe 2014) and mortalities that are positive for PEDv may be rejected by renderers to protect them from liability for transmitting the disease. Burial of mortalities can be detrimental to water quality (Bartelt-Hunt et al., 2013) and it is unknown how long the PEDv can remain active in the cool, dark, moist environment that accompanies land burial of carcasses, but extrapolation of available data suggests virus may persist for months. Therefore, we believe composting is likely to provide an effective, biosecure, economically viable and environmentally compatible option for disposal of PEDv mortalities. This research will validate the effectiveness of composting through controlled mortality composting trials subsequent to experimental infections. With the completion of this research, our expectation is that we will know what operating parameters are required to ensure inactivation of PEDv during composting of PEDv mortalities.

Future Plans

Using the information generated from this research, we will deliver extension programming and outreach materials to swine producers, veterinarians, and stakeholders within and beyond Nebraska to promote biosecure disposal of PEDv-infected mortalities.

Authors

Amy Millmier Schmidt, Assistant Professor and Livestock Bioenvironmental Engineer, University of Nebraska – Lincoln aschmidt@unl.edu

J. Dustin Loy, Assistant Professor, Veterinary & Biomedical Sciences, University of Nebraska – Lincoln

Additional information

Dr. Amy Millmier Schmidt
(402) 472-0877
aschmidt@unl.edu

Acknowledgements

The authors would like to acknowledge the Nebraska Pork Producers Association and the National Pork Board for providing funding for this research. Special thanks to Jared Korth for helping with laboratory activities on this project and construction of mortality composting platforms.

The authors are solely responsible for the content of these proceedings. The technical information does not necessarily reflect the official position of the sponsoring agencies or institutions represented by planning committee members, and inclusion and distribution herein does not constitute an endorsement of views expressed by the same. Printed materials included herein are not refereed publications. Citations should appear as follows. EXAMPLE: Authors. 2015. Title of presentation. Waste to Worth: Spreading Science and Solutions. Seattle, WA. March 31-April 3, 2015. URL of this page. Accessed on: today’s date.

Money to Burn: How to Capitalize on BioCNG at Your Wastewater Plant

Purpose  

Across the globe, units of government are struggling with the balance of deriving clean energy with economics and environmental protection. This struggle has led to the development of many renewable energy innovations and inventions, such as rapid improvement in the cost and efficiencies of photovoltaic solar (PV) systems and the development of large off-shore wind turbine systems. The challenges imposed on energy utilities associated with managing grid variability leads emphasis on the development of ‘baseload’ alternative energy systems, like bioenergy systems. We should recognize, however, that we have a bounty of organic wastes generated by society each day, and systems that are able to recycle these organic resources into energy are capable of more consistent energy generation, as compared to the intermittency of solar and wind. In this regard, such bioenergy systems hold promise for balancing our energy needs.

Waste to worth mtb figure 1.What did we do?  

Bioenergy systems based on the utilization of organic wastes, such as municipal wastes, food wastes, and crop residues provide the additional benefits of supporting improved pollution prevention and waste treatment systems.

Of the organic wastes available for us in bioenergy systems, one may be directly correlated to the increasing energy needs and clean energy desires of the global population – waste organics associated with municipal wastewater treatment. Municipal wastewater treatment strategies vary by geography, climate, and level of development across our globe. However, in all cases, opportunities exist to utilize these waste as feedstocks for the creation of biogas that may be used to fuel electricity generators, farm implements, and the transportation needs of our population.

****the above writing doesn’t explain the work that was conducted as requested

What have we learned?  

Many municipal and industrial wastewater treatment plants (WWTP) across the U.S. already utilize anaerobic digestion as a primary treatment process to reduce sludge or reduce organic loading, expressed as Biochemical Oxygen Demand (BOD), to subsequent aerobic treatment processes. However, most of these facilities presently flare the biogas that is produced from the digestion process. Most often, these managers report the following reason for lack of implementation of energy harvesting. WHAT REASON???

We continue to seek clean, renewable energy sources across the globe to reduce our dependency on fossil fuels for improved air quality and economic stability. While solar, wind, and other renewable energy sources play a vital role in a diversified energy strategy, the development of bioenergy systems that continuously operate in ‘base load’ fashion is very important for grid stability. Additionally, unlike solar and wind, bioenergy systems that convert organic wastes into fuels have opportunities to positively impact transportation fuel needs. The development of systems that harvest biogas from anaerobic digesters employed at municipal wastewater plants can serve to fill a portion of this need, and create improved revenues for the wastewater treatment utility. Often, anaerobic digesters serving municipal wastewater treatment plants are operating well under their optimum capacity, creating opportunities for municipalities to engage in partnerships with private sector waste generators, such as food and beverage processors, restaurants, and farmers.

Many commercial fleets are converting to natural gas fuel to realize the cost savings and participate in programs that reward cleaner air quality through reduced emissions. Each commercial waste truck that is converted to natural gas from diesel has a comparable impact to removing 325 cars from the road. Currently the costs of natural gas-fueled vehicles are slightly higher (10-15%) than conventionally-fueled vehicles. However, as the costs of fossil fuels rise, and more CNG vehicles are manufactured, the costs are likely to become very similar.


****An explanation of the table below would be useful.. You should use this document to outline how you conducted the study and what you found, most of the information contained is introductory in nature.

Table 1.

Table 2.Future Plans    

Unlike fossil fuels, which are finite in quantity, bioenergy and biogas systems convert the organic wastes that are generated each day into fuel; often in only a few days’ time. In this regard, bioenergy systems offer a truly infinite resource for renewable energy, while providing the added benefit of pollution reduction and additional revenues to support existing wastewater treatment infrastructure systems.

Author

Gus Simmons, Director of Bioenergy, Cavanaugh & Associates, P.A. gus.simmons@cavanaughsolutions.com

Additional information

www.cavanaughsolutions.com

1-877-557-8924

Acknowledgements      

Clean Water Needs Survey, 2008

Loyd Ray Farms, Yadkinville, NC

Duke University Carbon Offsets Initiative

The authors are solely responsible for the content of these proceedings. The technical information does not necessarily reflect the official position of the sponsoring agencies or institutions represented by planning committee members, and inclusion and distribution herein does not constitute an endorsement of views expressed by the same. Printed materials included herein are not refereed publications. Citations should appear as follows. EXAMPLE: Authors. 2015. Title of presentation. Waste to Worth: Spreading Science and Solutions. Seattle, WA. March 31-April 3, 2015. URL of this page. Accessed on: today’s date.


Above the Dirt: A Look into North Carolina’s Clean Energy Future through Waste-carbon Harvesting


Why Study Organic Wastes as Energy Sources?

Compare the Potential: The United States has tremendous organic resources available, such as food waste, crop residues, animal manures, and human waste. Americans need only look out the window of their home or office to see the reasons why – we live in a very ‘green’ country. In most states, we have a temperate climate with ample resources that promotes our ability to inhabit and cultivate; which means we create organic wastes. However, Americans have been slow to realize the huge potential that may be derived from these organic resources in the form of bioenergy. Why have we spent so much time evaluating the energy resources buried deep in our soils, rather than recognizing the opportunity right in front of us, above the dirt?

What did we do?  

This presentation provides an overview for establishing infrastructure systems that capture, purify, and transport the biogas that may be derived from these organic resources to create an infinite energy reserve to draw from, creating jobs and bolstering our economy. Potential uses for energy products that may be derived from organic wastes are discussed, as well as the barriers, challenges, and economics of waste to energy systems. The presenter’s home state of North Carolina is examined in more detail, describing and comparing the potential for harnessing the energy value from wastes that lie above the dirt.

The Potential:

To understand the infinite possibilities and advantages of the use of bioenergy nationwide, let’s first explore the possibilities in just one state, North Carolina. According to Census Bureau migration patterns in 2013 across the U.S. showed that North Carolina remains in the top 3 fastest-growing states in the nation. While predominantly an agricultural state, N.C. has an abundance of potential to be derived from organic resources in the form of bioenergy. N.C. places second in the U.S. for the production of pigs and turkeys and it ranks fourth in the production of broiler chickens. This generates an abundance of organic wastes, particularly in animal manures, which as people are beginning to understand, gives our state of North Carolina the potential to be a leader in supplying renewable energy.

Map of permitted hogs

According to sources such as the Environmental Protection Agency (EPA), the U.S. Department of Agriculture (USDA) and the Renewable Energy Laboratory (NREL), the organic waste resources in North Carolina – stemming from municipal waste (solid waste and sewage) and agriculture (animal manures) – are among the richest in the nation. Imagine the Potential: North Carolina can harvest energy value from crop residues, food waste and crops to produce infinitely renewable energy that can also improve air and water quality impacts. Anaerobic digestion is one common approach to harvesting the energy content of these organic wastes and other feedstocks.

Biomass resource of the United States, methane emissions from manure management map

What have we learned?  

The development of bioenergy systems is one of the ways in which we can be good stewards of our earthly resources. By reusing the carbon readily at hand above the ground – which is often already creating a negative environmental impact in the form of waste – these bioenergy systems can provide for our fuel and energy needs while simultaneously achieving improvements in environmental quality. There are many ways in which we can accomplish the reuse of carbon through the harvesting of energy value associated with organic wastes. There are over 16,000 permitted municipal WWTP’s in the U.S., and about 10% utilize anaerobic digestion. Coupled with the thousands and thousands of farms, landfills, and biotechnology manufacturing facilities, our ability to develop renewable biogas fuels for transportation and electrification is astounding.

NC "all bioenergy" facilities map (with NG pipelines)

Future Plans  

As a country we need to step away from how we have always done things (buying foreign sources of oil, and using fossil fuels, and relying solely on power plants) and be receptive to innovative approaches that improve climate action initiatives and foster stewardship of our earthly resources so that we can do better environmentally and plan so there be enough water, energy and food for the future. These recommendations start on a state to state level, and progress through our country, and across the world. We need to take better care of our environment, and uses our resources to reduce pollution and greenhouse gases, and harvest the energy from our wastewater and agricultural sources that lie above the dirt.

Author     

Gus Simmons, P.E., Director of Bioenergy, Cavanaugh & Associates, P.A. gus.simmons@cavanaughsolutions.com

Additional information                 

www.cavanaughsolutions.com

1-877-557-8924

Acknowledgements      

Duke Energy Carbon Offsets Initiative

NREL – www.nrel.gov/gis

The authors are solely responsible for the content of these proceedings. The technical information does not necessarily reflect the official position of the sponsoring agencies or institutions represented by planning committee members, and inclusion and distribution herein does not constitute an endorsement of views expressed by the same. Printed materials included herein are not refereed publications. Citations should appear as follows. EXAMPLE: Authors. 2015. Title of presentation. Waste to Worth: Spreading Science and Solutions. Seattle, WA. March 31-April 3, 2015. URL of this page. Accessed on: today’s date.


Farms of the Future: Seeking Agricultural Energy Independence


Why Look to Agriculture and Bioenergy?

As the world population continues to grow at an exponential rate, the ability to nourish this planet’s inhabitants with clean water and safe, healthy food are of paramount importance. This paper describes some of the considerations for and impacts of the demand for the production of food in developed and developing countries on energy resources, and ways in which advancements in on-farm, bioenergy production systems may help farms achieve the incredible production requirements of the next thirty years. Our challenge is to expand agriculture’s output to accommodate the increasing population, without hindering its environmental footprint.

What did we do?  

Today only roughly two percent (2%) of the population produces the food for our plant. This includes all the fruits, vegetables, meats and dairy products that the world’s population of over 7 billion people acquires and eats from markets, grocers, and restaurants. Our global population is projected to exceed nine billion people by the year 2050, all of who will need to be supplied with food derived from the farms of the future. Through technological advances, and improvements in motorized equipment, each farmer is now able to feed roughly 150 people, compared to only 19 people in the 1940’s (Prax, 2010). In the year 2050, a farmer will be required to feed at least 200 people, and based on the rate of reduction in both the number of farms and the amount of land under agricultural production, that number may reach 300 people. But what will these ‘Farms of the Future’ be like? The number of actively producing farms in the developed world has suffered a slow, steady decline over the past two decades, while the global demand for fresh foods, protein and feedstocks have steadily increased. How will we feed a population of more than nine billion with fewer and fewer farms, and how will we feed the livestock needed to feed the increased population?

Figure 1.

What have we learned?  

The growth in our global population also means a growth in the need for clean water, which is a somewhat fixed volume on planet Earth. More importantly, though, the growth in the demand for clean water for drinking purposes also places a greater constraint on the amount of fresh water available for irrigation of crops and to provide for the drinking water required of livestock. The increase in our population means much greater demands for energy – for everything from transportation, lighting, and communications devices to water treatment, agricultural production, and food processing. The culmination of these increasing demands on our planets finite resources has been dubbed by many as the “Food-Water-Energy Nexus.”

Future Plans  

The interdependency of agriculture, water, and energy has become commonly referred to as “the Nexus.” This term does not indicate a crossroads, where a pathway to agricultural production is independent of impacts on water supply and energy availability. Instead, it denotes a relationship of give and take: the decisions we make to utilize, exploit, or economize one of these critical elements of human existence are likely to have broad-reaching impacts on the other two.

Figure 2.The realization of these interdependencies, and more importantly, the fragility of the balance of satisfying these needs must lead us to proactively invest in agricultural innovations, as much as we have with water and energy. The needs for energy innovations have been wildly popularized in society, such as may be seen through promulgation of solar panels the world-over. Similarly, water sustainability innovations, such as reclaiming water from wastes, water conservation devices, and even desalinization. However, the drive for innovations in maximizing the productivity of healthy foods through sustainable agricultural practices seems, by many, silent in comparison.

There is no doubt that the ‘Farms of the Future’ must be able to be self-sustaining; but what does that mean? Will they be able to take the manures from livestock, swine and poultry, convert them to biogas to run the machinery serving their farms, and also provide the nutrient-rich fertilizers for their crops, and bedding for their animals? Will they be able to return nutrients, water, and carbon to the land in which the food is produced in such a manner that none is wasted (meaning the only export from the farms is the food products that are to be consumed, rather than in the form of air emissions, water waste, and exported solid wastes)? What alternate sources of revenue may be developed to sustain small, locally sourced farms?

Demand Placed on Lands

This presentation will discuss how farms of the future can prepare to deal with issues of climate change and greenhouse gas reduction and what is needed in agriculture, water conservation, and stewardship to prepare our world for the additional people inhabiting the Earth in 2050.

Figure 3.

Author         

Gus Simmons, P.E., Director of Bioenergy, Cavanaugh & Associates, P.A. gus.simmons@cavanaughsolutions.com

Additional information  

www.cavanaughsolutions.com

Gus Simmons, P.E. 1-877-557-8924

Acknowledgements      

Sources:

1. Monfreda, C., N. Ramankutty, and J. A. Foley (In Press), Farming the Planet. 2: The Geographic Distribution of Crop Areas, Yields, Physiological Types, and NPP in the Year 2000, Global Biogeochemical Cycles, doi:10.1029/2007GB002947.

The authors are solely responsible for the content of these proceedings. The technical information does not necessarily reflect the official position of the sponsoring agencies or institutions represented by planning committee members, and inclusion and distribution herein does not constitute an endorsement of views expressed by the same. Printed materials included herein are not refereed publications. Citations should appear as follows. EXAMPLE: Authors. 2015. Title of presentation. Waste to Worth: Spreading Science and Solutions. Seattle, WA. March 31-April 3, 2015. URL of this page. Accessed on: today’s date.


Effect of Grazing Cell Size on Horse Pasture Utilization


Purpose *

Horses grazing continuously within a single pasture often graze selectively resulting in under- and over-grazed areas. The net result is inefficient use of forage and/or eventually loss of ground cover. This practice contributes negatively to pasture health and the environment. Rotational grazing can alleviate this problem by forcing horses to be less selective due to constraints on space and time allowed for grazing. It is generally accepted that grazing cells should be sized to provide enough forage for no more than 7 d in order to prevent selective grazing. However, little information is available to definitively confirm this maximum residence time. If the residence time could be increased to greater than 7 d by increasing the size of the grazing cell without the occurrence of selective grazing then labor inputs associated with reconstructing fences and moving horses could be reduced. A reduction in labor might also contribute to an increased acceptance of this practice among horse owners and managers. Therefore a study was designed to compare effect of increasing residence time by increasing grazing cell size on the level of grazing uniformity.

What did we do? 

A predominately tall fescue pasture (approximately 1.5 ha; Lolium arundinaceum Schreb cultivar Max-Q; Pennington Seed, Madison, GA) was divided into four equal sub-plots (approximately 0.37 ha). Eight mature geldings (approximately 500 kg; 9.75 ± 4.4 yr) were paired and randomly assigned to one of two grazing regimes within subplots as follows to determine the effect of residence time and grazing cell size on pasture characteristics reflecting uniformity of grazing: 1) single large grazing cell (SLGC) where horses had access to the entire 0.37 ha subplot for 21-d, or 2) multiple small grazing cells (MSGC) where horses had access to approximately one-third (0.123 ha) of the 0.37 ha subplot for 7 d and were then moved to the next adjacent one-third of the subplot every 7-d for a total of 21-d. Subplot size was estimated to contain enough DM to support DM intake of 2.4% of BW/d for 21 d assuming a grazing efficiency of 0.7. Pasture herbage mass, sward height, compressed sward height and percent ground cover were determined on d-0 and d-21within each sub-plot. The percent compressed sward height below 5 cm within each subplot was used as an estimate of “over-grazed” area. Response variables were analyzed as a repeated measures design for treatment, time and treatment x time interactions. A P-value of 0.05 was considered significant; whereas a P-value of 0.1 was considered a tendency.

What have we learned? 

Pasture herbage mass, sward height, compressed sward height and percent ground cover were not affected by treatment or treatment time interactions. Pasture herbage mass tended to decrease over time (P = 0.08). Sward height and compressed sward height decreased over time (P < 0.05). Percentage of compressed sward height below 5 cm tended to increase at a greater rate within MSGC as compared to SLGC (P = 0.07). Results of this study suggest that sizing grazing cells for longer residence times is feasible and that sizing grazing cells for a shorter residence time requires more management to insure overgrazing does not occur.

Future Plans    

Although the results of this study suggests that two horses can graze a 0.37 ha area containing enough dry matter to facilitate 2.4% of BW intake (assuming a grazing efficiency of 0.7); it is unknown how increasing the stocking rate (and related grazing cell size) will affect uniformity of grazing. Future experiments will investigate this question.

Authors      

Paul D. Siciliano, Professor, Dept. of Animal Science, North Carolina State University Paul_Siciliano@ncsu.edu

Jennifer Gill, Department of Animal Science, North Carolina State University

Additional information               

Bott, R.C., Greene, E.A., Koch, K., Martinson, K.L., Siciliano, P.D., Williams, C., Trottier, N.L., Burke, A., Swinker, A. 2013. Production and environmental implications of equine grazing. J. Equine Vet. Sci. 33(12):1031-1043.

Acknowledgements      

This project was supported by the North Carolina Agricultural Research Service.

The authors are solely responsible for the content of these proceedings. The technical information does not necessarily reflect the official position of the sponsoring agencies or institutions represented by planning committee members, and inclusion and distribution herein does not constitute an endorsement of views expressed by the same. Printed materials included herein are not refereed publications. Citations should appear as follows. EXAMPLE: Authors. 2015. Title of presentation. Waste to Worth: Spreading Science and Solutions. Seattle, WA. March 31-April 3, 2015. URL of this page. Accessed on: today’s date.

Electrolysis of Swine Manure Effluents Using Three Different Electrodes FE-FE, AL-AL, and FE-AL

Purpose

The main objective of this research was to investigate the electrochemical oxidation of swine manure effluent obtained from a primary lagoon for reducing organic and inorganic pollutants.

What did we do?        

Liquid swine manure effluent was collected and treated with three different electrodes (Fe-Fe, Al-Al, and Fe-Al) with three electric current levels (500, 1000, and 2000 mA). The electrochemical cell consisted of two parallel rectangular plates (90 mm × 25 mm × 1.5 mm) of iron (Fe-Fe), aluminum (Al-Al), and iron-aluminum (Fe-Al, later on described as hybrid) electrodes; immersed in a beaker with 550 mL swine effluents, and powered by a direct current (DC) supply (Figure 1). All studies were conducted in batches at room temperature.

Figure 1. photographic view of electrolysis system with floating scum

What have we learned?

In general, removal efficiencies increased with increasing current densities and electrolysis times for electrodes evaluated. Aluminum electrodes (Al-Al) outperformed iron (Fe-Fe) and hybrid electrodes (Al-Fe) in removing total phosphorus (TP) at all current density levels tested. At higher current density (21 mA cm-2), Fe-Al electrodes had shown better TP removal efficiency than other electrodes within 1200 s of treatment initiation, but at lower current densities (5 and 10 mA cm-2) Al-Al electrodes outperformed the other electrodes for TP removal. TP removal progressed overtime and maximum TP removal occurred within 1800 s from the start of each experiment. Overall, Al-Al electrodes resulted in better TP removal over all current densities during the experimental period. Overall, use of hybrid electrodes resulted in better chemical oxygen demand (COD) removal. For the same treatment times (1200 s) at higher current density (21 mA cm-2), hybri d electrodes removed about 100% COD, which are about 1.9 and 1.3 times higher than those of aluminum and iron electrodes, respectively. Iron electrodes showed the highest removal efficiency (85%) for total organic carbon (TOC) at 21 mA cm-2 current density and 1200 s treatment time.

In this study, Fe-Fe electrodes at 10 and 21 mA cm-2 current densities, removed higher TOC (17 to 85% and 51 to 100%, respectively) than those of Fe-Al (9 to 73% and 44 to 84%, respectively) and Al-Al electrodes (9 to 67% and 14 to 70%, respectively). On the contrary, Al-Al electrodes removed higher TOC (10 to 69%) than those of Fe-Fe and Fe-Al electrodes at lower current density (5 mA cm-2) for all treatment times (600 to 3600s). The performance of Fe-Fe and Fe-Al electrodes at 5 mA cm-2 current density were close (~ 6 to 50%) for all treatment times. The high removal efficiency for TOC (85%) was achieved at 1800 s treatment time at 21 mA cm-2 current density with Fe-Fe electrodes.

The removal efficiencies of TP, COD, and TOC were positively correlated with increasing treatment times and three levels of current densities (5, 10, and 21 mA cm-2) and treatment times for each electrode type. Removal efficiencies of TP for all three electrodes (Fe-Fe, Fe-Al, and Al-Al) were similar (90 to 100%) at 21 mA cm-2 current densities for a 1200 s treatment time. Removal efficiencies of TP during 1800 s treatment time for all three electrodes at 21 mA cm-2 current density were about 100%. The TP removal efficiency with Al-Al electrodes was about 100% at 1800 s treatment time for all three levels of applied current densities. Even at lower current density (5 mA cm-2), removal efficiencies of TP with Al-Al electrodes was higher than those of Fe-Fe and Fe-Al electrodes.

Overall, lower specific electrical energy consumptions (SEECs) per kg of pollutants (TP, COD, and TOC) were estimated for the aluminum electrodes than the other electrodes combination. Based on this lab study, it can be concluded that depending on the target pollutants, an appropriate current density and electrode type may be applied to obtain the maximal removal of a pollutant.

Future Plans  

This study was a lab scale study. In the future, a pilot scale study will be conducted with different additives and electrode types.

Authors

Shafiqur Rahman, Associate Professor, Agricultural and Biosystems Engineering, North Dakota State University Agricultural and Biosystems Engineering, North Dakota State University s.rahman@ndsu.edu

M. S. Borhan, Research Specialist, Agricultural and Biosystems Engineering, North Dakota State University

Additional information             

http://thescipub.com/abstract/10.3844/ajabssp.2014.490.502

Acknowledgements      

Financial support from North Dakota Pork Council and State Board of Agricultural Research and Education (SBARE)are gratefully acknowledged. The authors also acknowledge Swine Research Center of North Dakota State University for supplying swine effluents for this study.

The authors are solely responsible for the content of these proceedings. The technical information does not necessarily reflect the official position of the sponsoring agencies or institutions represented by planning committee members, and inclusion and distribution herein does not constitute an endorsement of views expressed by the same. Printed materials included herein are not refereed publications. Citations should appear as follows. EXAMPLE: Authors. 2015. Title of presentation. Waste to Worth: Spreading Science and Solutions. Seattle, WA. March 31-April 3, 2015. URL of this page. Accessed on: today’s date.

Development of a New Manure Amendment for Reducing Ammonia Volatilization and Phosphorus Runoff from Poultry Litter

Adding alum to animal manures greatly reduces ammonia (NH3) emissions and phosphorus (P) runoff.  Improvements in poultry production, lower energy costs and environmental benefits from alum have led to widespread use by the poultry industry. Over one billion broilers are grown with alum in the U.S. each year.  However, the price of alum has increased dramatically, creating a need for cheaper products that control NH3 and P losses. The goal of this research was to develop an inexpensive manure amendment that is as effective as alum in reducing NH3 volatilization and P runoff from poultry litter. Sixteen manure amendments were created using various ratios of alum mud, bauxite ore, sulfuric acid, liquid alum and water.  Alum mud is the waste product that is left over from the manufacture of alum when made by mixing sulfuric acid with bauxite. A laboratory NH3 volatilization study was conducted using a total of 11 treatments; untreated poultry litter, litter treated with liquid or dry alum and litter treated with eight of the new mixtures. All amendments tested resulted in significantly lower NH3 losses than the controls. Ammonia losses with dry and liquid alum were reduced by 86% and 75%, respectively.  Ammonia losses with the eight new amendments ranged from 62 to 73% less than controls and were not significantly different from liquid alum and the three most effective mixtures were not significantly different from dry alum.  All of the amendments also significantly reduced water extractable P (WEP); three of which resulted in significantly lower WEP than with dry alum. The most promising products were mixtures of alum mud, bauxite, and sulfuric acid. The potential impact of these products could be enormous, since they could be produced for less than half the price of alum, while being equally effective at reducing both NH3 emissions and P runoff.

Authors

Moore, Philip     philip.moore@ars.usda.gov        USDA/ARS

The authors are solely responsible for the content of these proceedings. The technical information does not necessarily reflect the official position of the sponsoring agencies or institutions represented by planning committee members, and inclusion and distribution herein does not constitute an endorsement of views expressed by the same. Printed materials included herein are not refereed publications. Citations should appear as follows. EXAMPLE: Authors. 2015. Title of presentation. Waste to Worth: Spreading Science and Solutions. Seattle, WA. March 31-April 3, 2015. URL of this page. Accessed on: today’s date.      

Impact of Aerosols on Respiratory Health of Dairy Workers and Residents Living Near Dairies – Discussion and Implications of Recent Research

Recent studies of large modern dairies have found that respiratory disease remains an important problem for dairy workers, contributing to lost time and high turnover.   Exposure to high levels of organic dusts generated during milking, moving cows, feeding and other tasks has been associated with increased inflammation and decreased lung function resulting in chronic obstructive pulmonary disease (COPD) and asthma-like diseases.   Much research into the cause of respiratory disease in agriculture has focused on the role of endotoxins – a chemical component of Gram-negative bacteria.  Recent research suggests that other components of these dusts such as Gram-positive bacteria and fungi are also important.  Many new workers adapt to these exposures, and new evidence suggests that individual behavior and genetic factors play a key role in explaining why some workers are more susceptible.  In addition several new studies of communities living in the vicinity of dairies and other livestock operations have shown that low level exposure to bioaerosols containing endotoxins and other microbial components at a very young age may be protective against the development of asthma later in life, possibly through priming of the immune system.   Dairy producers are faced with interpreting complex research that may appear to show conflicting results.  This presentation will review and discuss research into the impact of aerosols on respiratory health of dairy workers and residents living near dairies – the findings and implications for dairy producers.

Authors

Reynolds, Stephen Stephen.Reynolds@Colostate.edu Colorado State University, High Plains Intermountain Center for Agricultural Health and Safety  

The authors are solely responsible for the content of these proceedings. The technical information does not necessarily reflect the official position of the sponsoring agencies or institutions represented by planning committee members, and inclusion and distribution herein does not constitute an endorsement of views expressed by the same. Printed materials included herein are not refereed publications. Citations should appear as follows. EXAMPLE: Authors. 2015. Title of presentation. Waste to Worth: Spreading Science and Solutions. Seattle, WA. March 31-April 3, 2015. URL of this page. Accessed on: today’s date. 

How much of the nitrogen contained in dairy ration components is partitioned into milk, manure, crops and environmental N loss?

Purpose

Of the total nitrogen (N) consumed by dairy cows on confinement farms (cows fed in barns), a general range of 20% to 35% is secreted in milk and the remaining N is excreted in manure. The N contained in manure is either recycled through crops after field application, or lost to the environment. To better understand the synergistic nature of feed N and manure N management and environmental N loss from dairy farms, a series of cow, laboratory and field experiments (Figure 1) was undertaken to quantify the relative amounts of N contained in individual ration components that are secreted in milk, excreted in urine and feces, taken up by crops after manure application to soil, and lost as ammonia (NH3) and nitrous oxide (N2O) from dairy barns and soils.

What did we do?

Alfalfa silage, corn silage, corn grain and soybeans were enriched in the field with the stable isotope 15N. Each 15N-enriched component was then fed individually (soybeans were solvent-extracted and the resultant soybean meal was fed) to twelve mid-lactation cows (3 cows per 15N-enriched ration component) as part of a total mixed ration (TMR). The masses of milk, urine and feces produced by each cow were recorded and sampled during the 4 day 15N feeding period, and for 3 days thereafter. This presentation will provide information on the 15N enrichment level of each ration component, the relative amount of each consumed component’s 15N that was secreted in milk and excreted in feces and urine. We will also present the results of a field trial that measured the relative contribution of each ration component’s manure N to corn N uptake during the first and second year after manure application. We will end with explanation of some of the experimental procedures we will use for measuring gaseous N losses after manure applications to barn floors and soils.

Fig. 1. 15N labeling of dairy ration components, milk, urine and feces, and use of 15N-labeled manure to study N transformations

What have we learned?

Here we present some preliminary information on 15N labeling of ration components, the TMR that was fed, and some animal responses. Concentrations of fiber, total N and 15N in the ration components are provided in Table 1.

Table. 1. Concentrations of neutral detergent fiber (NDF), total N (TN) and 15N in ration components fed to dairy cows

Highest 15N incorporation was achieved with corn (silage and grain) and lowest with alfalfa and soybean. This was due to 15N dilution by the atmospherically-fixed N by these legumes. The methods we used to ensile the 15N-enriched corn and alfalfa, the milling of 15N-enriched corn grain and the extraction of 15N-enriched soybeans to produce soybean meal did not appear to impact TMR intake, milk production or N excretion by dairy cows, as indicated by the narrow range (and non-significant differences among TMR containing the 15N-enriched components) in dry matter intake, N intake, milk production, dietary N use efficiency (relative amount of N intake secreted as milk N) and N excretion in urine, urea and feces (Table 2).

Table. 2. Range dry matter intake (DMI), N intake (NI), milk production, dietary N use efficiency (DNUE) and N excretion by 12 cows fed rations containing 15N-enriched components

Future Plans

Feces and urine from each 15N enriched ration component will be applied to laboratory emission chambers that simulate barn floors and field soil surfaces, and 15NH3, 15NH4 15NO3 and 15N2O will be measured. Manure-soil incubations, greenhouse and field trials are underway to determine each ration N component contribution to crop N uptake.

Authors

J. Mark Powell, Soil Scientist, USDA-ARS US Dairy Forage Research Center mark.powell@ars.usda.gov

Tiago Barros, Marina Danes, Matias A. Aguerre and Michel A. Wattiaux Dep. Dairy Sci., University of Wisconsin, Madison, Wisconsin USA


The authors are solely responsible for the content of these proceedings. The technical information does not necessarily reflect the official position of the sponsoring agencies or institutions represented by planning committee members, and inclusion and distribution herein does not constitute an endorsement of views expressed by the same. Printed materials included herein are not refereed publications. Citations should appear as follows. EXAMPLE: Authors. 2015. Title of presentation. Waste to Worth: Spreading Science and Solutions. Seattle, WA. March 31-April 3, 2015. URL of this page. Accessed on: today’s date.

Calculating Carbon Footprints for the UGA Dairy And Swine Farms Using Selected Models


Why Examine Carbon Footprints of Farms?

World Agriculture is currently faced with the challenge of feeding a rapidly increasing global population, predicted to peak at 9.2 billion by 2075, while meeting an obligation to reduce greenhouse gas (GHG) emissions. The emission of GHG can cause many serious problems, such as global temperature rise, sea level rise and ocean acidification.

Satellite map of university of georgia dairy farm
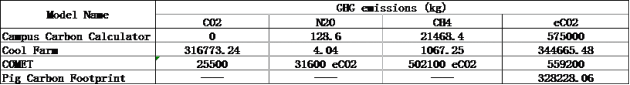
Agriculture releases significant amounts of CO2, CH4 and N2O to the atmosphere. It is estimated that the agriculture sector contributes around 10-12% (~ 5-6 Gt CO2-equivelents yr-1 in 2005) of total global anthropogenic GHG emissions, which is about 50 and 60% of methane and nitrous oxide emissions, respectively. UGA made a commitment to reduce the GHG emissions. These emissions are currently calculated using a model called campus-carbon-calculator. However this model is limited in agricultural applications because it does not account for many management changes that might reduce GHG emissions. The purpos e of our project was to select or develop a model for estimating the GHG emissions from UGA farms. It was necessary for this model to account for crop production, dairy production and swine production and desirable for the model to have limited data requirements, be easy to use and allow for a variety of management options to reduce GHG emissions.

What did we do?

We selected four models (Cool Farm Tool (Version 2.0), COMET-FARM Tool, Farm Smart (Version 1.5) and Pig Production Environmental Footprint Calculator (Version 3.X)) and also used the current-used model Clean Air-Cool Planet Campus Carbon Calculator (Version 6.9) to calculate GHG emissions on the UGA swine farm and dairy farm. We gathered inputs needed in both farms based on models with the help of farm managers, experts and references. Some inputs needed to be calculated and summarized and this was done using best available information. We entered information about swine farm into selected models and compared results on GHG emissions.

satellite map of University of Georgia swine farmWhat have we learned?

GHG emissions for the swine farm calculated using four different models are shown in Table 1. Estimates for GHG emissions in 2013 varied from 328228.06 kg CO2-equivalent (Pig Production Environmental Footprint Calculator (Version 3.X)) to 575000 kg CO2-equivalent using Clean Air-Cool Planet Campus Carbon Calculator (Version 6.9). While the Clean Air-Cool Planet Campus Carbon Calculator (Version 6.9) was the simplest one to use with only two inputs needed, it provided the highest estimates. Conversely, the Pig Production Environmental Footprint Calculator (Version 3.X) was the most complex and difficult to use but was the only tool that could adequately account for the anaerobic digester at this farm.

Table 1. Greenhouse gas emissions in swine farms 2013 using different models

We will finish calculating GHG emissions on the dairy farm and compare models based on carbon footprints and time and effort required. We will investigate a variety of proposed management changes on both farms to determine the resulting impacts on carbon footprints.

Authors

Lin Ma, master student in Department of Crop and Soil Science, University of Georgia malin12@uga.edu

Mark Risse, professor in Department of Crop and Soil Science, University of Georgia

Additional Information

Cool Farm Tool (Version 2.0) https://app.coolfarmtool.org/account/login/?next=/

COMET-FARM Tool http://cometfarm.nrel.colostate.edu/

Farm Smart (Version 1.5) http://sites.usdairy.com/farmsmart/Pages/Home.aspx

Acknowledgements

Thanks to Drs. Lane Ely and Robert Dove and the employees and managers at the UGA Swine and Dairy Centers for supplying information and time to us for this effort.

The authors are solely responsible for the content of these proceedings. The technical information does not necessarily reflect the official position of the sponsoring agencies or institutions represented by planning committee members, and inclusion and distribution herein does not constitute an endorsement of views expressed by the same. Printed materials included herein are not refereed publications. Citations should appear as follows. EXAMPLE: Authors. 2015. Title of presentation. Waste to Worth: Spreading Science and Solutions. Seattle, WA. March 31-April 3, 2015. URL of this page. Accessed on: today’s date.