Do Growth Enhancers Affect the Carbon Footprint of Pork Production?

green stylized pig logoIn swine production, maximizing growth rate while minimizing inputs (efficiency) is a top aim of most farmers. This helps an operation become more profitable, but it also has positive environmental benefits in that the amount of water, feed, or energy needed to produce each pound of pork is reduced. This results in fewer greenhouse gases emitted per pound of pork. (For more information on the relationship between efficiency and carbon footprint in animal agriculture see this Animal Frontiers article).

One particular growth enhancer used by pig farms is ractopamine. This is not an antibiotic, but it alters animal metabolism so that pigs produce more lean tissue (muscle) and less fat. For more on this feed additive, see this Texas A&M fact sheet).

A Comparison of Environmental Footprint With and Without Ractopamine

The image below shows a comparison of the same farm system with and without ractopamine. The results are estimated carbon, water, and land footprints as well as economic costs. The numbers were generated by the Pig Production Environmental Footprint Calculator.

The slide shows a smaller carbon footprint; -37,076 lbs of carbon dioxide equivalents per year when using ractopamine. This farm used 953,754 less gallons of water/year with the growth enhancer and required 14 less acres of land to support the farm. The economic implications (using prices from 2015) were a $11,477 advantage with ractopamine.

slide showing a comparison in carbon, water, land, and economic footprint for a farm with and without ractopamine as a growth enhancer

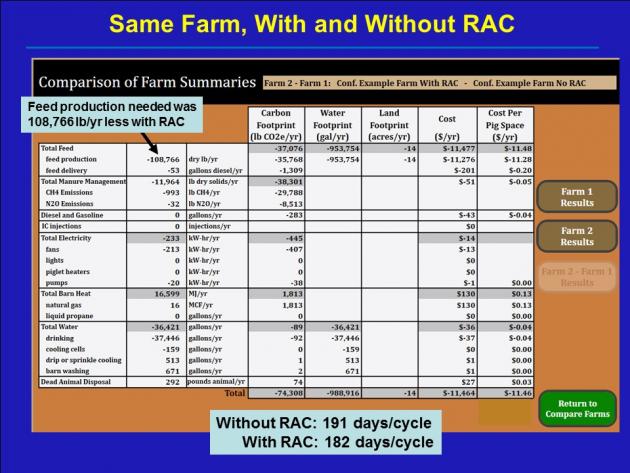
Slide credit: Dr. Rick Ulrich, University of Arkansas.

Are There Other Ways To Improve Growth Besides Ractopamine?

While growth enhances are a proven way to improve efficiency, there are other research-proven recommendations when making management choices to improve growth rate:

  • Phase feeding – diets change due to changing energy, protein, and other nutritional requirements are different as the animal grows
  • Balancing for specific amino acids (and not just crude protein) for each phase
  • Maintaining a clean environment
  • If in a building, keeping temperature in the optimum range

Management choices also impact health status and biosecurity protocols are used to prevent the presence of specific diseases.  In the past, antibiotics could be added to feed or water at low levels to enhance growth rate, but the concern over the proliferation of antibiotic-resistant bacteria resulted in the new policies to only utilize antibiotics to treat (rather than prevent) disease in food animals. The inclusion of antibiotics deemed medically important is being eliminated (federal rules took effect October, 2015 and the policy is in full effect at the end of 2016) for growth-promoting purposes. (For more, see this newsletter from the National Pork Producers explaining the rules to their members).

For More Information

Acknowledgements

Author: Amy Carroll, University of Arkansas

This information is part of the program “Integrated Resource Management Tool to Mitigate the Carbon Footprint of Swine Produced In the U.S.,” and is supported by Agriculture and Food Research Initiative Competitive Grant no. 2011-68002-30208 from the USDA National Institute of Food and Agriculture. Project website.

What Is an Environmental Foot Print? (Ecological Footprint)

green stylized pig logoThe Cambridge dictionary defines environmental footprint as:

the effect that a person, company, activity, etc. has on the environment, for example the amount of natural resources that they use and the amount of harmful gases that they produce

Also referred to as an ecological footprint, this is a measure that attempts to consider multiple impacts of an activity rather than focus on a single one. In relation to the swine industry, this foot print takes into account the results of carbon, water, land and air footprints of pig farming.

Related: Evaluating the environmental footprint of pork production

How do you bring all of these different pieces together? In 2011, the U.S. National Pork Board and many land grant researchers launched a project to develop a science-based decision tool called Pig Production Environmental Footprint Calculator (PPEFC). The PPEFC has the ability to calculate (estimate) impact to greenhouse gas emissions, costs, land use, and water consumption across the pork production chain, including feed formulation and crop production. The combined analysis of all of these factors allows identification of potential ecologically and economically feasible production practices for pork producers.

One of the pieces of this project is developing an environmental footprint, cost, and nutrient database of the US animal feed ingredients and integrating it with the calculator. The calculator is built upon cradle-to-farm gate life-cycle assessment (LCA) of pork production combined with the US National Resource Council (NRC) swine nutrient requirements models (NRC 2012), farm operation inputs, and animal feed database. Farm operation inputs include: barn characteristics, utilities, manure management, dead animal disposal, and farm operation costs. For a description of the inputs, visit this conference presentation at LCA Foods 2014.

Additional Information

Factsheets: What is a water footprint? | What is a land footprint? | What is a carbon footprint?

Pig Production Environmental Footprint Calculator (National Pork Board).

Animal agriculture and:

Acknowledgements

Author: Amy Carroll, University of Arkansas

Reviewers: Jill Heemstra, University of Nebraska; Karl Vandevender, University of Arkansas

This information is part of the program “Integrated Resource Management Tool to Mitigate the Carbon Footprint of Swine Produced In the U.S.,” and is supported by Agriculture and Food Research Initiative Competitive Grant no. 2011-68002-30208 from the USDA National Institute of Food and Agriculture. Project website.

Do We Know the Carbon Footprint of the Pork Industry?

green stylized pig logoA carbon footprint is a total of all the greenhouse gas emissions (GHG) from a process or industry. A life cycle assessment (LCA) is the process used to figure out what GHG emissions will be included in the footprint. More technically, it is systematic way of looking at a product’s complete life cycle and calculating a “footprint”.  In addition to carbon footprints, there are efforts to calculate land, water, and other environmental footprints.

Below are highlights from several different reports that looked at the carbon footprint of the pork industry on a national and international scale. A comparison between different ways to raise pigs was also highlighted.

Snapshot of the Present Time

On a national scale, a report on the National Life Cycle Carbon Footprint Study for Production of Swine in the U.S. was conducted and published in 2011.

The report concluded that the carbon footprint to prepare and consume a 4 oz serving of pork was ~2.5 lbs of carbon dioxide equivalents. Figure 1 (below) from that report shows the relative breakdown of the industry’s estimated greenhouse gas emissions:

  • Live animal production made up 62.1% of the emissions. That is further broken down and presented in second column (right).
  • Processing – 5.6%
  • Retail – 7.54%
  • Consumption – 23.5% including refrigeration, cooking, and methane from food waste in landfill
  • Packaging (1.3%);

Life cycle assessment of pork production in the U.S.

Comparison Over 50 Years of Production

Another example of an industry-wide analysis, this one comparing over time, is a “50-year comparison of the carbon footprint of the U.S. swine herd 1959 – 2009” (29 pp; PDF). The pork industry overall emits more total greenhouse gases than 50 years ago, but actually emits much less per pound of pork produced because of improvements in efficiency.

From that publication:

The U.S. swine industry produces pigs far more efficiently today (2009) than in 1959. The number of hogs marketed has increased 29% (87.6 million in 1959 to 112.6 million in 2009 after removing market hogs imported directly to harvest) from a breeding herd that is 39% smaller. The efficiency gain is even more impressive when measured against the total dressed carcass weight harvested. Dressed carcass yield leaving the farm has nearly doubled in 50 years from 12.1 billion pounds to 22.8 billion pounds. This increase in productivity has resulted in an increase of 2,231 pounds (2.5x) of carcass harvested annually per sow – year. Today, it takes only five hogs (breeding and market) to produce the same amount of pork that  required eight hogs in 1959.

Comparing Different Ways of Raising Pigs

An example of an LCA that looks at different types of systems is “Life-cycle assessment of commodity and niche swine operations“. (informal Q&A and journal article both available). From the journal article (bottom of page 5):

High-profitability operations have consistently lower impacts compared to low-profitability operations for both commodity and deep-bedded niche piglet production.

Global Assessment from Backyard to Industrial Systems

On an international scale, the report “Greenhouse gas emissions from pig and chicken supply chains” was published in 2013. This study looked at all scales of farms from backyard pigs to industrial production (large confinement operations). Over the entire scale, they estimated that the carbon footprint of pork for every kg (~2.2 lbs) of pig carcass weight has an emissions intensity of 6.1 kg of carbon dioxide equivalent.

This report found that backyard systems, especially in some parts of the world, have low emissions, largely due to by-product or “second-grade” feeds. Industrial pig systems tended to have more emissions intensity than backyard systems, with the emissions from liquid/slurry manure management systems being a big reason. From the conclusion of the report:

When drawing any conclusions about scope for improvement, the following points should be borne in mind: (a)differences in emission intensity may reflect differences in production systems that have arisen over time to enable the system to perform better within a given context, e.g. to make them more profitable, or resilient; (b) focusing on a single measure of efficiency (in this case GHG emissions per kg of output) can lead to positive and negative side effects on, for instance, biodiversity, water quality and animal welfare; (c) reducing GHG emissions is not the only objective producers need to satisfy, as they also need to respond to changing economic and physical conditions.

How Do Carbon Footprints Compare?

It is very important to note that when looking at data and numbers generated from different reports like these, the carbon footprints are difficult to compare unless they use the same LCA. Presenting carbon footprints from different LCA’s is an “apples to oranges” comparison. Only when the same LCA is used, can they be an “apples to apples” comparison.

Additional Information

Acknowledgements

Authors: Amy Carroll, University of Arkansas and Jill Heemstra, University of Nebraska jheemstra@unl.edu

This information is part of the program “Integrated Resource Management Tool to Mitigate the Carbon Footprint of Swine Produced In the U.S.,” and is supported by Agriculture and Food Research Initiative Competitive Grant no. 2011-68002-30208 from the USDA National Institute of Food and Agriculture. Project website.