Economical Anaerobic Digestion of CAFO Animal Waste


Purpose

The application of manure on croplands is increasingly under regulatory scrutiny, especially from impaired watersheds. The challenge facing many small farms is to find cost-effective and innovative solutions for manure reuse whilst responding to environmental, regulatory and public concerns. One option is to install an anaerobic digester (AD) in which microorganisms break down biodegradable material in the absence of oxygen. However, not all farmers are financially able to install an AD but do need the AD’s benefits to keep their livestock operation sustainable. This paper discusses a novel, cost effective and patented manure treatment system which can reduce the volume of manure for field application (see Figure 1).Earthmentor N2RTS Schematic

What did we do?

The EarthMentor® Natural Nutrient Reclamation and Treatment System (EMS), uses a combination of innovative sand separation technology (if necessary) and anaerobic treatment to concentrate manure nutrients into solid phases and treat approximately 70% of manure liquids into a product which can be applied to active cropland as low-nutrient liquid using irrigation methods. The primary economic advantage of using an EMS to treat livestock manure prior to land application is lower total manure disposal costs. The total manure handling costs are reduced because up to 75 % of the original manure volume can be handled as low-nutrient value irrigation quality liquid in bulk instead of hauling it by tanker for land application. This fact alone reduces total manure handling costs by over 50 %. Other tangible benefits of using an EMS include low odor, minimized environmental risks, and greater flexibility in proper land application of the treated manure. It can be installed at farms with as few as 250 cows. Depending on farm size, operators can realize a return on investment in as little as three years. Compared to a traditional AD installed to generate biogas the EMS is simple to operate, requires less energy, requires no chemicals or substrates to treat the waste, and reduces manure disposal costs.

The EMS involves six major steps: 1) collection of raw manure and transport to the processing center, 2) sand bedding is separated from the manure stream, 3) coarse manure components are removed from the liquid manure stream, 4) additional settling of the fine manure solids and sand particles occurs in a settling basin to a concentration of 8 to 10 percent solids, 5) AD treatment of the liquid manure and dissolved solids occurs in anaerobic treatment lagoon (ATL), and 6) The ATL effluent is stored in a Storage Pond for eventual discharge to active growing crops; additional natural treatment of the liquid manure occurs while in the Storage Pond.

All settling basins and ATL lagoon must meet state guidelines, such as Natural Resource Conservation Service technical guidelines or state requirements for waste storage facilities.

The ALT of the EMS system has a smaller footprint compared to traditional ALTs (primarily use in the south and western United States) because the majority of the nutrient-rich semi-solids are removed from the manure before discharge to the ATL. Due to this major operational change the EMS is economical to install and operate even in the northern climates of the United States where many of the top producing dairy states are located. While many facilities separate solids before land application, the EMS is different because is adds the AD step which converts the manure into a low-nutrient liquid capable of irrigation-style land disposal.  The method of solid separation can be as simple as a sloped screen followed by additional gravity separation as described in Step 4 above. The EMS ATL must be sized to account for reduced biodegradation during the colder weather. The EMS has successfully operated at multiple swine facilities and several Midwestern dairy farms.

If there is sufficient land near the farmstead, the EMS can be installed at existing dairies with minimum difficulty since the treatment system works equally well with multiple bedding materials and varying manure collection methods. Another benefit of the EMS is that is allows application on fields that may be high in phosphorus since much of the phosphorus will be stored in the accumulating ATL sludge. For dairies bedding with sand, a patented sand removal system can be provided that relies on a decanting method of sand separation. Once the sand is removed, it can be reused in the barn. 

What have we learned?

Typical Cost Savings for Manure Application Using EMS
Component
Disposal Method
Conventional Manure Handling
EarthMentor® Treatment System Handling
Liquid Manure


Land Application 100% $0.02/gallon 0% $0
Separated Solids Land Application 0% $0 10% $0.016/gallon
($4/ton equiv.)
Heavy Slurry Land Application 0% $0 20% $0.02/gallon
Treated Wastewater Center Pivot over Crop 0% $0 70% $0.002/gallon
Combined Cost   100% $0.02/gallon 100% $0.007/gallon
(weighted average of all components)

Using financial data from 2010 for a 2,000-cow Michigan dairy, it was estimated that the cost to handle manure using an EMS is reduced from $0.02/gallon to $0.007/gallon. The cost saving using the EMS is based on the assumption that the average dairy cow produces nearly 25 gallons/day of manure, including wastewater but excludes bedding since farms used different types and volumes of bedding for their dry and lactating cows. Based on the financial analysis, installation of an EMS benefits the farm’s economic sustainability while providing other benefits including reduced environment risk associated with manure land application.

Far beyond the obvious cost savings associated with the EMS installation, a livestock producer will realize many other benefits. A partial list is provided below:

  • This practical and manageable manure treatment system requires little or no additional farm labor commitments yet greatly reduces overhead expenditures to keep the farm sustainable and competitive,
  • All manure is treated prior to land application (environmentally sound),
  • The more consistent high solids slurry can be precisely applied to fields with the greatest need as opposed to the highly variable manure nutrient concentrations recovered from a traditional manure pond,
  • Minimizes the environmental risks (ecologically viable) and farm nuisance potential,
  • The window of opportunity for manure application is extended to over 200 days instead of being limited to spring and fall applications for typical liquid manure,
  • Can provide a safe unlimited recycled bedding source for cattle, if so desired, by the dairy owner,
  • Permits farmer to follow BMPs for soil conservation,
  • Permits farmer to follow timing, rate, source, and place for fertilizer/crop nutrient applications,
  • Benefits the non-farm neighbors and community through reduced nuisance odors, and
  • Continues using the farm’s manure as a soil amendment for crop production, the most efficient use known.

Future Plans

The immediate future plans for EMS is to target small livestock producers, especially those within impaired watersheds.  Since many ADs need a substrate material imported from outside the farm to be economically sustainable, the EMS is ideal for those farms that want to be good neighbors with reduced farm air emissions, need greater convenience in manure management, and desire to maximize the real cash value of their manure.

As the EMS adapts well to any bedding material, by investing time and dedicating property for the ATL any size operation can begin to treat their manure prior to land application and reduce their overall cost for manure management.

In addition to small farms we envision four possible adaptations of EMS; these examples are provided to show the transferability of this technology to farms desiring various outcomes from an EMS:

  1. Installation of an Energy-Generating AD – if a farm wishes to generate energy using a traditional AD, it would be installed prior to the EMS system whereby the AD digestate discharges into the settling ponds. Since the residence time of a traditional AD is measured in days, there is a great deal of additional treatment that can occur so that the cost savings for land application can still be realized.
  2. Use manure solids for other uses besides land application – if the livestock producer decides to bed their cattle on manure solids or to compost the manure solids for sale off-farm to landscapers or bag and sell direction from the farm then the solids from the SS can be further treated with a screw press or roller then composting by various means.
  3. Greenhouse gas capture and sale of carbon credits – a geosynthetic liner cover can be added to the ATL and all captured gases burned through a flare. However, it should be noted that by removing a significant amount of high organic solids during the initial fiber solids separation step, much less organic material is subject to organic degradation into methane gas.
  4. Greenhouse gas capture and burning of the gases – to generate electricity or heat water (typically for on-farm use or export to an adjoining business, such as a greenhouse).

One future issue to resolve includes educating state governments on the benefits of installing an EMS, especially for those farms that may be under a Consent Order or other regulatory actions or those farms that may need to implement a manure treatment system to mitigate odors from the livestock operation.  The duration to install an EMS and get it operational is much shorter than the lead time to design and install a traditional AD so the EMS can help when farms need to implement changes quickly.  A second issue to overcome is to properly educate producers on the benefits of EMS and differences between traditional ADs.  Swine, beef, and dairy producers who already have a farm irrigation system will have a lower capital investment to begin achieving the reduced manure management costs referenced above.

Author

Matthew J. Germane, P.E., President at Germane Environmental Consulting, LLC MGermane@GECEnvironmental.net

Additional information

https://www.gecenvironmental.com, Envirolytic Technologies, LLC

Acknowledgements

Acknowledgements to Envirolytic Technologies, LLC, Greenville, OH manufacturer of the Earthmentor® N2RTS system and RAM Technologies, LLC, manufacturer of the sand separation equipment used in the EMS for their assistance in providing the laboratory data used in this paper.

The authors are solely responsible for the content of these proceedings. The technical information does not necessarily reflect the official position of the sponsoring agencies or institutions represented by planning committee members, and inclusion and distribution herein does not constitute an endorsement of views expressed by the same. Printed materials included herein are not refereed publications. Citations should appear as follows. EXAMPLE: Authors. 2015. Title of presentation. Waste to Worth: Spreading Science and Solutions. Seattle, WA. March 31-April 3, 2015. URL of this page. Accessed on: today’s date.

Evaluation of a Continuously-Mixed Farm-Based Anaerobic Co-Digestion System Following the U.S. EPA Protocol for Quantifying and Reporting on the Performance of Anaerobic Digestion Systems for Livestock Manures – Final Project Results

This paper compliments another paper proposed for this conference “Lifecycle analysis of greenhouse gas (GHG) emissions from a New York State dairy farm anaerobically co-digesting manure and food waste.”

Purpose 

New York State’s largest manure-based anaerobic co-digestion facility was evaluated continuously for a 2-year period following the U.S. EPA Protocol for quantifying and reporting on the performance of anaerobic digestion systems for livestock manures. Overall, we assessed and determined the system’s performance with respect to the: 1) conversion of biomass to biogas, 2) conversion of biogas to useful energy, and 3) system’s economics. The information developed by this project can be used to compare performance information developed from other manure-based anaerobic digestion systems. Related: Treatment Technologies for Livestock Manure

What did we do? 

After initial system evaluation and monitoring plan development, the farm was visited monthly for 24 months to collect data. In addition to the digester influent and effluent samples taken during each monthly sampling date, on-site measurements were taken and data were manually recorded from equipment and plant logs. A particularly important log, were the imported feedstocks brought on-site for inclusion to the AD. This log recorded the date and time feedstock was delivered, the type of feedstock, and the volume delivered. The specific data collected/measured are shown in Table 1.

Table 1. Data collected/measured on-site at each sampling date.

Item
1. Date and time of readings
2. Methane (CH4), Carbon dioxide (CO2), Oxygen (O2), and Hydrogen sulfide (H2S) concentrations in biogas after digester
3. CH4, CO2, O2, and H2S concentrations in biogas after bio-scrubber
4. Engine-generator set run time
5. Cumulative electricity purchased and sold
6. Daily animal populations since previous sampling event
7. Logs of imported feedstocks
8. Problems occurred during period

Further, data (Table 2) from the system’s supervisory, control, and data acquisition (SCADA) unit were downloaded, compiled and analyzed for each period. SCADA data were generated from an array of sensors and meters originally installed by the company that designed and built the digester, i.e., Bigadan A/S.

Table 2. Data obtained from the SCADA system for each period.

Parameter

1. Total influent to pasteurization
2. Food waste to pasteurization
3. Manure to pasteurization
4. Biomass from pasteurization to digester
5. Effluent digester to storage tank
6. Biogas production digester
7. Biogas to generator
8. Generator electrical energy output
9. Generator thermal energy recovered
10. Digester vessel upper temperature
11. Digester vessel lower temperature

Overall, digester influent and effluent samples were collected with the goal of obtaining representative samples. To do this, grab samples were collected directly from both the digester influent and effluent lines over a period of approximately 30 min during a pumping sequence, to develop a 5-gallon composite, master-sample. The entire volume of this sample was then agitated using a paint mixer powered by a portable electric drill until visibly determined to be homogenized. A 1-liter composite sample was immediately taken and stored on ice, and subsequently frozen before being sent for laboratory analysis. Samples were taken in this fashion approximately every 30 days over the 24-month monitoring period. Additionally, samples coming from the raw manure receiving tank and from the combined imported feedstocks tank were also obtained for two sampling dates at the beginning of the monitoring project to characterize the individual influent streams to the digester.

All samples collected during the 24-month monitoring period were sent for analysis to Certified Environmental Services’ (CES) laboratory in Syracuse, NY, approved by the New York State Department of Health, Environmental Laboratory Approval Program (NYSDOH-ELAP #11246). All samples were analyzed in triplicate for: total solids (TS), total volatile solids (VS), chemical oxygen demand (COD), pH, and total volatile acids as acetic acid (TVFA). In addition, the following nutrients were determined in triplicate: total phosphorus (TP), ortho-phosphorus (OP), total Kjeldahl nitrogen (TKN), ammonia-nitrogen (NH3-N) and potassium (K). CES followed the appropriate testing methods outlined in Table 3 for each parameter measured.

Table 3. Standard analytical methods used by CES laboratory for sample analyses.

Parameter Standard
Total Solids (TS) EPA 160.3
Total Volatile Solids (VS) EPA 160.4
Fixed Solids (FS) EPA 160.4
Volatile Acid as Acetic Acid (TVFA) SM18 5560C
Chemical Oxygen Demand (COD) SM18 5220B
pH SW846 9045
Total Kjeldahl Nitrogen (TKN) EPA 351.4
Ammonia-Nitrogen (NH3-N) SM18 4500F
Organic-Nitrogen (ON) By subtraction: TKN – NH3-N
Total Phosphorous (TP) EPA 365.3
Ortho Phosphorous (OP) EPA 365.3
Total Potassium (K) EPA SW 846 6010

Methane (CH4), carbon dioxide (CO2), hydrogen sulfide (H2S), and oxygen (O2) concentration in biogas, were measured on-site during monthly visits using a Multitec 540 (Sewerin GmbH, Germany), a portable hand-held gas measuring device equipped with infra-red/electrochemical sensors.

What have we learned? 

For the entire monitoring project, an average of 1,891±62 lactating cows per day from Synergy Dairy contributed manure to the digester. The average daily loading rate of the digester was 80,408±19,266 gal, where the average percent of imported waste (mostly food-grade residues) co-digested with manure was 25±6% on a volume-to-volume (v/v) basis. The average reduction of organic matter thru the monitoring project was 42% with respect to the influent, while 75% of the odor-causing volatile fatty acids were reduced. In comparison, a previous monitoring study reported by the authors in five manure-based co-digestion operations showed a reduction in organic matter and volatile acids between 36% and 53% and 85% and 91%, respectively. The average daily digester biogas production for the entire monitoring project was 495±78 ft3 per 1,000 lbs of total influent added to the digester, or 173±34 ft3 per cow contribut ing to the digester. The engine-generator set produced an average of 23±7 MWh of electricity per day, from which the average daily parasitic load of the AD system was 3±1 MWh, accounting for approximately 14% of the electricity generated by the plant. Overall, the average capacity factor and online efficiency of the anaerobic digester system during the entire monitoring project were 0.66±0.22 and 80±23%, respectively. The electrical energy generated translated into an overall thermal conversion efficiency of 42±4%. Also, an additional 13±5% of the total energy in the biogas was recovered by the engine as hot water. Thus, an overall 55% (electrical + thermal) of the total energy contained in the input biogas was recovered by the engine-generator set during the monitoring project.

The majority of the challenges experienced by the Synergy AD system were of mechanical origin, whereas 20% were related to the biological process; only 8% of the downtime was due to scheduled systems maintenance. Some of the problems were related to the extreme cold conditions experienced in the Northeast during the period from December 2013 to February 2014. According to NOAA’s National Climatic Data Center, this period was the 34th coldest for the contiguous 48 states since modern records began in 1895, with an average temperature of 31.3F, 1.0F below the 20th century average (NOAA, 2014).

Future Plans 

This manure-based anaerobic digester is the 8th New York State digester we have extensively monitored and reported on. Near-term future planned work includes monitoring a lower cost horizontal plug flow digester on a 2,000-cow farm. This digester uses high density polyethylene (HDPE) material heat welded together as the digester vessel.

Authors

Curt Gooch, Senior Extension Associate, Cornell PRO-DAIRY Program cag26@cornell.edu

Rodrigo Labatut

Additional information 

A full report, written for the project sponsor, can be found on the Cornell PRO-DAIRY dairy environmental systems website, https://prodairy.cals.cornell.edu/environmental-systems/.

Acknowledgements

First and foremost, we wish to thank the Synergy Dairy Farm, Synergy Biogas, and CH4 Biogas for their collaborative efforts that made this project possible. We also like to thank the project sponsor, the Wyoming County (New York) Industrial Development Agency.

The authors are solely responsible for the content of these proceedings. The technical information does not necessarily reflect the official position of the sponsoring agencies or institutions represented by planning committee members, and inclusion and distribution herein does not constitute an endorsement of views expressed by the same. Printed materials included herein are not refereed publications. Citations should appear as follows. EXAMPLE: Authors. 2015. Title of presentation. Waste to Worth: Spreading Science and Solutions. Seattle, WA. March 31-April 3, 2015. URL of this page. Accessed on: today’s date.

Renewable Natural Gas – Biogas Cleaning and Upgrading 101

With depressed electrical prices for produced biogas, many projects are now moving towards business models predicated on production of renewable natural gas (RNG). In order to produce RNG, projects must first clean and upgrade raw biogas to pipeline and/or transportation fuel quality through the use of various engineering approaches. In this presentation, an overview of available and emerging biogas cleaning and upgrading technologies are discussed, highlighting positives, negatives and costs.  

Who Should Consider Biogas Cleaning?

The aim of this fact sheet is to provide farmers, third party project developers, regulatory agencies, and other stakeholders with a basic understanding of the chemical composition of renewable natural gas, the most appropriate end use options for dairy digesters, and some of the more common techniques used to clean biogas to RNG quality at dairy digesters.

What did we do? 

The authors utilized years of research and industry expertise as well as thorough literature search describe the concept of renewable natural gas and the technologies to clean the biogas. The authors aimed to provide information based on the current literature, but not to favor one technology over another.

What have we learned? 

When CHP is the end-use of biogas, the most common biogas purification approach for dairy digesters in the US is to remove water vapor and hydrogen sulfide. Existing projects use a variety of approaches, ranging from biological processes (both post digestion and via oxygen injection into the digester) to physical-chemical absorption processes such as iron type-sponge or activated carbon.

However, if RNG is the end-use a higher degree of purity is required. Often times a dedicated water vapor removal unit and hydrogen sulfide scrubbing unit is still required for removal of the bulk of the hydrogen sulfide mass. Thereafter, water scrubbing or PSA are often used to remove carbon dioxide from biogas, producing an RNG fuel that can be utilized in a variety of different ways. Other technologies exist, however their application on dairy digesters has been rather limited due to concerns related to maturity, cost, and complexity. The best technique is also situation-specific, and therefore, it is critical to understand the mechanics of each purification process, its limitations, and its economics before making a decision.

As electrical rates continue to drop throughout the PNW and US, current and new AD project developers are strongly considering a shift from CHP towards higher value end-uses for biogas, particularly RNG. Interest is increasing due to a growing CNG industry in the US, the decoupling of CNG and diesel prices, and the potential for competitive pricing and high revenues in comparison to fossil-CNG, given existing government incentives. Projects are presently limited and business models must still be proven before wide-scale adoption of biogas upgrading technologies within a dairy digester platform. In addition, concerns historically plaguing CHP projects, related to power purchase agreement pricing, interconnection fees, and scaling are still potentially present within a pipeline fuel model. Nonetheless, the potential exists for a new business model approach to AD projects on US farms.

Future Plans 

No future plans.

Authors

Craig Frear, Assistant Professor, Washington State University cfrear@wsu.edu

Nick Kennedy, Associate in Research WSU; Georgine Yorgey, Associate in Research WSU; Dan Evans, President Promus Energy; Jim Jensen, Associate in Research, WSU Energy; Chad Kruger, DIrector WSU CSANR

Additional information 

For those seeking additional detail, or information about other technologies, more comprehensive reports and reviews are available (Jensen, 2011; Krich et al., 2005; Ryckebosch et al., 2011). This publication is part of the Anaerobic Digestion Systems Series, which aims to provide information that improves decision-making for anaerobic digestion systems.

Acknowledgements

This research was supported by funding from USDA National Institute of Food and Agriculture, Contract #2012-6800219814; National Resources Conservation Service, Conservation Innovation Grants #69-3A75-10-152; Biomass Research Funds from the WSU Agricultural Research Center; and the Washington State Department of Ecology, Waste 2 Resources Program.

The authors are solely responsible for the content of these proceedings. The technical information does not necessarily reflect the official position of the sponsoring agencies or institutions represented by planning committee members, and inclusion and distribution herein does not constitute an endorsement of views expressed by the same. Printed materials included herein are not refereed publications. Citations should appear as follows. EXAMPLE: Authors. 2015. Title of presentation. Waste to Worth: Spreading Science and Solutions. Seattle, WA. March 31-April 3, 2015. URL of this page. Accessed on: today’s date.

Composting of Dairy Manure and Grape Vine Prunings as a Tool to Better Manage Both Industries Waste and Reduce Their Environmental Impact


Why Look at Grapevine Prunings As a Compost Feedstock?

The objectives of this research and Extension project were:

  • To determine the impact of mixing grape vine prunings with dairy manure in a compost mix on the composting process and final product.
  • In particular, we were interested in determining if nitrogen gets fixated into the compost mix with increased carbon content.
  • To evaluate if composting is a workable alternative to annual grape vine prunings burning. Stopping this annual burning will reduce vineyards environmental footprint.
  • To demonstrate three different on-farm composting techniques. Mechanically turned (MT), passive aerated (PA), and forced aerated composting (FA).

What did we do?

field day at compost piles
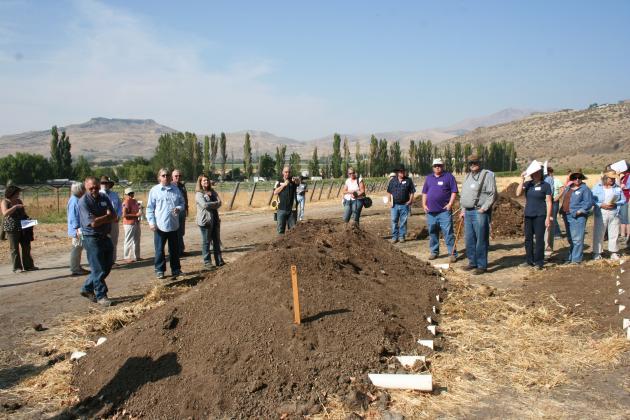
We teamed up with a grape and a dairy producer and we built a series of windrows to showcase the three different composting techniques and to research the effects of mixing both waste streams. Grape vine prunings were grounded and mixed with open lot dairy manure. Carbon content of the mix was adjusted to meet organic production standards since the vineyard hosting the project was certified organic. Since the carbon to nitrogen ratio (C:N) of the grounded grape vine prunings was on the low side (80:1), horse stable sawdust and straw from the local county fairgrounds were also used to help increase the C:N. Three replications of each system (MT, PA, and FA) were built with the enhanced carbon mix. A third set of three replications with dairy manure as received (some straw but no added carbon) were built using the mechanically turned system (MTMA) to serve as a control and comparison for that system. In addition to collecting data to evaluate th e effects of the added carbon, the project included two field days where all the systems, how to construct them, and their advantages and challenges were showcased.

What have we learned?

carbon to nitrogen ration
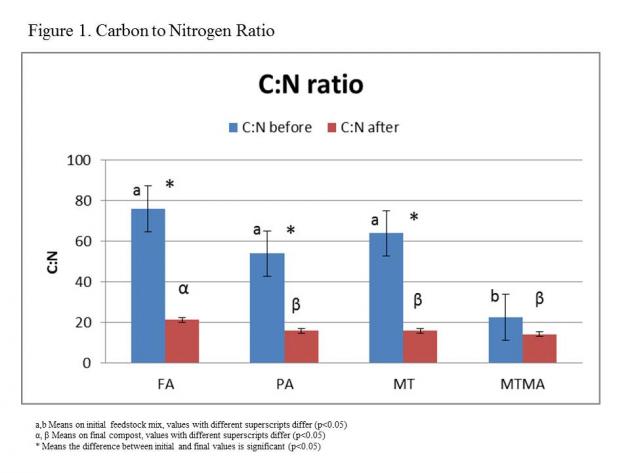
The initial feedstock mix C:N was significantly higher in the carbon enhanced windrows as expected, but the final C:N ratio of the compost was not significantly different among most systems and between the enhanced mix and the just manure mix (Figure 1). The C:N reduction between the initial mix and the final compost was significant in all systems of the carbon enhanced windrows, but not significant in the just manure mix (MTMA).

total nitrogenAs expected, the initial mix total nitrogen (TN) was significantly lower in the carbon (C) enhanced windrows compared to the just manure windrows (Figure 2). TN in the finished compost had no significant difference among all the systems. The difference between the initial mix and final compost TN wasn’t significant among C enhanced windrows, but highly significant in net values (10.08 Lb/T of N on dry weight basis; p<0.0001) on the just manure windrows. This difference in TN, coupled with the no significant difference in C:N, suggests the loss of nitrogen as ammonia during the composting process in the windrows made of just manure. Net nitrogen loss was significantly lower in the C enhanced windrows (1.45 Lb/Ton).

salts
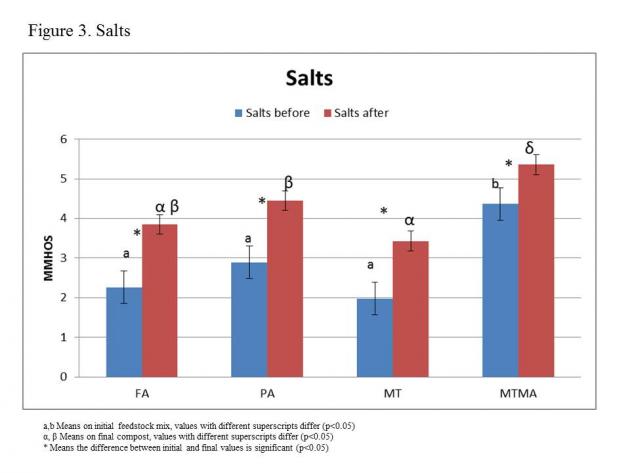
Salts concentrations (mmhos) difference between initial mixes and final compost was significant in all windrows, with higher values in the final compost as expected due to the concentration effect that composting volume reduction has (Figure 3). Salt concentrations in the just manure windrows were significantly higher compared to the carbon enhanced mix. There is a dilution effect when carbon is added in the initial mix (lower manure mass per initial mix unit). Similar dilution trends were observed for phosphorous (P), potassium (K), and micronutrients. Carrying this dilution effect in the final compost can be beneficial when land applying compost since application rates can be increased, increasing the nitrogen and carbon content of the application (desirable conditions) by the time the limiting components in our soils (usually P, K, or salts) are reached.

Screening of the carbon enhanced windrows generated a refuse (bigger size particles) containing pieces of grape prunings that can be used as mulch to control weeds in the vineyard or other production units. When PFRP is achieved, plant pathogens in the mulch can be considered absent or inhibited, and the mulch will be usable on the same or similar plant species.

The PA and MT windrows with enhanced carbon mix reached USEPA-PFRP. FA system didn’t reach PFRP and had an incomplete composting process because of the lack of moisture in the initial mix due to problems with water supply during their construction. Other studies conducted by the authors using FA with similar feedstock had reached PFRP. MTMA windrows didn’t reach PFRP, a common event in the region due to the low carbon content of dairy manure.

Future Plans

This project demonstrated that composting of dairy and potentially other livestock manures mixed with woody wastes from the grape industry or similar agricultural products is not only feasible but beneficial for both industries. Further research is necessary to determine how different carbon and animal manures sources, especially harder woods, will affect the composting process and the final product.

Authors

Mario E. de Haro-Martí. Extension Educator. University of Idaho. mdeharo@uidaho.edu

Mireille Chahine, Extension Dairy Specialist
Tony McCammon, Extension Educator
Ariel Agenbroad, Extension Educator. University of Idaho

Additional information

Unpublished data. Please contact the author, Mario E. de Haro-Martí at mdeharo@uidaho.edu or 208-934-4417.

Acknowledgements

The authors want to thank the participating grape and dairy producers for their collaboration. This project was funded by an Idaho USDA-NRCS Conservation Innovation Grant (CIG).

The authors are solely responsible for the content of these proceedings. The technical information does not necessarily reflect the official position of the sponsoring agencies or institutions represented by planning committee members, and inclusion and distribution herein does not constitute an endorsement of views expressed by the same. Printed materials included herein are not refereed publications. Citations should appear as follows. EXAMPLE: Authors. 2015. Title of presentation. Waste to Worth: Spreading Science and Solutions. Seattle, WA. March 31-April 3, 2015. URL of this page. Accessed on: today’s date.

On-Farm Evaluation of Wood bark-Based Biofilters in Terms of Mitigation of Odor, Ammonia, and Hydrogen Sulfide


Purpose

Mitigating odor and gas emissions is a big challenge facing concentrated animal feeding operations. Biofiltrtion has been recognized as one of the most promising technologies for reducing odor and gas emissions from animal facilities. However, the rate of on-farm biofilter adoption continues to be low. The purpose of this research was to demonstrate, evaluate, and encourage the widespread adoption of biofilters for mitigating odor and gas emissions.

What did we do?

Two vertical down-flow biofilters were constructed on a commercial swine nursery farm. Both biofilter media were shredded wood bark and medium wood bark (1:2 on a volume basis). These biofilters were evaluated under real farm conditions in terms of mitigation of odor and gas emissions. Odor samples were collected using 10 L Tedlar bags and evaluated using a dynamic forced-choice olfactometer. Ammonia and hydrogen sulfide concentrations were monitored on-site by detection tubes. Pressure drop through the biofilter media was also measured on-site using an air velocity meter. A biofilter field day was held on the swine farm to demonstrate their effects and to present biofilter basics. Also, an educational video has been developed to help interested people get familiar with this technology.Picture (a)biofilter 1 (BF1) and biofilter 2(BF2) with front doors open; (b) biofilters with front doors closed; (c) media and water distribution system in BF2; (d) media and water distribution system in BF1; (e) shredded wood bark; (f) medium wood bark.

Figure 1. (a)biofilter 1 (BF1) and biofilter 2(BF2) with front doors open; (b) biofilters with front doors closed; (c) media and water distribution system in BF2; (d) media and water distribution system in BF1; (e) shredded wood bark; (f) medium wood bark.

What have we learned?

(2) Supporting materials showing biofilter basics and its effects on reducing aerosol emissions are needed to encourage biofilter adoption,
(3) Field days are a good platform for both research and demonstrations of new techniques,
(4) Producer’ collaboration and full participation are very important to make the research a success.

Odor and gas (NH3 and H2S) reduction efficiency and moisture distribution at different media depths of (a) biofilter 1 (BF1); (b) biofilter 2 (BF2)

Figure 2. Odor and gas (NH3 and H2S) reduction efficiency and moisture distribution at different media depths of (a) biofilter 1 (BF1); (b) biofilter 2 (BF2).

Reduction efficiency for first stage of biofilter 2 (BF2) at different media moisture contents (MC) (a) NH3; (b) H2S; (c) moisture distribution at different media depths. Shredded wood bark (depth of 127 cm) was used and EBRT was 0.9-1.0 s.

Figure 3. Reduction efficiency for first stage of biofilter 2 (BF2) at different media moisture contents (MC) (a) NH3; (b) H2S; (c) moisture distribution at different media depths. Shredded wood bark (depth of 127 cm) was used and EBRT was 0.9-1.0 s.

Reduction efficiency for second stage of biofilter 2 (BF2) at different media moisture contents (MC) (a) NH3; (b) H2S; (c) moisture distribution at different media depths. Medium wood bark (depth of 254 cm) was used and EBRT was 1.8-2.0 s.

Figure 4. Reduction efficiency for second stage of biofilter 2 (BF2) at different media moisture contents (MC) (a) NH3; (b) H2S; (c) moisture distribution at different media depths. Medium wood bark (depth of 254 cm) was used and EBRT was 1.8-2.0 s.

Future Plans

We will refine the developed educational videos and disseminate results from this study to our stakeholders.

Authors

Lide Chen, Waste Management Engineer and Assistant Professor, Biological and Agricultural Engineering Department, University of Idaho lchen@uidaho.edu

Gopi Krishna Kafle, Post-Doctoral Researcher; Howard Neibling, Extension Irrigation and Water Management Specialist and Associate Professor; B. Brian He, Professor, University of Idaho

Additional information

Contact Dr. Lide Chen at lchen@uidaho.edu for more information.

Acknowledgements

This project was partially funded by the USDA Natural Resource Conservation Service through a Conservation Innovation Grant. The authors gratefully thank Mr. Dave Roper for his cooperative efforts during this research.

The authors are solely responsible for the content of these proceedings. The technical information does not necessarily reflect the official position of the sponsoring agencies or institutions represented by planning committee members, and inclusion and distribution herein does not constitute an endorsement of views expressed by the same. Printed materials included herein are not refereed publications. Citations should appear as follows. EXAMPLE: Authors. 2015. Title of presentation. Waste to Worth: Spreading Science and Solutions. Seattle, WA. March 31-April 3, 2015. URL of this page. Accessed on: today’s date.

Practical Use and Application of the Poultry Carbon Footprint Calculation Tool


Why Study Carbon Footprint on Poultry Farms?*          

The poultry industry is a major part of the agricultural industry in the United States, and an awareness of the carbon footprint of the industry is important for future growth and development. With carbon footprint estimated to be as high as 18% of total Green House Gas (GHG) emissions, changes in U.S. animal production systems will be a component in mitigating the impacts of the industry on climate change. Changes in GHG emissions from the poultry industry can be achieved only if the industry knows the levels of greenhouse gas emissions contributed as a result of poultry production.

What did we do? 

The Poultry Carbon Footprint Calculation Tool (PCFCT) was developed and designed specifically for poultry production farms. The tool can be used to estimate the greenhouse gas (GHG) emissions from pullet, breeder and broiler grow-out farms. While several life-cycle assessments have been completed for the production of poultry meat, there is no industry specific carbon footprint calculation tool available for the production phase of the poultry industry and since the poultry farmer only has control over the activities that take place on his farm, he can only make reductions of emissions at the farm-gate level. It is therefore important that a tool such as the PCFCT is available to deal with the farm level emissions.

The GHGs that are assessed are carbon dioxide, nitrous oxide and methane which are the gases of major concern in agriculture. The specific objectives of this study was to develop a computer-based, user-friendly calculation tool to assess greenhouse gas emissions from poultry farms and also to identify abatement strategies in on-farm management practices to reduce the footprint on farms. The user friendly PCFCT is an Excel spreadsheet into which the user will enter farm data to calculate the annual carbon footprint (Figure 1). The research included an assessment of the carbon footprint of test farms under industry management standards with focus placed on management practices and farm-expense data, particularly with regard to expenditures for energy-intensive inputs such as electricity and fuel which are the largest contributors to GHG emissions for poultry farms. This was used to identify potential areas of change.

The calculation tool was developed and then used to estimate the emissions from 30 test farms from three poultry companies in three different regions in Georgia.

What have we learned? 

We observed that the major sources of greenhouse gas that are emitted on poultry production farms were from gas use and manure management. Based on these observations, the tool was then equipped to recommend improvements to the farm, which would in turn show the user potential reductions in GHG emissions and cost savings if the recommended improvements were implemented. The results from the study showed that there were significant differences in emissions from mechanical sources and electricity use between the southern region and the northern and central regions of the state (Table 1). The differences observed could be a result of; climatic differences, the dead bird disposal methods and also the duration of time the flock is kept on the farm.

Table 1. Average Farm Emissions from three Broiler Complexes located in three different regions.

The tool is also very useful for record keeping as it is designed with a printable inventory which will allow users to track and compare their emissions from year to year. It is also equipped with bar charts to show the user their current emissions compared to projected emissions if they apply the recommended changes. A second graph shows the percentage of emission from each source.

Future Plans    

The tool will be made available on the departmental website (uga.poultry.edu) for poultry producers, poultry company environmental personnel and extension personnel to utilize. Articles relevant to the subject will also be made available to users of the tool. Other future plans include incorporation of other segments of the industry (layer and turkey) into the tool.

Authors       

Claudia Dunkley, Ext. Poultry Scientist cdunkley@uga.edu

Brian Fairchild, Ext. Poultry Scientist, Casey Ritz, Ext. Poultry Scientist, Brian Kiepper, Ext. Poultry Scientist, John Worley, Ext. Engineer

Additional information                

www.poultry.uga.edu

C. S. Dunkley, University of Georgia, 2360 Rainwater Rd., Tifton, GA 31793-0478

Acknowledgements      

Funded by US Poultry & Egg Association

Figure 1. The PCFCT Interface page showing areas where farm data will be inputted, recommendations can be tried and an inventory showing the emissions and projections based on recommendations can be seen.

The authors are solely responsible for the content of these proceedings. The technical information does not necessarily reflect the official position of the sponsoring agencies or institutions represented by planning committee members, and inclusion and distribution herein does not constitute an endorsement of views expressed by the same. Printed materials included herein are not refereed publications. Citations should appear as follows. EXAMPLE: Authors. 2015. Title of presentation. Waste to Worth: Spreading Science and Solutions. Seattle, WA. March 31-April 3, 2015. URL of this page. Accessed on: today’s date.

The Importance of Nitrogen Stabilization

This session will highlight the importance of nitrification inhibitors and how they help delay the conversion of the ammonium form of nitrogen into the nitrate form which then can lead to leaching and denitrification. By using a nitorgen stabilizer, the plant has access to the ammonium form of nitrogen for a longer period of time in the root zone, where it needs it the most.

What Did We Do?

The active ingredient in Instinct II and N-Serve, nitrapyrin, is formulated to put the bacteria known as nitrosomonas, which convert the ammonia form of nitorgen to nitrate nitrogen in the soil, in a static state so that the ammonia form can be uptaken by the plant in the most stable form of nitrogen. Our product treats the soil, not the nitrogen, but uses nitrogen as the carrier, to prevent leaching and denitrification that can occur from warm, wet soils in the spring season. Our product has been tested and approved by the EPA for 40 years and has have numerous (189+) 3rd party and university data that supports that it does what we say it does, inhibits nitrification. In addition, there are other advantages to protecting your nitrogen investment which can lead to higher yields, faster dry down, higher test weight in corn and wheat and in addition, has no negative effect on protein on wheat. Instinct II can be used in UAN, Urea, or Liquid Manure. N-Serve is used on anhydrous ammonia.

What Have We Learned?

Based on the 189+ different 3rd party and university trials, plus the meta-anaylsis published in 2004, we have proven to increase crop yield by 7%, increase soil retention by 28%, decrease nitrogen leaching by 16%, and decease greenhouse gas emission by 51%. Our retention is extremely high on his product, and has proven to be a significant benefactor when used in manure (this year along, our averages on yield increase have been 12+ bushels). Future plans further expansion to outside of US markets, Canada, China, UK, and Australia alongside other EU countries. Further market expansion in the United States into other crops such as specialty crops markets, improvement on formulation for newer, expanding markets.

Author

Tiffany Galloway tlgalloway@dow.com

Additional Information

The authors are solely responsible for the content of these proceedings. The technical information does not necessarily reflect the official position of the sponsoring agencies or institutions represented by planning committee members, and inclusion and distribution herein does not constitute an endorsement of views expressed by the same. Printed materials included herein are not refereed publications. Citations should appear as follows. EXAMPLE: Authors. 2015. Title of presentation. Waste to Worth: Spreading Science and Solutions. Seattle, WA. March 31-April 3, 2015. URL of this page. Accessed on: today’s date.

The Natural Farming Concept: A New Economical Waste Management for Small Family Swine Farms


Why Look at Inoculated Deep Litter Systems?

The most critical issue facing livestock and other small family operations nationwide is the development and implementation of cost effective pollution prevention technology. Our livestock producers, especially swine, continue to seek a best management practice (BMP) that is effective, economical, and practical, and in compliance with new US EPA laws. The Department of Health, Natural Resource Conservation Service, Hawaii Soil and Water Conservation Districts and the Cooperative Extension Service have been working diligently to address both federal and state waste management compliance needs of the local pork producer. As a result, the industry currently implements effluent irrigation, composting, deep litter technology, lagoon storage and solid separation as possible solutions for on-farm nutrient management. Unfortunately, due to new and revised EPA regulations, which now include nuisance odor and vector components, many of these strategies no longer meet federal criteria for BMPs.

In 2006, a system of waste management, with the potential to be implemented as a BMP under federal regulations, was discovered in Korea during a visit to the Janong Natural Farming Institution. The concepts of naturally collected micro-organisms, green waste deep litter, and a piggery design with strategic solar and wind positioning was being practiced in several countries in Asia and the Pacific Basin. Over the past six years, these concepts have been tested in Hawaiʻi to provide small swine farms with another BMP that is in compliance with current EPA regulations.

What did we do? 

For the past six years, the Extension Service has been touring many hog farms and conducting numerous educational seminars on the Inoculated Deep Litter System (IDLS). The number of IDLS piggery operators has increased dramatically due to farmers coming out of retirement, producers retrofitting and replacing their wash-down swine operations as well as new farmers trying their hand at raising hogs. A major factor of the great interest toward the IDLS piggery is the minimal labor and time to operate the system compared to the traditional style of raising hogs with daily wash downs of the pig pens. Other important factors include the concept of collected micro-organisms, a layering of the deep litter green waste system, and designing piggery housing with strategic solar and wind positioning to keep the facility cool and dry. The success of the IDLS system is exemplified by the following: 1) Low maintenance since litter pens never have to be cleaned, 2)has no odor or ve ctor problems if managed correctly and 3) development of cost effective housing.

What have we learned? 

IDLS incorporates four components: 1) self-collected, site-specific (or indigenous) micro-organisms (IMOs), 2) green waste, 3) natural ventilation, and 4) facility positioning relative to sunlight. The livestock facility is kept dry with natural ventilation and sunlight, which promotes proper fermentation of the pen litter (combination of green waste and livestock waste) thus preventing nuisance fly breeding and odors generated by proliferation of undesirable organisms.

Solar positioning. The building’s foundation is positioned from north to south, with the south end serving as the entrance to the facility. This takes advantage of maximizing sunlight traveling east to west, which provides adequate ultraviolet light, heating, and drying. Sunlight and ventilation help to promote drying, thus preventing liquid accumulation (from livestock waste, watering nipples or troughs, rain) in the litter, which deters the fermentation process from turning anaerobic, and eliminates conditions ideal for odor and fly breeding. (Note: orientation applies to the Northern Hemisphere and positioning should be reversed for application in the Southern Hemisphere.)

Natural ventilation. The building is designed with a high (14 ft H), vented roof, and walls (10 ft H) which have openings to the outside. Cool trade winds are allowed to blow through the building, forcing warm air to rise and be eliminated through the vented roof. This helps to dissipate heat generated from microbial fermentation in the litter, keeps the litter dry through constant air movement, and cools the facility during the hot season. During the rainy season, simple roll-down siding can be installed to keep rain out.

Deep Litter. In order to fulfill EPA regulations that require an impervious bottom to all waste handling facilities, there must be either a concrete slab or a thick (30 mil) plastic liner as the base of the building. Green waste, with a minimum depth of 4 feet, is then strategically layered to start the IDLS. The first layer consists of roughly a half foot of cinders mixed with bio-char (not charcoal briquettes). The second layer consists of 2 feet of cut logs. Logs should be at least 3 to 4 feet long and can range in diameter from 2” or more (larger, longer logs deter pigs from rooting them to the surface). The third layer is comprised of either leaves or fronds covered with assorted green waste. The next step is too lightly spread about one pound of IMO-4 and soil to every 50 square feet of surface area in the IDLS pen. For example, a 100 sq ft pen will require 2 pounds of IMO-4 applied in the third layer. The final step is to add about a half foot of sawd ust. Two weeks before introducing animals into the pens, activate the microbes once with a mist spray of lactic acid bacteria (LAB) and fermented plant Juice (FPJ). You can add animals to the pen once you smell a yeasty odor in the litter, a sign that the microbes have been activated and are at work in the pen.

Micro-organisms: The only micro-organisms used are self-collected by the producer from the specific site of the facility. The profile of indigenous micro-organisms may vary greatly from place to place, from windward to leeward coasts, and even between neighboring properties. The initial, one-time misting with lactic acid bacteria (LAB) and fermented plant juice (FPJ) activates the microbes to increase in numbers. To learn how to make these activators, please attend a Natural Farming Input-Making class, or contact the Hawaiʻi Cooperative Extension Service (mduponte@hawaii.edu).

LAB and FPJ: These are self-made inputs. Go to CTAHR website for free publication

Future Plans 

Adaptation of concept overcome a major hurdle when the IDLS piggery became cost sharable with the federal government on November 15, 2012 and deemed a best management practice. Hog farmers who practice the IDLS are eligible in entering into a cost-share agreement with the U.S. Department of Agriculture (USDA) for Environmental Quality Incentive Program (EQIP) assistance and may file an application at any time and will further enhance the participation in the IDLSTo date nearly 50 retrofitted or new operations have been established in Hawaii. The IDLS has been introduced and being practiced in 11 states, Micronesia and various countries of the world. Future plans include implementing the technology to large scale operations, making of feed utilizing other natural farming techniques and evaluating the compost for organic plant propagation. The system is currently being tested with Poultry Production

Author   

Michael DuPonte, Extension Agent University of Hawaii at Manoa, College of Tropical Agriculture and Human Resources (CTAHR). mduponte@hawaii.edu

Additional information 

Publications

H. Park and M.W. DuPonte., 2010., How to Cultivate Indigenous Microorganisms, Biotechnology, CTAHR., June, BIO-9.

M. DuPonte and D. Fischer., Most Frequently Asked Questions on the IDLS Piggery, The Natural Farming Concept A New Economical Waste Management Stem for the Small Family Swine Farms in Hawaii., 2012., Livestock Management., Sept. , LM-23

D. M. Ikeda, Weinert Jr., E., Chang K.C.S., Mc Ginn, J.M., Miller S., Keliihoomalu, and DuPonte, M.W., 2013., Natural Farming: Fermented Plant Juice, Sustainable Agriculture, CTAHR., July, SA-7.

S. Miller, Ikeda, D.M., Weinert Jr., E., Chang K.C.S., Mc Ginn, J.M., Keliihoomalu, and DuPonte, M.W., Natural Farming: Lactic Acid Bacteria, Sustainable Agriculture, CTAHR., August, SA-8.

Acknowledgements      

Kang Farms of Kurtistown, Hawaii, David Fischer (NRCS), Justin Perry III (NRCS) and Lehua Wall (CTAHR)

The authors are solely responsible for the content of these proceedings. The technical information does not necessarily reflect the official position of the sponsoring agencies or institutions represented by planning committee members, and inclusion and distribution herein does not constitute an endorsement of views expressed by the same. Printed materials included herein are not refereed publications. Citations should appear as follows. EXAMPLE: Authors. 2015. Title of presentation. Waste to Worth: Spreading Science and Solutions. Seattle, WA. March 31-April 3, 2015. URL of this page. Accessed on: today’s date.

Nitrous Oxide Emissions in Snow-covered Agricultural Soils – manure-induced fluxes


Why Study Nitrous Oxide Emissions and Manure Application?*

It is now accepted that soil nitrous oxide (N2O) emissions occur under freezing conditions (Sommerfeld et al., 1993; Pelster et al., 2012), and that overwinter N2O emissions may represent a substantial portion of the total annual emissions from agricultural soils in northern countries (Maljanen et al., 2007; Wagner-Riddle et al., 2007; Virkajärvi et al., 2010). However, the temporal dynamics during winter are poorly documented, and the question whether manure application in the fall may increase winter N2O emissions is under debate. In addition, the possible influence of soil texture in regulating N2O emissions during winter has been overlooked. Our objective was to compare N2O emissions above the snow cover on sandy and clayey soils with and without pig slurry applied in the fall.

What did we do?

The study was carried out for three consecutive winter periods (2010-2013) on a sandy loam and a silty clay soil. Soil N2O concentration and emission were monitored weekly from November to May using soil probes and static chambers, respectively. The static chambers were made of 20-cm diameter white PVC pipe. The chamber base (15 cm height) was permanently inserted to 10 cm depth. Pig slurry was applied within half of the chamber bases (5 per soil type), whereas the other half remained unamended (Control treatment). The manure was immediately incorporated into the top 5 cm of soil using hand tools; soil in control chambers was similarly disturbed. Additional sections of PVC pipe (10 cm height) were secured on the top of each chamber base as the snowpack developed, and were removed stepwise in the spring during snowmelt. The chamber base was therefore emerging above the snow cover at time of chamber deployment. On each sampling date, the accumul ation of N2O within the chamber headspace was monitored at 6-min intervals during 18-min deployments. Soil air was also collected weekly through soil probes installed at 7.5 cm depth. Air samples were withdrawn with a syringe and transferred to pre-evacuated vials. Gas samples in vials were analyzed for N2O within 48 h using a gas chromatograph.

Title: Nitrous Oxide Emissions in Snow-covered Agricultural Soils – manure-induced fluxes

Authors and affiliations:

Martin H. Chantigny, Philippe Rochette & Denis A. Angers, Agriculture and Agri-Food Canada, Québec;

Claudia Goyer, Agriculture and Agri-Food Canada, Fredericton, Canada

Table 1. Range of cumulative N2O-N emission, magnitude of emissions, and emission factors measured for three consecutive winter periods.


Sandy loam


Silty clay

Cumulative emission

(kg N2O-N/ha)


0.1 to 2.0


0.6 to 1.6

Magnitude of emissions

(% of total annual emission)

32 to 67


10 to 27

Emission factor

(% N applied)

0.3 to 3.0


0.9 to 2.4

What have we learned?

Nitrous oxide was produced in soils and emitted in all years, with a low in late fall (Nov.-Dec.) and significant increases when snow depth exceeded 20 cm (late Dec. – early Jan.) and during spring thaw (late March – early April). Ice formation on and within the soil occurred during freeze-thaw events. This phenomenon generally blocked the emission of N2O but did not prevent its production in the soil. Therefore ice formation resulted in a marked decline in N2O emissions with concurrent increase in soil N2O concentration. The temporal dynamics of N2O emissions was variable among years, and the significance of manure-induced N2O emissions was mainly explained by early winter frost penetration, which was dependent on snow accumulation in late fall. As opposed to N2O emissions measured during the growing season, sandy soils tended to emit as much N2O as clayey soils during the non-growing season. Consequently, the cumulative N2O-N emi ssions in the non-growing season (November-April) accounted for 10 to 25% of total annual emissions in clayey soils, and from 20 to 70% in sandy soils (Table 1). Soils amended with pig slurry in the fall emitted more N2O than soils without, with emissions factors up to 3%, higher than the default IPCC coefficient (1%).

References

Maljanen M., Kohonen, A.R., Virkajärvi P., Martikainen P.J. 2007. Fluxes and production of N2O, CO2 and CH4 in boreal agricultural soil during winter as affected by snow cover. Tellus, Series B: Chem. Phys. Meteor. 59, 853-859.

Pelster, D.E., Chantigny, M.H., Rochette, P., Angers, D.A., Laganière, J., Zebarth, B., Goyer, C. 2012. Crop residue incorporation alters soil nitrous oxide emissions during freeze-thaw cycles. Can. J. Soil Sci. 93:415-425.

Sommerfeld, R.A., Mosier, A.R., Musselman, R.C. 1993. CO2, CH4, and N2O flux through a Wyoming snowpack and implications for global budgets. Nature 361:140-142.

Virkajärvi P., Maljanen M., Saarijarvi K., Haapala J., Martikainen P.J. 2010. N2O emissions from boreal grass and grass-clover pasture soils. Agric. Ecosyst. Environ. 137, 59-67.

Wagner-Riddle, C., Furon, A., McLaughlin, N. L., Lee, I., Barbeau, J., Jayasundara, S., Parkin, G., von Bertoldi, B., Warland, J. 2007. Intensive measurement of nitrous oxide emissions from a corn-soybean-wheat rotation under two contrasting management systems over 5 years. Global Change Biol. 13:1722-1736.

Future Plans

Now that we evidenced the significance of N2O emissions from soils during the winter period, we are initiating field work to determine best practices for fall application of manure (e.g. early vs. late fall application; use of additives to delay nitrification of manure ammonia) that will mitigate losses and help efficiently transferring applied N to crop in the next spring.

Authors

Martin H. Chantigny, Soil Scientist, Agriculture and Agri-Food Canada, Quebec martin.chantigny@agr.gc.ca

Philippe Rochette, Denis A. Angers, Agriculture and Agri-Food Canada, Québec;

Additional information

Scientific papers and reports can be accessed through my webpage:  www.agr.gc.ca/fra/science-et-innovation/centres-de-recherche/quebec/centre-de-recherche-et-de-developpement-sur-les-sols-et-les-grandes-cultures/personnel-et-expertise-scientifiques/chantigny-martin-phd/?id=1181933396583

Acknowledgements

This project was financially supported by the Sustainable AGriculture Environmental Systems (SAGES) Initiative of Agriculture and Agri-Food Canada

The authors are solely responsible for the content of these proceedings. The technical information does not necessarily reflect the official position of the sponsoring agencies or institutions represented by planning committee members, and inclusion and distribution herein does not constitute an endorsement of views expressed by the same. Printed materials included herein are not refereed publications. Citations should appear as follows. EXAMPLE: Authors. 2015. Title of presentation. Waste to Worth: Spreading Science and Solutions. Seattle, WA. March 31-April 3, 2015. URL of this page. Accessed on: today’s date.

Particulate matter from open lot dairies and cattle feeding: recent developments

The research community is making good progress in understanding the mechanical, biochemical, and atmospheric processes that are responsible for airborne emissions of particulate matter (PM, or dust) from open-lot livestock production, especially dairies and cattle feedyards.  Recent studies in Texas, Kansas, Nebraska, Colorado, California, and Australia have expanded the available data on both emission rates and abatement measures. Although the uncertainties associated with our estimates of fugitive emissions are still unacceptably high, we have learned from our recent experience with ammonia that using a wide variety of credible measurement techniques, rather than focusing on one so-called “standard” technique, may be the better way to improve confidence in our estimates.  Whereas the most promising control measures for gaseous emissions continue to be dietary strategies  with management of corral-surface moisture a close second for particulate matter, corral-surface management and moisture management play comparable roles, depending on the mechanical strength of soils and the availability of water, respectively.  The cost per unit reduction of emitted mass attributable to these abatement measures varies as widely as the emissions estimates themselves, so we need to intensify our emphasis on process-based emissions research to (a) reduce the variances in our emissions estimates and (b) mitigate the contingency of prior, empirically based estimates.  As a general rule, although cattle feedyard emission factors may be thought a reasonable starting point for estimating emissions from open-lot dairies, such estimates should be viewed with suspicion.

Purpose          

Document the state of the art of particulate-matter (PM) emissions from open-lot livestock facilities, including emission fluxes and abatement measures.

What did we do?

We conducted (a) field research at commercial, open-lot livestock facilities in the southern High Plains and (b) an up-to-date review of the latest literature concerning primary particulate matter emission fluxes and the abatement measures appropriate to the source type. Field research included time-resolved concentration measurements upwind and downwind of the livestock facilities during the hottest, driest times of the year (in the case of dairy emissions) and throughout the year (in the case of beef feedyards); and a 5-month evaluation of stocking density manipulation using electric cross-fences that preserve optimum bunk space for beef cattle on feed. The literature review surveyed research findings from anywhere in the world that were published in refereed journals as recently as March 2015 concerning the same topics.

What have we learned?

Increasing the stocking density of fed beef cattle as compared to the industry-wide average during hot, dry weather suppresses dust emissions to a measurable and reasonably consistent degree. Concentrations of PM measured downwind of open-lot dairies vary throughout the day, though to a lesser degree and at lower overall concentrations than those measured downwind of nearby beef cattle feedyards, likely reflecting (a) the comparatively lower intensity of the dairy animal’s physical activity and (b) the greater diurnal uniformity of animal-activity patterns in dairies as compared to those in cattle feedyards. Stocking density manipulation does not appear likely to influence dairy dust emissions to the same degree as it influences feedyard dust emissions. Our confidence in emission-flux estimates from these open-lot systems suffers from a lack of methodological diversity; that confidence would be greatly bolstered by the deployment of measurement techniques that differ from the standard inverse-dispersion-modeling paradigm. The integrated horizontal flux (IHF) approach to emissions estimation, which we are now testing at a cattle feedyard in the Texas Panhandle, will provide some corroborating evidence that will allow us to narrow the range of PM flux estimates in the research literature, a range that now spans more than an order of magnitude when expressed on a per-animal-unit basis.

Future Plans

We will continue long-term, ground-level monitoring of time-resolved PM concentrations at a commercial cattle feedyard in the Texas Panhandle; continue our ongoing tests of the IHF flux-estimation technique; and evaluate eye-safe lidar as a path-averaging monitoring technology for the intermediate path lengths (50-300m) that will permit experimental discrimination of concentration data downwind of adjacent pen areas featuring different dust-abatement measures.

Authors    

Brent Auvermann, Professor, Texas A&M AgriLife Extension Service b-auvermann@tamu.edu

K. Jack Bush and Kevin R. Heflin, Research Associates, Texas A&M AgriLife Research

Additional information              

6500 Amarillo Blvd. West, Amarillo, TX 79106-1796, (806)670-8081 (cell)

Acknowledgements      

USDA-NIFA Contract Nos. 2010-34466-20739 and 2009-55112-05235; Texas A&M AgriLife Research; JBS Five Rivers Cattle Feeding; Texas Air Research Center; Texas Cattle Feeders Association

The authors are solely responsible for the content of these proceedings. The technical information does not necessarily reflect the official position of the sponsoring agencies or institutions represented by planning committee members, and inclusion and distribution herein does not constitute an endorsement of views expressed by the same. Printed materials included herein are not refereed publications. Citations should appear as follows. EXAMPLE: Authors. 2015. Title of presentation. Waste to Worth: Spreading Science and Solutions. Seattle, WA. March 31-April 3, 2015. URL of this page. Accessed on: today’s date.