A brief summary of the manuscript, Alternatives to Antibiotics: Why and How (Allen, 2017), a review of current and potential alternatives to antibiotics for use in human or veterinary medicine.
Key Takeaways:
Every time antibiotics are used, impacted bacteria adapt to survive. Bacteria that are not killed by the antibiotic pass on their new survival traits to later generations of bacteria, which limit the effect of the antibiotic the next time it is used.
Antibiotics are not the only way to treat bacterial diseases. Alternative treatment methods to consider include vaccines, immunotherapeutics, bacteriophage therapy, and probiotics.
For the equine industry, concerns about ammonia (NH3) levels in the barn environment are multifaceted and include issues of animal welfare, animal and human health, and environmental impacts. In Florida, many performance horses are housed in stalls at least part of the day as are horses with allergic skin conditions and/or pasture associated asthma. The warm and humid climate produces favorable conditions for ammonia generation and fly emergence. Previous research has demonstrated the effectiveness of sodium bisulfate in lowering floor substrate and bedding pH, reducing ammonia concentrations, and fly populations in livestock facilities (poultry houses and dairies)1,2. However, research on application of sodium bisulfate in equine facilities is limited to two studies conducted in the northeastern United States3.
What did we do?
The objective of this pilot study was to determine the effects of sodium bisulfate (PLT®) application in a north central Florida equine facility on bedding pH, NH3 concentration, and fly counts. Four 12 x 12 ft stalls in a 20-stall barn were used, 2 control (CON) and 2 treated with sodium bisulfate (SB), individually housing mature geldings. Data were collected during the third week of August, 2018. Stalls were initially bedded with 67 lbs of wood shavings. Amount of product initially added to SB stalls was 14 lbs (manufacturer recommended application rate of 100 lbs/1,000 sqft) followed by 7 lbs daily for 4 days. Horses were housed in stalls overnight (12 hours/day) and stalls cleaned (manure and wet bedding removed) once/day. An aspirating pump and gas detection tubes (Kitagawa, Japan) were used to determine NH3 concentration before stall cleaning (AM measurement), to allow for manure and urine accumulation, and 10 hours post stall cleaning (PM measurement). Three 5-gallon buckets were placed over the stall surface in a triangular pattern to standardize airflow and the location of each bucket was marked to allow replication across AM and PM readings. OnSet HOBO loggers were used to monitor temperature and relative humidity. Fly traps containing no fly attractant, were suspended 8 feet above the floor in the center of each stall to determine fly counts.
What Have We Learned?
Background (cleaned stalls without bedding material; rubber mats only) and baseline (bedded stalls) NH3 concentrations were < 5 ppm and not different between SB and CON stalls. NH3 concentrations had a cumulative effect and were greater on day 3 (69.8 ppm) compared to day 1 (< 5 ppm) and day 2 (16.7 ppm). NH3concentrations were greater in CON stalls (28.6 ppm) compared to SB stalls (< 5 ppm). Bedding pH was lower in SB stalls (1.82) compared to CON stalls (6.16) demonstrating an overall treatment effect, but pH of the bedding increased over the duration of the study. The number of flies caught in traps did not differ between treatments, although fly counts did increase over time. Reductions in pH and NH3 observed in the present study were comparable to previous studies. We expected reductions in flies in stalls treated with SB, however, fly counts were extremely low overall and a different approach for quantifying fly numbers may be necessary.
Future Plans
Future research directions include testing different application rates for equine stalls and determining efficacy of SB with different bedding types. Additional studies to investigate the effectiveness of SB in mitigating NH3emissions in equine facilities4 and reducing fly populations and bacteria in stalls should be pursued. There is also potential to assess the benefits of SB application near manure storage areas on equine operations.
Corresponding author, title, affiliation and email
Carissa Wickens, Extension Equine Specialist, University of Florida. cwickens@ufl.edu
Other authors: Jill Bobel, Biological Scientist, University of Florida; Danielle Collins, Graduate Student, University of Florida; Alex Basso, Graduate Student, University of Florida
Additional information:
1Johnson, T. M. and B. Murphy. 2008. Use of sodium bisulfate to reduce ammonia emissions from poultry and livestock housing. Proceedings of the Mitigating Air Emissions from Animal Feeding Operations Conference, Des Moines, IA. Iowa State University, pp. 74-78.
2Sun, H., Y. Pan, Y. Zhao, W. A. Jackson, L. M. Nuckles, I. L. Malkina, V. E. Arteaga and F. M. Mitloehner. 2008. Effects of sodium bisulfate on alcohol, amine, and ammonia emissions from dairy slurry. J. Environmental Quality 37:608-614.
3Sweeney, C.R., S.M. McDonnell, G.E. Russell, and M. Terzich. 1997. Effect of sodium bisulfate on ammonia concentration, fly population, and manure pH in a horse barn. Am. J. Vet. Res. 57(12):1795-1798.
Additional information regarding this project is available by contacting Carissa Wickens (cwickens@ufl.edu), or Jill Bobel (jbrides2@ufl.edu).
Acknowledgements:
The authors wish to thank Dr. Josh Payne, Technical Services Manager, Jones-Hamilton Company, Agricultural Division, and Dr. Hong Li, Associate Professor, Department of Animal and Food Sciences, University of Delaware for providing technical expertise and support for this project. We would also like to thank Carol Vasco, Tayler Hansen, Agustin Francisco, and Claudia Lopez for their assistance with data collection.
Figure 1: Placement of buckets over the stall floor for measurement of NH3 concentrations. The ammonia pump with attached gas detection tube was placed through a small hole drilled into the top of each bucket.Figure 2: Average daytime and nighttime temperatures and percent relative humidity during the study period.
The authors are solely responsible for the content of these proceedings. The technical information does not necessarily reflect the official position of the sponsoring agencies or institutions represented by planning committee members, and inclusion and distribution herein does not constitute an endorsement of views expressed by the same. Printed materials included herein are not refereed publications. Citations should appear as follows. EXAMPLE: Authors. 2019. Title of presentation. Waste to Worth. Minneapolis, MN. April 22-26, 2019. URL of this page. Accessed on: today’s date.
The Michigan Agriculture Environmental Assurance Program (MAEAP) is a holistic approach to environmental protection. It helps farmers evaluate their entire operation, regardless of size or commodity, and make sustainable management decisions balancing society’s needs, the environment, and economics. MAEAP is a partnership effort that aims to protect natural resources and build positive communities by working with farmers on environmentally responsible agricultural production practices.
To become MAEAP verified, farmers must complete three comprehensive steps: educational seminars, an on-farm risk assessment, and development and implementation of an action plan addressing potential environmental risks. The Michigan Department of Agriculture and Rural Development (MDARD) conducts an on-farm inspection to verify program requirements related to applicable state and federal environmental regulations, including the Generally Accepted Agricultural and Management Practices (GAAMPs). MAEAP benefits Michigan by helping to protect the Great Lakes by using proven scientific standards to improve air, water, and soil quality. Annual phosphorus reduction through MAEAP is over 340,451 pounds per year which is enough to grow almost 85,104 tons of algae in lakes and streams. Farming is an environmentally intense practice and the MAEAP-verification process ensures farmers are making choices that balance production and environmental demands. The measures aimed at protecting air, soil, water, and other environmental factors mean that MAEAP-verified farmers are committed to utilizing farming practices that protect Michigan’s natural resources.
Purpose
The Michigan Agriculture Environmental Assurance Program (MAEAP) is an innovative, proactive program that assists farms of all sizes and all commodities voluntarily prevent or minimize agricultural pollution risks. MAEAP is a collaborative effort of farmers, Michigan Department of Agriculture and Rural Development, Michigan Farm Bureau, commodity organizations, universities, conservation districts, conservation groups and state and federal agencies. MAEAP teaches farmers how to identify and prevent environmental risks and work to comply with state and federal environmental regulations. Farmers who successfully complete the three phases of a MAEAP system (Farmstead, Cropping or Livestock) are rewarded by becoming verified in that system.
What Did We Do?
To become MAEAP-verified, farmers must complete three comprehensive steps: educational seminars, a thorough on-farm risk assessment, and development and implementation of an action plan addressing potential environmental risks. The Michigan Department of Agriculture and Rural Development (MDARD) conducts an on-farm inspection to verify program requirements related to applicable state and federal environmental regulations, including the Generally Accepted Agricultural Management Practices. To retain MAEAP verification, a farm must repeat all three steps including MDARD inspection every three years.
Local MAEAP farm verified in the Cropping System
What Have We Learned?
The MAEAP program is positively influencing Michigan producers and the agriculture industry. Annually, an average of 5,000 Michigan farmers attend an educational session geared toward environmental stewardship and MAEAP verification. To date, over 10,000 farms are participating with over 1,500 MAEAP verifications. On a yearly basis, over $1.2 million is spent for practice implementation by producers working towards MAEAP verification. In 2012; the sediment reduced on MAEAP-verified farms could have filled 28,642 dump trucks (10 yards each), the phosphorus reduced on MAEAP farms could have grown 138,056 tons of algae in surface waters, and the nitrogen reduced on MAEAP farms could have grown 45,515 tons of algae in surface waters.
An example of the partnership between MAEAP and Michigan Farm Bureau
Future Plans
Michigan Governor Rick Snyder has taken a vested interest in the value of the MAEAP program. In March of 2011, Governor Snyder signed Public Acts 1 and 2 which codify MAEAP into law. This provides incentives and structure for the MAEAP program. It is a goal of Governor Snyder’s to have 5,000 farms MAEAP-verified by 2015. Most importantly, through forward thinking MAEAP strives to connect farms and communities, ensure emergency preparedness and protect natural resources.
Authors
Jan Wilford, Program Manager, Michigan Department of Agriculture & Rural Development – Environmental Stewardship Division, wilfordj9@michigan.gov
Shelby Bollwahn, MAEAP Technician – Hillsdale Conservation District
The authors are solely responsible for the content of these proceedings. The technical information does not necessarily reflect the official position of the sponsoring agencies or institutions represented by planning committee members, and inclusion and distribution herein does not constitute an endorsement of views expressed by the same. Printed materials included herein are not refereed publications. Citations should appear as follows. EXAMPLE: Authors. 2013. Title of presentation. Waste to Worth: Spreading Science and Solutions. Denver, CO. April 1-5, 2013. URL of this page. Accessed on: today’s date.
Why Study Health of Pigs In Relation to Greenhouse Gas (GHG) Emissions?
Our working hypothesis is that immune activation, from clinical and subclinical disease, reduces growth performance and concomitantly increases nutrient excretion and subsequent GHG emissions from manure management.
Findings from this project will provide validated information for incorporation into the animal physiology models.
Project Objectives
Vaccination/PRRSV Trials
Evaluate impact of Porcine Reproductive and Respiratory Syndrome Virus (PRRSV) exposure and vaccination on animal performance, manure output and composition, and greenhouse gas (GHG) emissions from stored manure.
Antibiotics and Antibiotic Alternatives
Evaluate the effects of health status on GHG emissions and carbon and water footprints
Salmonella
Evaluate effects of health status (Salmonella) on animal performance, manure output and composition, and GHG emissions from stored manure.
Research Summary: What Have We Done? What Have We Learned?
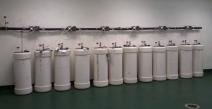
Manure reactors installed at Virginia Tech for the pilot study. The manifold on the wall distributes a constant stream of air to each bioreactor, and forces gas through the exhaust lines into the gas analyzers
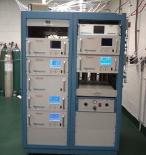
Thermo Scientific analyzers for carbon dioxide (CO2), methane (CH4), nitrous oxide (N2O), mono-nitrogen oxides (NOx), ammonium (NH4), and hydrogen sulfide (H2S). A programmable manifold switch will sample gas from each reactor sequentially throughout the day.
Vaccination/PRRSV
Experimental Design:
Pigs were randomly assigned to a 2 x 2 factorial design investigating the interaction of Porcine Reproductive and Respiratory Syndrome Virus (PRRSV) vaccination (with or without) and exposure to the PRRSV. One week after weaning, pigs were treated intramuscularly with 2.0 mL of a commercial PRRSV vaccine (Ingelvac PRRS MLV) or sterile saline and housed 4/pen (2 barrows and 2 gilts). Pigs were inoculated 3 weeks after vaccination with sterile medium or PRRSV (MN184). This vaccination protocol has provided high protection against experimental PRRSV infection. (Thacker et al., 2000). Blood samples were collected from pigs upon arrival to the biosafety laboratory to corroborate PRRSV-naïve status. Pigs were given antibiotic-free diets that meet or exceed all nutrient recommendations (NRC, 1998). Growth performance, manure output and composition, and GHG emissions were determined from manure collected from each pen. The study was carried-out for 4 weeks after PRRSV inoculation and used a total of 3 experimental units (i.e., pens) per treatment (i.e., 48 pigs in total). The mitigation strategy tested was the effect of vaccination on pig growth and GHG emissions.
Porcine Reproductive and Respiratory Syndrome Virus (PRRSV) infection caused significant reductions in feed intake which led to reductions in rates of gain and body weight. The infection also caused a reduction in diet digestibility leading to greater manure nutrient output per unit of feed intake and increased greenhouse gas (GHG) production from the stored manure. The impact on GHG production is particularly striking when the data are expressed as litters of gas per kilogram of body weight gain. The increased gas production combined with reduced rates of gain results in more than a tripling of gas production per unit of gain for all of the gases. Vaccination against PRRSV appeared to offer little benefit in terms of animal performance, manure nutrient output, or gas production from manure. Results of the gas production data are presented in Table 1.
Antibiotics and Antibiotic Alternatives
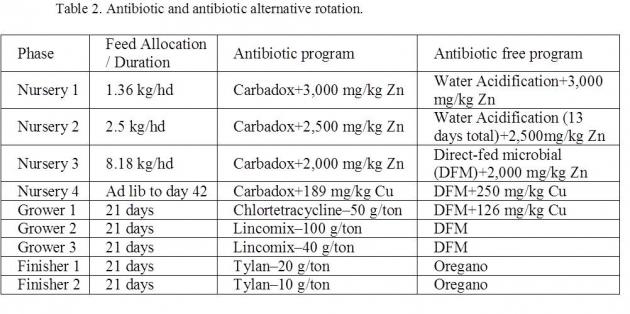
Experimental Design: Seven hundred twenty-four, mixed sex pigs were placed in 11 rooms at the SERB to determine the effects of rearing pigs without antibiotics on growth performance. Pigs were blocked by (body weight) BW and gender and allotted to room and pen with 10/11 mixed-sex pigs/pen. Control pigs consumed diets (Table 2) containing antibiotics and were treated with injectable antibiotics when deemed necessary. Antibiotic-free animals consumed diets with alternatives to antibiotics and received no injectable antibiotics. If sick animals did not respond to antibiotic alternatives, they were removed from the experiment.
Pigs were weighed at the start and end of each dietary phase, and mortality and morbidity were recorded daily. Data were analyzed using the general linear model (GLM) procedure in SAS (statistical software). During the nursery phase, control pigs grew faster (P<0.02; 0.449 vs 0.426 kg/d), and consumed more feed (P<0.05; 0.694 vs. 0.660 kg/d) than antibiotic free animals, resulting in similar (gain to feed ratio) G:F.
Similar average daily gain (ADG), average daily feed intake (ADFI) and G:F were observed throughout the grower phases, and therefore the increased BW of control-fed pigs was maintained and tended (P=0.06) to be heavier at the start of the finisher phases (86.0 vs. 84.5 kg). However, antibiotic-free animals grew 3% faster (P<0.01) and had 6% better G:F (P<0.001) in the finisher phases.
As a result, there was no overall effect (P>0.10) of treatment on ADG, but there was a trend (P = 0.08) for increased ADFI (2.11 vs. 2.07 kg) and reduced (P<0.05) G:F (0.518 vs. 0.527) in control pigs compared to antibiotic-free. Thirty antibiotic-free animals (8.3%) were removed from the study compared to 11 control (3.0%). In conclusion, antibiotic-free management can yield a similar growth performance to conventional systems, but the limited disease treatment options may limit the number of pigs marketed under this management system.
Salmonella Trial
Experimental Design:
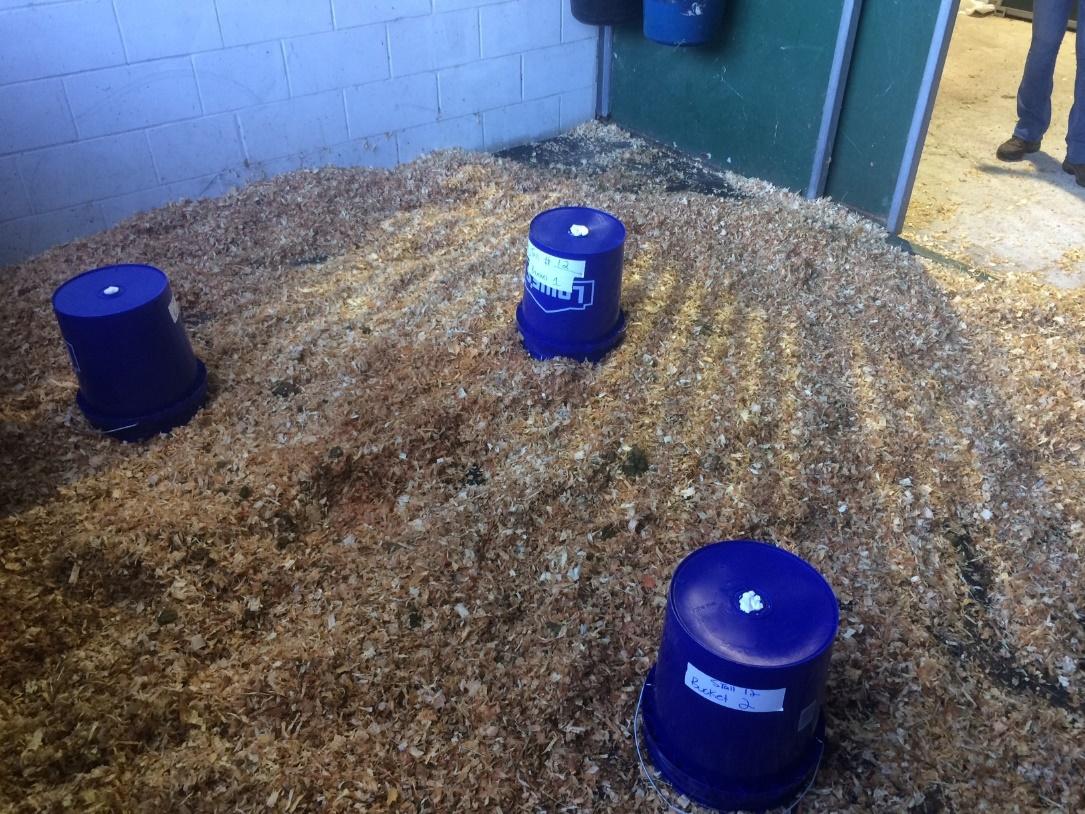
The objective of the study was to determine the impacts of a dirty environment leading to increased pathogen load and salmonella infection on animal performance, manure output and composition, and GHG production from the stored manure. 24 3-week old pigs were transported from the VT swine facility to the Biosafety Laboratory on campus and randomly allotted to one of the following health statuses: 1) High (clean room); 2) Medium (replicated clean on-farm environment); 3) Low (replicated “dirty” farm environment); or 4) Low + Salmonella challenge. Pigs were housed in individual metabolism stalls and fed the same antibiotic free diet as for the VT PRRSV trial. All pigs were assessed for fecal salmonella shedding which is indicative of an active infection upon arrival and found to be negative, and the feed was checked for salmonella contamination and found to be negative. After 10 days of adjustment (31 d of age), pigs allotted to the infected group were orally inoculated with 1×10^9 CFU of Salmonella enterica serotype enterica serovar Typhimurium strain DT104 (ATTC; BAA-185, Manassas, Virginia), and pigs were monitored for growth rate and fecal output and composition for an additional 24 d. Manure was collected each day and the loaded into the manure storage containers. Gas production from the storage containers was assessed continuously throughout the day every other day for the duration of the experiment plus an additional 11 days after the animal trial ended.
Pig inoculated with salmonella exhibited elevated rectal temperatures for 4 d post-innoculation, and shed salmonella in feces for the full 19 days that fecal shedding was monitored. Maintaining pigs in a dirty environment (heavy fecal contamination of the pens) and salmonella infection resulted in equal reductions in the rate of gain and numerical reductions feed efficiency as compared to control animals housed in a clean environment. Emissions of methane from stored manure per unit of weight gain was increased for both the dirty group and the salmonella group by more than 3 fold; and emissions of CO2 and N2O were increased by almost 50% for the dirty group and by 2 fold for the salmonella group.
The effect of Salmonella infection on the gut microbiome are currently being determined. Correlations between greenhouse gas production and key microbial population members will be determined.
The impact of PRRSV and salmonella infections on feed intake was modeled as a time dependent process relative to initial infection and incorporated into the NRC growth model. Although PRRSV vaccination is not completely effective, it did provide partial protection which modified the time course of the infection. The PRRSV vaccination effect was also modeled as a time dependent process which was additively applied to the disease equation. The model predicted intake and growth depressions for both pathogens and the effect of vaccination with minimal mean and slope bias indicating the model represented the data well. Surprisingly the salmonella equation also did well in describing the negative effects of an e-coli infection suggesting that it could be used to predict the effects of other digestive pathogens. The reductions in feed intake explained all of the changes in animal performance, and thus no additional equations were required to simulate potential decreases in diet digestibility or increases in animal maintenance requirements.
The modified model was incorporated into the grower submodel of the overall barn model to allow simulations of PRRSV and salmonella infections and PRRSV vaccination.
The Swine Environmental Research Building (SERB)
The Swine Environmental Research Building (SERB) is set up at a scale that can validate the results of pilot scale studies done elsewhere. It houses 720 pigs in 12 rooms with 6 pens per room and 10 pigs per pen. Manure is quantitatively collected and stored in a deep pit under each side of the room (3 pens of 10 pigs each). The two manure pits in each room are divided by a wall under the central walkway. The building is equipped with a centralized laboratory capable of monitoring GHG emissions from each independently ventilated room. Pigs will be supplied by Purdue or obtained from a commercial source at weaning, blocked by weight and sex and randomly assigned to treatments.
To provide the best experiences, we use technologies like cookies to store and/or access device information. Consenting to these technologies will allow us to process data such as browsing behavior or unique IDs on this site. Not consenting or withdrawing consent, may adversely affect certain features and functions.
Functional
Always active
The technical storage or access is strictly necessary for the legitimate purpose of enabling the use of a specific service explicitly requested by the subscriber or user, or for the sole purpose of carrying out the transmission of a communication over an electronic communications network.
Preferences
The technical storage or access is necessary for the legitimate purpose of storing preferences that are not requested by the subscriber or user.
Statistics
The technical storage or access that is used exclusively for statistical purposes.The technical storage or access that is used exclusively for anonymous statistical purposes. Without a subpoena, voluntary compliance on the part of your Internet Service Provider, or additional records from a third party, information stored or retrieved for this purpose alone cannot usually be used to identify you.
Marketing
The technical storage or access is required to create user profiles to send advertising, or to track the user on a website or across several websites for similar marketing purposes.


 Our working hypothesis is that immune activation, from clinical and subclinical disease, reduces growth performance and concomitantly increases nutrient excretion and subsequent