AgSTAR is a collaborative voluntary program of the Environmental Protection Agency (EPA) and United States Department of Agriculture (USDA). AgSTAR promotes the use of anaerobic digestion (AD) systems to advance economically and environmentally sound livestock manure management. AgSTAR has strong ties to industry, government, non-profit and university stakeholders and assists those who enable, purchase or implement anaerobic digesters by identifying project benefits, risks, options and opportunities.
Anaerobic digestion (AD) continues to be a sustainable manure management opportunity with growing interest in innovative business models for project development. AD systems provide a number of benefits, including improved nutrient management, locally sourced renewable energy, and diversified revenue streams for farmers. As energy prices remain low across the country, and interest grows in managing food waste and organics outside of landfills, new business models have been implemented to make these on-farm AD projects viable. This presentation will provide a national overview of the livestock AD sector, explore new AD projects across the U.S., and highlight successful projects with innovative business models.
The presentation will cover several case studies of AD projects on topics including:
Third-party ownership and development of projects;
Food waste collection and boosting project profitability through tip fees and increased biogas production;
Eco-market products from dairy manure fibers; manure-based alternatives to peat moss for the horticulture industry; and
Biogas to vehicle fuel; opportunities and financial considerations.
With only 244 operating on-farm AD projects across the U.S., there exists a great opportunity for market share growth at the approximately 8,000 farms that could support a project. This, coupled with the desire for alternative management of organic waste streams, provides a unique opportunity for this sector to grow in the near future.
To better understand how dairy agriculture can reduce its impact on climate change, the USDA has supported a large, transdisciplinary research project to examine dairy production systems across the Great Lakes region of the United States. The goals of the Sustainable Dairy Coordinated Agricultural Project are to identify where in the life cycle of a dairy system can beneficial management practices (BMP) be applied to reduce greenhouse gases (GHG) without sacrificing productivity or profit to the farmer. Since 2013, a team of 70 researchers has been collaborating across institutions and disciplines to conduct the investigations.
What did we do?
Experimental data were collected at the cow, barn, manure, crop and soil levels from 2013-2016 by agricultural and life scientists. Modelers continue to conduct comparative analyses of process models at the animal, field and farm scales. Atmospheric scientists have down-scaled global climate models to the Great Lakes region and are integrating climate projections with process modeling results. The Life Cycle Assessment team is evaluating select beneficial management practices to identify where the greatest reduction of greenhouse gases (GHG) may occur. Results of focus groups and farmer surveys in Wisconsin and New York will help us understand how producers currently farm and what types of changes they may be willing to implement, not just to reduce emissions but to adapt to long-term changes in climate.
What have we learned?
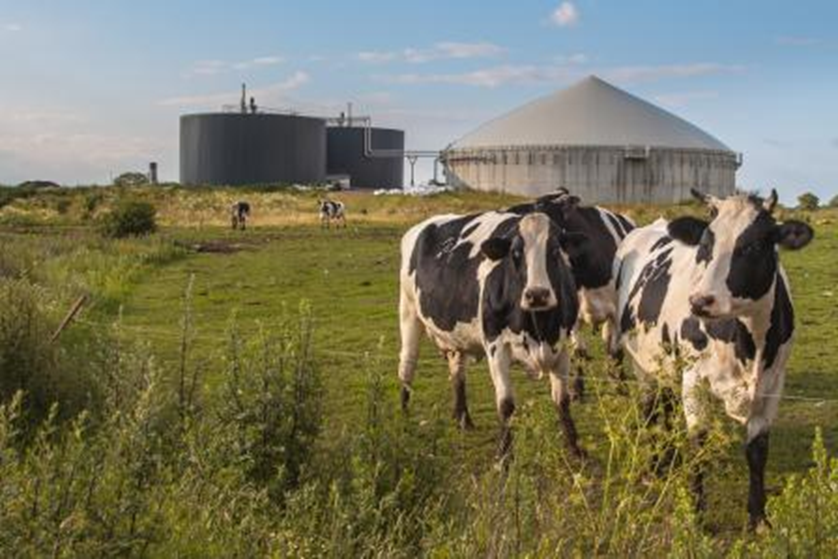
Through the Dairy CAP grant, researchers have developed and refined the best ways to measure GHG emissions at the cow, barn, manure, crop and soil levels, and these data are archived through the USDA National Agricultural Library. Results show that the greatest levels of methane produced on a farm come from enteric emissions of the cow and changes in the diet, digestion and genetics of the cow can reduce those emissions. Another significant source of methane—manure production, storage and management—can be substantially reduced through manure management practices, particularly when it is processed through an anaerobic digester. Changes in timing of nitrogen application and use of cover crops practices are found to improve nitrogen efficiency and reduce losses from the field.
A comparative analysis of process models showed multiple differences in their ability to predict GHG emissions and nutrient flow (particularly nitrogen dynamics) at the animal, farm, and field scales. Field data collected were used to calibrate and refine several models. The Life Cycle Assessment approach shows that a combination of BMPs can reduce GHG emissions without sacrificing milk production. The application of down-scaled climate data for the Great Lakes region is being used in conjunction with the suite of BMPs to develop mitigation and adaptation scenarios for dairy farming in the Upper Midwest.
Research findings are shared through a series of fact sheets available on the project website, and a web-based, virtual farm that presents educational materials for 150- and 1500-cow operations to a variety of audiences, ranging from high school students to academics.
Future Plans
The Dairy CAP grant sunsets in 2018, but research questions remain relative to the efficacy of beneficial management practices at different stages in the life cycle of a farm. Challenges revolve around the complexity of farming practices, the individuality of each farm and how it is managed, and uncertainty associated with the predictive capabilities of models. Mitigation and adaptation strategies will be shared with the dairy industry, educators and extension partners who will be responsible for working with farmers at the field level. Implementation of these strategies will make dairy farming in the Great Lakes region more resilient.
Corresponding author, title, and affiliation
Carolyn Betz, Research Project Manager, University of Wisconsin-Madison. Department of Soil Science
This material is based upon work that is supported by the National Institute of Food and Agriculture, U.S. Department of Agriculture, under award number 2013-68002-20525.
Process-based models are increasingly used as tools for studying complex agroecosystem interactions and N2O emissions from agricultural fields. The widespread use of these models to conduct research and inform policy benefits from periodic model comparisons that assess the state of agroecosystem modeling and indicate areas for model improvement. The increasingly broad application of models requires an assessment of model performance using datasets that span multiple biogeophysical contexts. While limited in the capacity to identify specific areas for model improvement, general evaluations provide a critical perspective on the use of model estimates to inform policy and also identify necessary model improvements that require further evaluation.
What did we do?
The objectives of this model comparison were to i) calibrate and validate three process-based models using a large dataset; ii) evaluate the performance of a multi-model ensemble to estimate observed data; and iii) construct a linear model to identify and quantify possible model bias in the estimation of soil N2O flux from agricultural fields. We selected three models that have been used to evaluate N2O emissions from agricultural fields: DayCent, DNDC, and EPIC. Using data from two field experiments over five years, we calibrated and validated each model using observations of soil temperature (n = 887), volumetric soil water content (VSWC) (n = 880), crop yield (n = 67), and soil N2O flux (n = 896). Our model validations and comparisons consisted of commonly conducted statistical evaluations of root mean squared error, correlation, and model efficiency. Additionally, the large sample sizes used here allowed for more robust linear regression models that offered additional insight into relationships between model estimations and observations of N2O flux. We hypothesized that such a linear model would indicate if there was model bias in estimations of soil N2O flux. Ensemble modeling can reduce the error associated with climate projections and has recently been applied to the estimation of N2O flux from agroecosystems. Thus, we also constructed a multi-model ensemble to evaluate the use of multiple models to improve estimates of soil N2O flux.
What have we learned?
In a comparison of three process-based models, calibration to a large dataset produced favorable estimations of soil temperature, VSWC, average yield, and N2O flux when the models were evaluated using RMSE, R2, and the Nash-Sutcliffe E-statistic. However, an evaluation of linear regression models revealed a consistent bias towards underestimating high-magnitude daily N2O flux and cumulative N2O flux. Observations of soil temperature and VSWC were unable to significantly explain model bias. Calibration to available data did not result in consistent model estimation of additional system properties that contribute to N2O flux, which suggests a need for additional model comparisons that make use of a wide variety of data types. The major contribution of this work has been to identify a potential model bias and future steps required to evaluate its source and improve the simulation of nitrogen cycling in agroecosystems. Process-based models are powerful tools, and it is not our objective to undermine their past and future application. However, more work is left to be done in understanding the biogeophysical system that produces soil N2O and in harmonizing the process-based models that simulate that system and which are used to evaluate management and generate policy.
Future Plans
Future work should test our findings in additional agroecological contexts to determine the extent to which a bias towards underestimating peak N2O flux persists. A meta-analysis of published data may be the most direct method for doing so. New datasets will need to be collected that represent simultaneous observations of multiple system properties (e.g. soil NO3-, soil NH4+, and heterotrophic respiration) from different soil layers and at increased temporal frequencies. Model developers should use these rich datasets to identify the source of N2O estimation bias and improve the structure and function of process-based models.
Corresponding author, title, and affiliation
Richard K. Gaillard, Graduate Student, University of Wisconsin-Madison
Curtis D. Jones, Assistant Research Professor, University of Maryland; Pete Ingraham, Research Scientist, Applied Geosolutions;
Additional information
sustainabledairy.org
Acknowledgements
This material is based upon work that is supported by the National Institute of Food and Agriculture, U.S. Department of Agriculture, under award number 2013-68002-20525. Any opinions, findings, conclusions or recommendations expressed in this publication are those of the author(s) and do not necessarily reflect the view of the U.S. Department of Agriculture.
Additional Authors:
Sarah Collier, Research Associate, University of Wisconsin-Madison;
Roberto Cesar Izaurralde, Research Professor, University of Maryland;
William Jokela, Research Scientist (retired), USDA-ARS;
William Osterholz, Research Associate, University of Wisconsin-Madison;
William Salas, President and Chief Scientist, Applied Geosolutions;
Peter Vadas, Research Scientist, USDA-ARS;
Matthew Ruark; Associate Professor; University of Wisconsin-Madison
The authors are solely responsible for the content of these proceedings. The technical information does not necessarily reflect the official position of the sponsoring agencies or institutions represented by planning committee members, and inclusion and distribution herein does not constitute an endorsement of views expressed by the same. Printed materials included herein are not refereed publications. Citations should appear as follows. EXAMPLE: Authors. 2017. Title of presentation. Waste to Worth: Spreading Science and Solutions. Cary, NC. April 18-21, 2017. URL of this page. Accessed on: today’s date.
This study had the objective of quantifying greenhouse gas (GHG) emissions from different manure management practices and dairy farm sizes. A comparison of the main practices among farm sizes was also conducted to highlight practices that are able to minimize GHG emissions.
What did we do?
First, a survey was sent to Wisconsin dairy farms to collect information on manure management, machinery power, and time of operation. Manure management practices included collection, transportation, storage, land application, and processing (anaerobic digestion (AD), solid-liquid separation (SLS), and sand separation (SS)). Second, modelling tools were used to estimate GHG emissions based on farm size and practice. Four farm sizes have been evaluated: small (1-99 animal units, 1 AU = 1,000 pounds of animal), medium (100-199 AU), large (200-999 AU) and permitted facilities (≥ 1,000 AU).
Three representative farms were modeled for GHG emissions based on survey results: a small farm (75 AU) handling 1.8 ton solid manure/day, a large farm (425 AU) handling 21.7 ton liquid manure/day, and a permitted facility (2,000 AU) handling 140 ton liquid manure/day and with manure processing. In addition, a base case scenario with the most representative practices for each farm size, and a low and a high GHG emitting scenario were modeled to analyze potential mitigation strategies (Table 1).
What have we learned?
Nitrous oxide (N2O) after manure land-application is the major contributor to GHG emissions in small farms (Figure 1). Most small farms land-apply manure daily or have short term storage. Emissions can be reduced by using a barn cleaner instead of a skid steer as it is more efficient in terms of energy consumption. The high emitting scenario in small farms indicates that adding long term storage would increase GHG emissions mostly in the form of methane (CH4) from storage.
Storage is the major contributor to GHG emissions for large farms, where most emissions occur in the form of CH4. Storage CH4 emissions can be reduced by minimizing the storage retention time or by using a cover. Despite that manure storage has implications on air quality, its role is crucial for water quality purposes and therefore, removing the storage structure from the dairy farm is not a feasible option.
Manure processing is an interesting GHG mitigation strategy as shown in the permitted facility scenarios (Figure 1). AD and SLS achieve significant GHG emission reductions, where negative emissions indicate that AD displaces more GHG emissions from the production of grid electricity than the emissions coming from all manure handling processes. Injecting manure instead of surface applying it has proven to reduce ammonia emissions, but it resulted in an increase in N2O emissions in our model.
Future Plans
There is opportunity for future work analyzing data collected in the survey. These data include nutrient use, crop yields, bedding use and replacement, and milk yield and characteristics, which can be analyzed in the context of farm size and management practices.
Corresponding author, title, and affiliation
Aguirre-Villegas, Horacio Andres. Assistant Scientist. Department of Biological Systems Engineering, University of Wisconsin-Madison.
Rebecca Larson. Assistant Professor. Department of Biological Systems Engineering, University of Wisconsin-Madison
Additional information
References
Aguirre-Villegas, Horacio A., and Rebecca A. Larson. 2017. “Evaluating Greenhouse Gas Emissions from Dairy Manure Management Practices Using Survey Data and Lifecycle Tools.” Journal of Cleaner Production 143: 169–79. doi:10.1016/j.jclepro.2016.12.133.
Acknowledgements
This material is based upon work that is supported by the National Institute of Food and Agriculture, U.S. Department of Agriculture, under award number 2013-68002-20525. Any opinions, findings, conclusions or recommendations expressed in this publication are those of the author(s) and do not necessarily reflect the view of the U.S. Department of Agriculture.
The authors are solely responsible for the content of these proceedings. The technical information does not necessarily reflect the official position of the sponsoring agencies or institutions represented by planning committee members, and inclusion and distribution herein does not constitute an endorsement of views expressed by the same. Printed materials included herein are not refereed publications. Citations should appear as follows. EXAMPLE: Authors. 2017. Title of presentation. Waste to Worth: Spreading Science and Solutions. Cary, NC. April 18-21, 2017. URL of this page. Accessed on: today’s date.
Models are basically equations that are based on real-world measurements. Measurements are made in different situations and/or different times. Models are used to make comparisons between different choices or look at “what if” scenarios without having to implement each possible option.
Generally, models that are created with large, diverse (but still compatible) data sets containing relevant information are going to be more reliable than models with smaller data sets with smaller data sets. Models can then be used to predict performance or evaluate changes in a system.
Efficiency. It is expensive and impractical to measure actual emissions from every farm or barn.
Decision-making. Models allow farmers and their advisers to look at “what if?”. Prior to making an expensive decision, farmers can evaluate the location, type of building, manure storage, manure treatment, feed ration, etc. and select the best option.
Measure progress trends. Models can be applied at different points in time to see if a farm or industry is making progress in reducing their impacts.
Are there limitations to models?
Yes. By their very nature, models are a simplified representation of a complex system. Modeling is a balance between complexity (how much information does the user need and how much time will it take?) and accuracy (how much is gained by including additional variables?). The results must be evaluated in their appropriate context. As an example, many TV weather forecasters look at several sources of information, including models when formulating their forecast. While on a given day the forecast may be off (either due to inaccurate analysis or results) it is safe to say that overall, weather forecasting is greatly enhanced by the use of models.
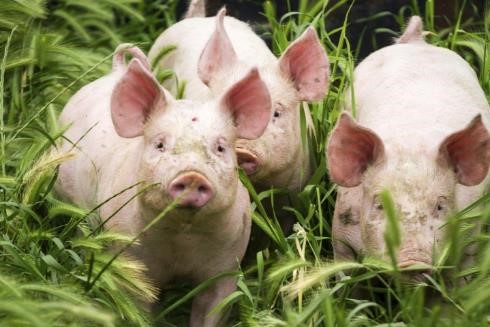
Do you have an example of a model used on pig farms?
One example of a model that is currently looking at the environmental footprint of pork production is the Pork Production Environmental Footprint Calculator. It currently estimates greenhouse gas (GHG) emissions and the day to day costs of the activities that generate those emissions, but research is underway to expand the model to include land, and water footprints–leading to a more comprehensive “environmental footprint” model.
The model referenced above can be used for estimating the GHG emissions from the various operations on a pig farm in order to calculate the farm’s cumulative emissions. It shows where the major contributions arise, and provides a test bed for identifying strategies that reduce emissions at least cost. The model requires input information that most producers will know about their operation such as the type of barn, animal throughput, type and quantity of feed ration used, a physical description of the facilities (size of barn, insulation, fans etc.), the time in the barn, temperature profile for that area, type of manure management system (lagoon, dry lot, pit, etc.). Sample costs for day to day farm activities are provided in the model, but can be updated by the user. The model output includes a summary of feed and energy usage for the simulation, including energy estimates for temperature control (both heating and ventilation) as well as costs.
This information is part of the program “Integrated Resource Management Tool to Mitigate the Carbon Footprint of Swine Produced In the U.S.,” and is supported by Agriculture and Food Research Initiative Competitive Grant no. 2011-68002-30208 from the USDA National Institute of Food and Agriculture. Project website.
Usually when people see the words “algae” and “manure” in the same paragraph, it is usually a negative take on the effects of manure nutrients on water. When excess nutrients are transported to water bodies (from lawn fertilizer, municipal waste treatment plants, manure and/or commercial crop fertilizer) algae use those nutrients and grow rapidly. When the nutrients are no longer sufficient for growth, the algae begins to die and decompose. This depletes oxygen in the water, which can lead to fish kills and other problems for aquatic life.
The same characteristics of algae that can make it a nuisance also make it an innovative way to treat wastewater when grown in an engineered system. The fact that the algae are able to utilize the nutrients within the water to multiply and grow rapidly can be exploited within a managed system to create a potential source of biomass, and serve as a biological mechanism to remove nutrients. The sustained biological activity of algae can also add dissolved oxygen to the water, potentially reducing the direct emissions of methane and nitrous oxide (greenhouse gases) from volatilization of stored manure. Current research is exploring the use of harvested algae as an animal feed, source of biofuel (algal oil production), or biomass in thermal energy production.
A current research project on pig manure and algae as a nutrient removal technology
Author: Rick Field, University of Arkansas and Jill Heemstra, University of Nebraska
Acknowledgements
This information is part of the program “Integrated Resource Management Tool to Mitigate the Carbon Footprint of Swine Produced In the U.S.,” and is supported by Agriculture and Food Research Initiative Competitive Grant no. 2011-68002-30208 from the USDA National Institute of Food and Agriculture. Project website.
There is some research suggesting that separating swine manure into solids and liquids can slightly reduce greenhouse gas (GHG) emissions emitted from the manure itself. It is not likely to be significant enough for separation to be a viable strategy by itself.
The primary reason to use solid-liquid manure separation is to prepare manure for further treatment in a system that can:
Authors: Rick Fields, University of Arkansas and Jill Heemstra, University of Nebraska jheemstra@unl.edu
Acknowledgements
This information is part of the program “Integrated Resource Management Tool to Mitigate the Carbon Footprint of Swine Produced In the U.S.,” and is supported by Agriculture and Food Research Initiative Competitive Grant no. 2011-68002-30208 from the USDA National Institute of Food and Agriculture. Project website.
Animal health does affect greenhouse gas emissions. Sick animals are much less efficient and/or some sick animals may die. In both of these cases, inputs are used but result in less (or no) product at the end. Most inputs, feed, water, climate control, etc. have greenhouse gas emissions associated with them.
Health status can also potentially change the characteristics of animal manure (amount, nutrient content) as feed and water consumption is disrupted. If the change causes manure to have a higher nitrogen content, the manure in storage may directly emit more nitrous oxide, a greenhouse gas.
Every day, farmers must make decisions on management of their pigs on managing health, from vaccinations to biosecurity planning. They need to consider the level of risk, the expense vs benefits, impacts on pig performance, employee time and skills, and impacts on neighbors.
With such a complexity of information and potential outcomes/impacts, more are turning toward decision tools or models to explore the potential ramifications of decisions and compare different scenarios. These models can be used to estimate outcomes such as GHG emissions, environmental impacts, or other outputs.
Key Points – How Does Animal Health Relate to Environmental Footprint?
Emitted GHGs become a net loss to the system if the animal dies, or if the amount of that product (milk, meat, etc) is reduced due to poor animal health status.
Diseases or challenges that reduce productivity (weight gain, number of young born/weaned, milk yield or quality, etc.) tend to reduce efficiency (and increase waste) in the system.
Having accurate data to create decision tools or models will help provide farm decision-makers information to properly evaluate potential impacts and trade-offs as they work to improve efficiency and reduce environmental impacts.
This information is part of the program “Integrated Resource Management Tool to Mitigate the Carbon Footprint of Swine Produced In the U.S.,” and is supported by Agriculture and Food Research Initiative Competitive Grant no. 2011-68002-30208 from the USDA National Institute of Food and Agriculture. Project website.
Even though pig farms are not a large source of greenhouse gases (GHGs), the pork industry (along with many agriculture industries) are looking at GHG emissions to identify areas for improvement.
When carbon footprint is reported, you may see numbers that reflect the total GHG emissions for the entire industry or for individual farms. Sometimes you will see it reported in terms of GHGs emitted per pound of pork produced. This is a very appropriate way to examine an industry’s improvements over time as it standardizes the number against changes in number of animals, number of farms, etc.
There are several areas being researched as ways to reduce GHG emissions:
A National Pork Board report on the total production cycle showed that selection and planning of manure storage systems represents the biggest opportunity for reducing the carbon footprint of a farm. Manure emits methane and some nitrous oxide as it decomposes. Both of these GHGs, especially nitrous oxide, are more potent than carbon dioxide in their ability to trap heat.
The video below, by Rick Ulrich, University of Arkansas provides a summary of different areas that are being studied to develop a tool for pig farms on reducing environmental footprint.
This information is part of the program “Integrated Resource Management Tool to Mitigate the Carbon Footprint of Swine Produced In the U.S.,” and is supported by Agriculture and Food Research Initiative Competitive Grant no. 2011-68002-30208 from the USDA National Institute of Food and Agriculture. Project website.
The Cambridge dictionary defines environmental footprint as:
the effect that a person, company, activity, etc. has on the environment, for example the amount of natural resources that they use and the amount of harmful gases that they produce
Also referred to as an ecological footprint, this is a measure that attempts to consider multiple impacts of an activity rather than focus on a single one. In relation to the swine industry, this foot print takes into account the results of carbon, water, land and air footprints of pig farming.
How do you bring all of these different pieces together? In 2011, the U.S. National Pork Board and many land grant researchers launched a project to develop a science-based decision tool called Pig Production Environmental Footprint Calculator (PPEFC). The PPEFC has the ability to calculate (estimate) impact to greenhouse gas emissions, costs, land use, and water consumption across the pork production chain, including feed formulation and crop production. The combined analysis of all of these factors allows identification of potential ecologically and economically feasible production practices for pork producers.
One of the pieces of this project is developing an environmental footprint, cost, and nutrient database of the US animal feed ingredients and integrating it with the calculator. The calculator is built upon cradle-to-farm gate life-cycle assessment (LCA) of pork production combined with the US National Resource Council (NRC) swine nutrient requirements models (NRC 2012), farm operation inputs, and animal feed database. Farm operation inputs include: barn characteristics, utilities, manure management, dead animal disposal, and farm operation costs. For a description of the inputs, visit this conference presentation at LCA Foods 2014.
Reviewers: Jill Heemstra, University of Nebraska; Karl Vandevender, University of Arkansas
This information is part of the program “Integrated Resource Management Tool to Mitigate the Carbon Footprint of Swine Produced In the U.S.,” and is supported by Agriculture and Food Research Initiative Competitive Grant no. 2011-68002-30208 from the USDA National Institute of Food and Agriculture. Project website.
Manage Cookie Consent
To provide the best experiences, we use technologies like cookies to store and/or access device information. Consenting to these technologies will allow us to process data such as browsing behavior or unique IDs on this site. Not consenting or withdrawing consent, may adversely affect certain features and functions.
Functional
Always active
The technical storage or access is strictly necessary for the legitimate purpose of enabling the use of a specific service explicitly requested by the subscriber or user, or for the sole purpose of carrying out the transmission of a communication over an electronic communications network.
Preferences
The technical storage or access is necessary for the legitimate purpose of storing preferences that are not requested by the subscriber or user.
Statistics
The technical storage or access that is used exclusively for statistical purposes.The technical storage or access that is used exclusively for anonymous statistical purposes. Without a subpoena, voluntary compliance on the part of your Internet Service Provider, or additional records from a third party, information stored or retrieved for this purpose alone cannot usually be used to identify you.
Marketing
The technical storage or access is required to create user profiles to send advertising, or to track the user on a website or across several websites for similar marketing purposes.


 Agricultural Library. Results show that the greatest levels of methane produced on a farm come from enteric emissions of the cow and changes in the diet, digestion and genetics of the cow can reduce those emissions. Another significant source of methane—manure production, storage and management—can be substantially reduced through manure management practices, particularly when it is processed through an anaerobic digester. Changes in timing of nitrogen application and use of cover crops practices are found to improve nitrogen efficiency and reduce losses from the field.
 d collection, transportation, storage, land application, and processing (anaerobic digestion (AD), solid-liquid separation (SLS), and sand separation (SS)). Second, modelling tools were used to estimate GHG emissions based on farm size and practice. Four farm sizes have been evaluated: small (1-99 animal units, 1 AU = 1,000 pounds of animal), medium (100-199 AU), large (200-999 AU) and permitted facilities (≥ 1,000 AU).
 storage. Emissions can be reduced by using a barn cleaner instead of a skid steer as it is more efficient in terms of energy consumption. The high emitting scenario in small farms indicates that adding long term storage would increase GHG emissions mostly in the form of methane (CH4) from storage.