A National Template for Preparing a Dairy Feed Management Plan

Printer friendly version

Introduction

This factsheet has been developed to support the implementation of the Natural Resources Conservation Service (NRCS) Feed Management 592 Practice Standard. The Feed Management 592 Practice Standard was adopted by NRCS in 2003 as another tool to assist with addressing resource concerns on livestock and poultry operations. Feed management can assist with reducing the import of nutrients to the farm and reduce the excretion of nutrients in manure.

The Feed Management 592 Practice Standard adopted by NRCS is defined as “managing the quantity of available nutrients fed to livestock and poultry for their intended purpose.” The national version of the practice standard can be found in a companion factsheet entitled An Introduction to Natural Resources Conservation Service (NRCS) Feed Management Practice Standard 592. Please check your state-specific version of the standard.

The national Feed Management Education Team has developed a systematic five-step development and implementation process for the Feed Management Practice Standard. A complete description of the five steps can be found in a companion factsheet entitled Five Steps to the Development and Implementation of a Feed Management Plan.

The fourth step of this process focuses on the development of the Feed Management Plan. Key participants at Step 4 are the producer and his nutritionist. The key tools to be used at Step 4 are the Feed Management Plan (FMP)Checklist and the Feed Management Plan Template.

Please check this link first if you are interested in organic or specialty dairy production

Using the Feed Management Plan Template

The Feed Management Plan, or FMP, is intended to assist the producer with documentation of those practices that affect whole-farm nutrient management and contribute toward achieving nutrient balance at a whole-farm level. Nitrogen and phosphorus are the two nutrients that are required to be managed as part of the FMP in a Comprehensive Nutrient Management Plan.

When nitrogen and phosphorus imports exceed nitrogen and phosphorus exports, there is an imbalance at a whole-farm level. These imbalances can lead to impaired water quality in nearby water bodies due to both surface runoff and leaching of nutrients to groundwater. Excess nitrogen can also be volatilized and contribute to impaired air quality. Potassium is a nutrient that can lead to production and health problems if it is not monitored in dairy rations, therefore, it is also included as a nutrient to monitor.

The FMP template is designed to provide a common format to address all areas noted in the Feed Management 592 Practice Standard. It is organized with the following sections:

  • Contact information
  • General purpose and background information about the 592 standard
  • Specific purpose selection for the operation
  • When the plan was written
  • When the plan will be reviewed
  • Specific farm information for use with the electronic manure excretion estimator tool
  • Summary of feeding practices and equipment/technologies utilized on the farm
  • Record keeping
  • Recommendations

Estimate of Manure Nutrient Excretion

As part of the FMP, the impact that feed management will have on manure volume and nutrient content is estimated. The specific farm information section has been included to collect farm-specific descriptive information for use with the electronic manure excretion estimator tool. This tool is described in a companion factsheet entitled Estimating Manure Nutrient Excretion.

Feed Management Practices

This section should include a list and narrative of those practices that have been adopted. One way to document practices is to insert a copy of the completed Feed Management Plan Checklist. Proprietary information or specific ration formulations need not be included.

Guidance Sections

There are two important sections of the FMP that should contain specific guidance about sampling and analysis procedures, these are:

  • Record of feed sampling and feed analysis
  • Final recommendations

By following this link you will find a blank copy of the Feed Management Plan Template (PDF file). Additionally, a Completed Feed Management Plan (PDF file) is available as an example.

Related Files

To follow the references in this article, it is recommended that you print these PDF files and refer to them at the appropriate places.
Feed Management Plan Template
Example Feed Management Plan (Dairy).

Disclaimer

This factsheet reflects the best available information on the topic as of the publication date. Date 5-25-2007

This Feed Management Education Project was funded by the USDA NRCS CIG program. Additional information can be found at Feed Management Publications.

Image:Feed mgt logo4.JPG

This project is affiliated with the Livestock and Poultry Environmental Learning Center.

Image:usda,nrcs,feed_mgt_logo.JPG

Project Information

Detailed information about training and certification in Feed Management can be obtained from Joe Harrison, project leader, jhharrison@wsu.edu, or Becca White, project manager, rawhite@wsu.edu.

Author Information

Joe Harrison, Becca White, Lynn Johnson-VanWieringen, and Ron Kincaid, Washington State University
Mike Gamroth, Oregon State University
Tamilee Nennich, Texas A&M University
Deb Wilks, Standard Nutrition

Partners

Logos2.JPG


Acknowledgments

This Feed Management Education Project was funded by the USDA NRCS CIG program. Additional information can be found at Feed Management Publications.
This project is affiliated with the Livestock and Poultry Environmental Learning Center

usda,nrcs,feed_mgt_logo.JPG


“Extension programs and policies are consistent with federal and state laws and regulations on nondiscrimination regarding race, sex, religion, age, color, creed, national or ethnic origin; physical, mental or sensory disability; marital status, sexual orientation, or status as a Vietnam-era or disabled veteran. Evidence of noncompliance may be reported through your local Extension office.”

Estimating Manure Nutrient Excretion

Printer friendly version

Introduction

This fact sheet has been developed to support the implementation of the Natural Resources Conservation Service Feed Management 592 Practice Standard. The Feed Management 592 Practice Standard was adopted by NRCS in 2003 as another tool to assist with addressing resource concerns on livestock and poultry operations. Feed management can assist with reducing the import of nutrients to the farm and reduce the excretion of nutrients in manure.

The Natural Resources Conservation Service has adopted a practice standard called Feed Management (592) and is defined as “managing the quantity of available nutrients fed to livestock and poultry for their intended purpose”. The national version of the practice standard can be found in a companion fact sheet entitled “An Introduction to Natural Resources Feed Management Practice Standard 592”. Please check in your own state for a state-specific version of the standard.

Please check this link first if you are interested in organic or specialty dairy production

Estimating Manure Nutrient Excretion

The front and back end of an animal is connected. While this principle seems obvious, it has historically been ignored in nutrient planning procedures. This fact sheet describes tools that allow integration of feed management and animal performance into nutrient planning processes for animal feeding operations.

A new standard published by the American Society of Agricultural and Biological Engineers (D384.2, Manure Production and Characteristics) is a tool for developing farm specific Comprehensive Nutrient Management Plans (CNMP). This standard allows accurate estimates of nutrient and solids excretion reflective of feed programs and animal performance. Accurate estimates of manure excretion are critical to estimating land requirements and land application costs, sizing manure storage, and planning treatment technologies. This fact sheet will introduce the new manure excretion standard and its application.

Contents of the Manure Production Standard

An ASABE committee of animal scientists and agricultural engineers developed predictive equations for estimating manure excretion for five species (beef, dairy, horse, poultry, and swine) and “typical” characteristics for excreted and as-removed manure. The standard is found at ASABEfollowed by a search of “Standards” and “Title” options for “Manure Production”. The ASABE standard includes seven sections.

Section 1 lists a new “typical” characteristics tabular summary for individual species and groupings of animals. See Tables 1 and 2.(PDF file) These values should provide a reasonable estimate of excretion for animals in the year 2000. As time passes, published typical values become less accurate and should be used with caution for individual herds or flocks. Differences in genetics, feed program, and animal performance between individual farms create a potential for errors when typical values are applied. They may have value for preliminary nutrient planning estimates but should NOT be used in final farm-specific nutrient management plans.

Sections 2 through 7 define the equations for cattle, dairy cattle, horses, poultry (separate sections for meat birds and layers), and swine, respectively. Equation based estimates are provided for all species groups for dry matter, N and P excretion. Equations for estimating additional characteristics are available for some species.

Section 8 of the new standard summarizes As-Removed manure characteristics. The work group summarized a wide range of data sets for inclusion in this section. These values can be beneficial for estimating storage volumes and manure application rates when no other farm-specific information is available. However, when farm specific manure samples are available, they are preferred.

Two Approaches for Estimating Excretion

Two distinctly different approaches were used equation based estimates of excretion. The beef, swine, and poultry work groups used an animal mass balance approach (Figure 1). Excretion is estimated as a difference between feed nutrient intake and retention in body mass or animal products (eggs or milk). intake and retention in body mass or animal products (eggs or milk). The dairy and horse work groups used existing data sets as a basis for multi-variable regression analysis. The dairy work group proposed equations for lactating cows, dry cows and heifers. The horse work group chose to publish separate equations for exercised and sedentary horses. See Table 1. Estimated typical manure (urine and feces combined) characteristics as excreted by meat-producing livestock and poultry.(PDF file) Diet based numbers are in BOLD. Source ASAE D384.2 March 2005, Manure Production and Characteristics.

Figure 1. Mass balance approach was used for estimating excretion haracteristics for beef cattle, swine and poultry.

Factors Affecting Nutrient Excretion

The new standard defines the relationship between feed inputs and animal performance and manure excretion characteristics. For example, the quantity of solids excreted is directly tied to the dry matter digestibility of the diet. Since dry matter digestibility for many species is often 80 to 85% (15 to 20% of solids in feed excreted in feces), small changes in dry matter digestibility produce large differences in solids excreted. A dietary modification that changes dry matter digestibility change from 85% to 80% results in 33% more solids in the feces. Similarly, dietary intake of protein and phosphorus is directly related to excreted N and P.

Historically, manure excretion estimates have been based upon standards published by the ASABE, USDA Natural Resources Conservation Service, and Midwest Plan Service. These previous standards varied excretion estimates with species and animal weight only. A linear relationship was assumed between excretion and body weight. However, this approach provides a poor explanation of important biological factors that influence manure excretion. In addition, these standards become dated with time because they do not recognize changes in genetics, animal performance, and feeding options. Current and past excretion estimates based upon species and body weight alone often produce inaccurate estimates of manure excretion for individual farms.

The standard for manure excretion released by ASABE in 2005 was designed to provide farm-specific estimates of excretion reflective of individual farm feed programs and animal performance. In addition, this standard will better adapt to changes in excretion that occur over time due to factors such as improved animal genetics. Thus, the equation based standard for manure excretion released in 2005 should remain accurate well into the future.

Is This Important?

Tables 3, 4, and 5(PDF file) illustrate excretion estimates for beef, swine, and dairy calculated from the new equations. Some of the more dramatic differences between the current ASABE and other standards are associated with P and total solids excretion. These differences tend to become larger as emerging feed technologies reduce nutrient excretion and as feeding of by-products of corn processing and other food processing industries become increasingly popular. To illustrate the importance of the new ASABE standard for farm specific estimates, comparisons are illustrated below for three species.

Beef

A comparison of excretion characteristics estimated by the new ASABE standard with past standards (Table 3, Rows A-C) suggests that previous estimates are in reasonable agreement for N excretion but in poor agreement with P excretion. A significant effort to better match beef cattle rations with phosphorus requirements has reduced P excretion substantially.

Considerable variation exists between individual cattle feedlots relative to performance and feed program strategies. Substantial variation in N and P excretion is anticipated when comparing a corn based ration (Table 3, Row C) and a ration with 40% distillers grains (Table 3, Row D). Combining feed program variation with typical ranges in animal performance can produce a 2-fold range in N excretion and a 3-fold range in P excretion (Table 3, Rows F and G). Large errors in beef cattle excretion estimates are common unless performance and feed program are considered in estimating excretion.

Swine

Typical nitrogen excretion estimates for swine for the new standard have changed little from the past ASAE standard (Table 4, Rows A-B). However, phosphorus excretion is substantially lower than other standards. Total solids excretion is also generally lower than previously accepted values.

Table 4 illustrates the importance of a standard that responds to emerging feeding strategies (Table 4, Row C). Diets based on use of crystalline amino acids and phytase have the potential for lowering dietary CP and P levels and N and P excretion. A low CP diet would produce N excretion levels up to 40% less than new standard typical value. Low P diets would reduce P excretions levels by 33 to 40% from new typical values.

Dairy Cattle

Generally the new ASABE standard predicts greater excretion of nutrients and solids as compared to the past ASAE standard and other existing accepted values for lactating cattle (Table 5, Rows A and B. Steadily increasing milk production will create an even larger disparity between predicted excretion by the new ASABE standard and other past values.

Tools for Applying ASABE Standard

The proposed ASABE equations complicate the process of estimating nutrient and solid excretion. Software tools based upon these equations provides one option for improving the utility of equations and their application to farm specific CNMPs. Two spreadsheet tools use the ASABE estimate of excreted nutrients as a basis for estimating land requirements for managing manure nutrients. A Nutrient Inventory comes with instructions and a one-hour video discussing its application (available at University of Nebraska). A second tool nearing completion (FNMP$) will estimate land requirements, cost and time required for land applying manure, and potential economic benefits of manure nutrients (will be available at the same web site).

A simplified hand calculator of nutrient excretion was introduced in a MWPS publication, Manure Characteristics (Table 6). It uses a mass nutrient balance procedure for estimating excretion for beef, dairy, poultry and swine. It provides a simplified approach that produces similar answers to procedures used in the ASABE standard.

Information Requirements for Using New Standard

The information requirements of the new standard are greater than with past standards. Farm specific information is needed for animal performance ( e.g. weight gain or milk production) and feed program (dry matter intake and nutrient concentration). Those input requirements are summarized in [media:Table7excretion.pdf | Table 7]].

Applications of New ASABE Standard

Most nutrient planning processes follow a step-wise procedure similar to that illustrated in Figure 2. At this time, the equation-based estimates of solids and nutrients will have their greatest utility in the strategic or long-term planning. These strategic plans are of greatest value to a new or expanded facility or when a regulatory permit is being assembled.

Figure 2 illustrates a second critical planning phase, the Tactical or Annual Plan. For decisions such as manure application rates, timing, and location, constantly changing conditions such as weather and residual soil nutrients must be considered. On-farm data such as manure samples will likely be of greater value to annual planning processes than the predictions made by the new ASABE equations

Figure 2. Common planning procedure used for nutrient management planning.

Improvements in nutrient excretion estimates offered by the new equations should improve the accuracy of farm-specific planning for:

  • Land requirements for managing N and P. The equations provide a more accurate estimate of nutrient driven land requirements for manure application when on-farm data on manure production is not available. Nitrogen volatilization and availability estimates remain a weak point for this planning process.
  • Cost of manure application. The ASABE equations are being used to estimate manure nutrient value as well as time, equipment, and labor requirements for handling manure (Kissinger et al., 2005).
  • Ammonia emissions. Ammonia emissions from animal facilities are of increasingly interest to the regulatory community. The equations should provide a mechanism for adjusting farm emission estimates based upon several farm-specific factors.

The equations also allow a prediction of dry matter excretion and possibly volatile solids excretion if feed digestibility values are known. This approach will allow farm specific estimates of solids excretion that will benefit planning estimates of:

  • Anaerobic and aerobic lagoon sizing,
  • Anaerobic digester sizing and gas production,
  • Storage sizing if solids estimates are combined with known moisture contents resulting from specific manure handling systems

Summary

The new ASABE standard for manure excretion provides an important tool for key strategic planning activities important to a comprehensive nutrient management plans. In addition, the new standard provides an important tool for integrating feed management decisions into CNMPs and deciding the environmental and economic benefits and costs of feed program options.

Related Files

To follow the references in this article, it is recommended that you print these four PDF files and refer to them at the appropriate places in the article.
Tables 1 and 2
Tables 3, 4 and 5
Table 6
Table 7

Disclaimer

This fact sheet reflects the best available information on the topic as of the publication date. Date 5-25-2007

Acknowledgements

This Feed Management Education Project was funded by the USDA NRCS CIG program. Additional information can be found at Feed Management Publications.

Image:Feed mgt logo4.JPG This project is affiliated with the Livestock and Poultry Environmental Learning Center.

Image:usda,nrcs,feed_mgt_logo.JPG

Project Information

Detailed information about training and certification in Feed Management can be obtained from Joe Harrison, Project Leader, jhharrison@wsu.edu, or Becca White, Project Manager, rawhite@wsu.edu.

Author Information

R.K. Koelsch, University of Nebraska-Lincoln

Images: CC 2.5 Rick Koelsch

Partners

Logos2.JPG

“Extension programs and policies are consistent with federal and state laws and regulations on nondiscrimination regarding race, sex, religion, age, color, creed, national or ethnic origin; physical, mental or sensory disability; marital status, sexual orientation, or status as a Vietnam-era or disabled veteran. Evidence of noncompliance may be reported through your local Extension office.”

NRC Recommendations for Dairy Cows

Introduction

This fact sheet has been developed to support the implementation of the Natural Resources Conservation Service Feed Management 592 Practice Standard. The Feed Management 592 Practice Standard was adopted by NRCS in 2003 as another tool to assist with addressing resource concerns on livestock and poultry operations. Feed management can assist with reducing the import of nutrients to the farm and reduce the excretion of nutrients in manure.

Please check this link first if you are interested in organic or specialty dairy production

Feed Management

Feed Management is one of six components in a Comprehensive Nutrient Management Plan (CNMP). Feeds represent a costly fraction on a dairy farm budget and feed inputs are among the largest sources of nutrients imported to the operation. Feed management depends on adequate feed acquisition and allocation, in quantity and quality sufficient to supply the herd’s nutrient demands for a given period of time. Knowledge of animal nutrient requirements is paramount for a successful Feed Management.

Nutrient requirement standards for most economically important farm animal species have been reported by the National Research Council (NRC) since the early 20th century . NRC’s seventh revised edition of the Nutrient Requirements of Dairy Cattle, issued in 2001, included significant alterations over its previous edition (1989). Calculations of nutrient requirements and their interactions are integrated by the 2001 Dairy NRC in a computer model that allows for estimates of nutrient requirements and dynamic ration evaluation.

Better comprehension of the processes used to determine a dairy cow’s nutrient requirements in the NRC (2001) model is essential for the success of the nutrient management plan. A few aspects of nutrients that are relevant to Nutrient Management (nitrogen, phosphorus, and potassium) are discussed below. For more detailed information, please refer to the publication indicated above.

Nutrients

Nitrogen (Protein)

Two aspects must be considered to evaluate a ration’s adequacy: the nutrients supplied by the diet (nutrients contained in feeds) and the cows’ nutrient demand for body maintenance, reproduction, production and growth in cows that have not reached mature body weight.

Protein content in feedstuffs is usually referred to as crude protein (CP). In the laboratory, feed samples are actually analyzed for nitrogen (N) content, and CP is calculated as:

CP = N × 6.25

This equation is based on the assumption that dietary protein contains an average of 16% N.

“Nitrogen is of primary environmental concern because of losses of ammonia in the air and because of nitrate contamination of surface water and groundwater.” NRC (2001)

In the 2001 dairy NRC, feed protein supply is divided into two fractions: rumen degraded protein (RDP) and rumen undegraded protein (RUP). Rumen degraded protein supplies microbial needs. However, rumen microbes require non-protein N (ammonia, amino acids, peptides,) as “building blocks” of microbial protein (MCP). The extent of MCP synthesis in the rumen depends on a number of factors including level of feed intake, digestion rate (Kd) of diet components in the rumen, and passage rate (Kp) of digesta from the rumen. In the absence of a more reliable analytical method, the NRC subcommittee chose to use three fractions (A, B, C) derived indirectly from rumen incubation of in situ bags to derive RDP and RUP supplied by feed ingredients (kg/d):

RDP = A + B × [Kd/(Kd + Kp)]

RUP = B × [Kp/(Kd + Kp)] + C

Where A is the amount (kg/d) of N presumably readily available to microbes, B is the amount of N that is available by degradation (at a rate = Kd) and C is the amount of N unavailable for microbial growth.

Ruminants also recycle N to the rumen as salivary urea that can be used by rumen microbes, especially when dietary N is below optimal. That N source, along with enzymes and sloughed cells released in the gut are called endogenous CP because they come from within the body of the cow.

Finally, three sources of protein leave the cow’s stomachs and reach the small intestine:
MCP;
RUP; and
Endogenous CP.

Digestible protein will be hydrolyzed in the small intestine essentially into amino acids, which can be absorbed and used for body maintenance, growth, reproduction, and lactation. The absorbable amino acids, defined in NRC (2001) as metabolizable protein (MP), can be converted into milk protein with an average efficiency of 67%. Considering an average intestinal digestibility of 0.65, one can estimate the theoretical maximum milk N efficiency of utilization as:

0.67 × 0.65 = 0.44 or 44 %

After more than half a decade of its publication, the NRC (2001) protein requirement model withstood a number of comparisons and validations against measured data and other models. Some criticism has been observed. Those include the need for accurate feedstuff characterization, extent and complexity of inputs required by the model, overestimation of RDP requirements because nitrogen recycling is not taken into consideration, over-prediction of milk response to RUP supplementation, and over-evaluated energy value of proteins. However, if default values are replaced by more accurate feed and animal characterization, the NRC (2001) model has accurately predicted milk and protein production.

Finally, because the NRC (2001) is a dynamic model that incorporates animal-feed interactions, and feed-feed interactions. Thus, the computer model should be used rather than the tabulated values. In general, the NRC (2001) predicts that dietary CP contents between 16.5 and 17.5 % of the DM supply the protein requirements of early-lactation dairy cows under most conditions. Dietary CP should be equal to or below 16.5% as cows advance into the second half of the lactation.

Phosphorus

In the NRC (2001), phosphorus (P) in feed and microbes were given absorption coefficients (AC).

“Of all dietary essential mineral elements for dairy animals, phosphorus represents the greatest potential risk if excess is released into the environment contaminating surface waters and causing eutrophication.” NRC (2001)

Phosphorus AC is the efficiency with which P from a source is absorbed in the cow’s small intestine. The AC is variable, depending on a number of animal and feed characteristics. For instance, decreasing P content of the diet increases the AC and P efficiency of utilization from feed to milk. The NRC (2001) adopted fixed absorption coefficients for forages (0.64) and concentrates (0.70). Only mineral sources were given specific ACs. For instance, dicalcium phosphate AC is 0.75, while higher ACs were applied to monosodium phosphate and phosphoric acid (0.90). Those AC values were higher than the 0.50 value used previously (NRC, 1989). Endogenous P sources, a major recycling route in ruminants, have an AC above 0.70.

Phosphorus available for absorption is defined as absorbable P and is calculated as feed P (in grams) multiplied by its AC and summed for all feeds in the diet:

Absorbable P = ∑(feed P × feed P AC)

The NRC (2001) estimates dairy cows’ demand for absorbed P based on a factorial approach. The factorial determination of requirements accounts for the absorbed P necessary for maintenance, growth, reproduction and lactation.

Milk P averages at 0.090%, but may range from 0.083% to 0.100%. Given the milk volume produced by modern dairy cows, milk P makes up for the largest proportion of the requirements for a lactating dairy cow, followed by body maintenance, and only a small fraction needed for growth and reproduction. Phosphorus demand for fetal growth is relevant only in the last third of gestation.

Phosphorus supply adequacy is estimated as dietary absorbable P minus the sum of requirements (maintenance + growth + reproduction + lactation).

Current NRC P recommendations for lactating dairy cows range from 0.30 to 0.40 % of the diet DM, depending particularly on milk production. A number of studies have shown no production or reproduction benefits from feeding P above NRC dietary recommendations, and that most excess P is excreted in feces.

Using dicalcium phosphate ($400/ton = $0.82/lb P, discounted Ca value), one can estimate that it costs $1.50/cow/year for every one hundredth of a percentage unit (0.01) P increased above NRC recommended level for a cow eating 50 lb/d of dry matter. Overfeeding P to lactating dairy cows is uneconomical, wasteful and may harm the environment.

Potassium

The NRC subcommittee adopted a single AC of 0.90 for potassium (K) in all feeds. Potassium requirements are calculated similarly to P requirements.

Lactating dairy cows have high demand for K. As much as an ounce of K will be secreted with every 42 lbs of milk, but even larger quantities are lost with sweat, feces and particularly in urine. Those requirements must be supplied on a daily basis because K is not stored in the body.

Despite recognition that the requirement increases with higher temperatures (sweating), NRC (2001) K model does not take into consideration ambient temperature to calculate K requirements. Furthermore, K is an important element influencing the DCAD (Dietary Cation-Anion Difference) of a ration (in addition to sodium (Na) and chloride (Cl)). There has been increased interest in how DCAD affects acid-base balance of dairy cows. Whereas a low DCAD (in general lower dietary K and Na, high Cl) has been recommended for periparturient cows to prevent milk fever, higher postpartum DCAD (~+200 meq/kg) is suggested to maximize milk production. This dichotomy raises concerns and complicates K balance in a nutrient management plan.

NRC (2001) recommended dietary K levels ranging from 1.0 to 1.2% of the dry matter.

“Application of manures of fertilizers rich in potassium to crop land can result in excess potassium in the environment and very high potassium content of forages. This can cause problems with calcium and magnesium metabolism particularly for periparturient cows, and may cause udder edema.” NRC (2001)

Table 1. Nutrient requirements of lactating dairy cows estimated with the NRC (2001) model using sample diets varying feeds, stages of the lactation and milk production levels.1
Scenario 1 Scenario 2 Scenario 3 Scenario 4 Scenario 5
Animal description:
Age, months 52 55 53 55 59
Parity 3 3 3 3 3
Body weight, lb 1432 1432 1432 1432 1432
Body weight change, lb/d -0.88 0.00 -1.10 -1.10 1.50
Days in milk 45 120 60 120 250
Days pregnant 0 50 0 50 170
Body condition score 2.75 2.75 2.75 2.75 3.50
Production inputs:
Milk production, lb/d 98.0 98.0 130 130 45.0
Milk fat, % 3.50 3.50 3.50 3.50 3.70
Milk true protein, % 3.00 3.00 3.00 3.00 3.00
Milk lactose, % 4.78 4.78 4.78 4.78 4.78
Intake estimated by NRC (2001) model:
Dry matter intake, lb/d 51.8 59.5 64.7 70.3 42.7
Sample diet used in the NRC (2001) model, lb dry matter/d:
Corn silage, normal 23.50 28.20 24.07 32.00 19.40
Legume forage hay, mid-mat. 4.25 7.25 8.41 5.48 6.60
Bermudagrass hay, Tifton-85 2.38 4.40
Grass hay, C-3, mid-mat. 1.98 2.69 6.60
Whole cottonseed 4.54
Soybean, meal, solv. 48% CP 6.72 6.41 3.68 9.49 0.46
Soybean, meal, expellers 2.33 1.01 1.83
Corn gluten meal 4.21
Urea 0.18
Corn grain, steam-flaked 4.10
Corn grain, ground, hi moist. 10.37 17.80 15.46
Corn grain, ground, dry 12.78
Tallow 0.99 1.37
Calcium soaps of fatty acids 0.26 0.26 0.35
Calcium carbonate 0.20 0.20 0.29 0.22 0.10
Monosodium phosphate (1 H2O) 0.11 0.09 0.18 0.15 0.04
Salt 0.30 0.29 0.32 0.25 0.20
Vitamin and mineral premix 0.77 0.90 0.95 1.00 0.62
Diet nutrient contents:
% RDP 10.2 9.7 9.7 9.6 9.6
% RUP 6.9 6.1 7.8 7 3.8
% CP(%RDP + %RUP) 17.1 15.8 17.5 16.6 13.4
% phosphorus (P) 0.38 0.36 0.40 0.38 0.29
% potassium (K) 1.32 1.31 1.13 1.29 1.46
1Feeds were chosen from NRC (2001) feed library for example purposes. For accurate diet evaluation, the NRC (2001) model requires animal description and feed analyses for every specific situation.

References

National Research Council. 1989. Nutrient Requirements of Dairy Cattle. 6th rev. ed. Natl. Acad. Sci., Washington, D.C.

National Research Council. 2001. Nutrient Requirements of Dairy Cattle. 7th rev. ed. Natl. Acad. Sci., Washington, D.C.

“Extension programs and policies are consistent with federal and state laws and regulations on nondiscrimination regarding race, sex, religion, age, color, creed, national or ethnic origin; physical, mental or sensory disability; marital status, sexual orientation, or status as a Vietnam-era or disabled veteran. Evidence of noncompliance may be reported through your local Extension office.”

Disclaimer

This fact sheet reflects the best available information on the topic as of the publication date. Date 10-15-2006

This Feed Management Education Project was funded by the USDA NRCS CIG program. Additional information can be found at Feed Management Publications.

Image:Feed mgt logo4.JPG

This project is affiliated with the LPE Learning Center.

Image:usda,nrcs,feed_mgt_logo.JPG

Project Information

Detailed information about training and certification in Feed Management can be obtained from Joe Harrison, Project Leader, jhharrison@wsu.edu, or Becca White, Project Manager, rawhite@wsu.edu.

Author Information

Vinicius Moreira
LSU AgCenter Southeast Research Station
VMoreira@agcenter.lsu.edu

Reviewer Information

Fred Moore – EPA Region 6 Liason
Michael Wattiaux – University of Wisconsin

Partners

Image:Logos2.JPG

Feed Management Planning as a Tool to Reduce Nutrient Excretion

Why is Feed Management Important to Nutrient Planning?

Feed represents the largest import of nutrients to the farm, followed by commercial fertilizer. Feed management practices impact the amount of nutrients that are imported to the farm and excreted in manure. The excreted nutrients are subsequently available for volatile loss (nitrogen) to the atmosphere and potentially lost via surface runoff (nitrogen and phosphorus) or leached to ground water (nitrogen and phosphorus).

Nutrient management planning addresses the proper distribution of manure nutrients, but typically only focuses on the nutrients after they have been excreted by the animal. It may seem obvious, but the amount of N and P consumed by an animal is directly related to the amount it excretes. Formulating an inexpensive ration with excess N or P, will increase the amount of these nutrients excreted in the manure. Depending on the requirements of the farm nutrient management plan, this may mean that the manure must be spread over a larger number of acres compared to manure that contains lower N or P levels.

Feed management opportunities currently exist to reduce imports of nutrients (particularly N and P) to most animal livestock and poultry operations. Since consulting nutritionists play such a key role with regard to importation of nutrients to the farm, a systematic approach to evaluate the role that Feed Management has on whole farm nutrient management is warranted.

Resources Available for Managing Feed Nutrients

The National Feed Management Education Project (NFMEP) has developed a systematic approach to feed management and whole farm nutrient management. The team has developed a series of fact sheets and resources for the four major species. In addition, the LPE Learning Center Small Farms team has developed resources for small acreage livestock and poultry owners.

graphic

CC2.5 LPELC

Authors: Joe Harrison, Washington State University and Jill Heemstra, University of Nebraska

Costs of Slurry Manure Application and Transport

Livestock and Poultry Environmental Learning Center:

Home Page

All articles about:

Manure Value and Economics

Livestock such as dairy and swine often have slurry type manure. The manure is liquid but does not flow easily. It is either stored directly below the animal pens, or scraped or pumped periodically into a holding pen outside of the building.

Loading Slurry Manure

Loading slurry manure is accomplished with a pump powered by a tractor or stationary engine. The slurry can be loaded into tractor-pulled or truck-mounted tankers, or pumped through a hose attached to a tractor that applies it as it is being pumped from the pit. The cost of loading slurry is usually low because the pump can do it quickly and the volume per animal is not usually high.

Slurry Manure Transport

Transportation of slurry by tanker can be expensive because a lot of water is being transported and the same equipment that is hauling the slurry is usually land applying the slurry. When tankers are used, the number of hours spent transporting the slurry is frequently the limiting cost. The land may become unavailable to receive the slurry, due to crop planting times or soil conditions, before all of the slurry can be land applied. Often, the distance transported is limited so that the time constraints can be met.

If the slurry is pumped through a hose to the field, the transport time is negligible. As the slurry is pumped, it is simultaneously injected or surface applied to the land. The important cost becomes the cost of purchasing pipe and hose that is sufficient for this method of land application.

Land Application of Slurry Manure

The cost of land application of slurry varies with the type of equipment used. Tankers can be expensive to own unless they are used for many animals on many acres. There is a definite economy of scale with tankers. Additionally, the tankers usually require fairly large tractors or trucks. If the livestock owner does not have a cropping enterprise that requires the large tractor, ownership of the tractor for manure distribution alone becomes expensive.

Tankers are economical for large-scale operations with slurry manure.

When slurries are applied via hoses (called dragline hoses), a tractor pulled distributor is used to move the hose around the field so that the slurry is evenly distributed. The cost of the equipment can be very expensive, but the amount of time is decreased considerably compared to using tankers because most of the time is spent in applying the slurry. Very little time is spent getting into and out of the field, as is the case when using tankers.

Authors: Ray Massey, University of Missouri and Josh Payne, Oklahoma State University

Feed Management on Small Livestock Farms

Why Is Feed Management Important?

Nitrogen and phosphorus from agriculture sources can affect water quality. These nutrients are required for plant and animal growth, but too much in agricultural runoff can result in environmental and health concerns. This fact sheet provides some guidelines to help livestock producers, especially those on small farms, reduce nitrogen and phosphorus losses by monitoring and/or changing feeding and management practices. This can result in less waste and ultimately a healthier, cleaner, and safer environment. Wasted feed and wasted nutrients also represent wasted money for the farm.

Nutrient Balance on Small Farms

Nutrient inputs on a farm consist of feed, animals, irrigation water, fertilizer, legume nitrogen, etc. Outputs are meat, milk, animals, crops, and manure. When inputs exceed outputs, losses will be present in feed or barnyard waste, in manure, and in lot runoff, etc. These losses may result in excess nutrient storage in the soil. Nutrients may leach through the soil (nitrate) into ground water or run off the soil surface (phosphorus and nitrogen) and directly transported to surface waters.

Each farm should be seen as a complete system or cycle with inputs, outputs, storage, losses, and recycling all taking place. To illustrate, a 120-cow dairy farm will require 29.2 tons of nitrogen and 2.6 tons of phosphorus per year. Outputs (meat, milk, fiber, etc.) will be 6.9 tons of nitrogen and .8 tons of phosphorus, resulting in 22.3 tons of nitrogen and 1.8 tons of phosphorus for disposal, usually through spreading on available land. Similar calculations can be made for all livestock species. See “Whole Farm Nutrient Balance“…

If nutrients are overfed, or if feeding is mismanaged on an individual farm, this will result in more nutrients to manage in manure or as spoiled feed. While these nutrients can be applied to crop or hay ground to raise feed, it is important to try and keep this recycling loop as balanced as possible to avoid build-up of excess nutrients. Proper animal feeding and management practices can ensure that feed nutrients are not wasted, not overfed, and feed efficiency will be optimized on the farm.

Feeding Management

Feeding a balanced diet, avoiding overfeeding, and providing abundant supplies of cool, clean, and pure water will help to optimize feed and nutrient use on an animal farm. One way to understand nutrient requirements is to imagine a stave barrel. Only when all staves making up the barrel are the same length will water stay in the barrel. If all staves are 3 feet long, all the water will stay in the barrel. However, if one stave is a foot and a half long, then all the water will run out of the barrel to the level of a foot and a half. (See Figure below.)

barrel

CC2.5 LPELC

That is exactly what is happening with a balanced diet. If all nutrients are in a perfect balance, then there will be no excess and no wastage. It is impossible for all nutrients to be in a perfect balance in commercial or practical diets, but we want to come close to meeting an animal’s nutrient requirements. If the diet is balanced except for one underfed nutrient, then the entire production of the animal will be limited to the level of that “limiting nutrient” and all other nutrients will be wasted.

Overfeeding can be harmful to animals and to the environment. Animals that become overconditioned or obese may be unproductive and at greater risk of health problems. Excess feed is often wasted and may remain in the feeding area, become contaminated, and end up in the manure pile. Water is the most abundant, cheapest, and least understood of all nutrients required for livestock production. Water is of concern whenever it is in short supply or contamination is suspected. If subfreezing temperatures turn water into a frozen nutrient, it will mean trouble for domestic livestock. Distress is often brought on by cold wet winter weather requiring an animal’s digestive system and metabolic processes to function at peak efficiency to convert feedstuffs to energy so that they can remain warm, healthy, and productive.

Conversely, in hot summer weather, water is essential to the animal as well. It serves to cool the animal and works as a solvent or buffer for chemical reactions in the body. When the weather is hot in the summer, an animals’ requirement for water will increase. A lactating dairy cow requires on the average between 15 and 35 gallons of water per day; non-lactating dairy and beef cows require about 15 gallons per day; an adult horse will consume up to 15 gallons per day, which will increase 2 to 3 times when exercising; an adult sheep between 1 ½ and 3 gallons a day; adult swine from 3 to 5 gallons per day; and adult hens about a pint.

A quick rule of thumb is that for every 2 pounds of dry feed intake, an animal should receive one gallon of water. This will vary with stress, weather conditions, heat, cold, disease, productive state, work, exercise, etc., as well as the water and salt content of the feed. Often the first sign that water consumption is inadequate is when animals stop eating. Water is essential to maintain adequate feed consumption.

How does this affect nutrient management?

If we want our animals to reach maximum levels of production, then they will only have optimum feed intake if they receive adequate amounts water. Level of salt in the water or the diet can influence water requirements as can the presence of heavy metals, nitrates, microbes, and algae. Water is not related to runoff or contamination on the farm in the same way that overfeeding or imbalanced diets are, but water influences the ability of animals to use feed. If water is inadequate or contaminated, then animals will use diets less efficiently, eat less, be less productive, and may excrete more nutrients in waste.

How Do I Feed My Livestock to Avoid Waste and Maximize Efficiency?

Check out the list of helpful feed management tips for practical ways to manage feed and nutrients. Some of the topics on the page include:

Feeding animals is both an art and a science. It is a science influenced by years of research and it is an art developed by centuries of practical experience. Healthy animals fed balanced diets and provided with abundant supplies of fresh water will be the most productive. These animals will be the most profitable to the farmer and the most efficient users of nutrients.

References

  • National Research Council. 1989, 1994, 1996, 1998, 2001. Nutrient Requirements of Horses, Poultry, Beef, Swine, and Dairy. National Academy Press, Washington, DC.
  • Ralston, S. L. 1993. Analysis of Feeds and Forages for Horses. Rutgers Cooperative Extension. NJAES. Factsheet – FS714.
  • Singer, J. W. and D. L. Lee. 1999. Feed and Forage Testing Labs. Rutgers Cooperative Extension. NJAES. Factsheet – FS935.
  • Williams, C. A. 2004. The Basics of Equine Nutrition. Rutgers Cooperative Extension. NJAES. Factsheet – FS038.©2007 Rutgers, The State University of New Jersey.All rights reserved.
  • Rutgers Cooperative Extension Fact Sheet FS 1064
  • N.J. Agricultural Experiment Station
  • Rutgers, The State University of New Jersey, New Brunswick

Cooperating Agencies

  • Rutgers, The State University of New Jersey, U.S. Department of Agriculture, and County Boards of Chosen Freeholders.
  • Rutgers Cooperative Extension, a unit of Rutgers New Jersey Agricultural Experiment Station, is an equal opportunity program provider and employer. Published: June 2007

Authors: Michael L. Westendorf and Carey A. Williams, Extension Specialists in Animal Sciences, Rutgers, The State University of New Jersey. This article was originally published as Rutgers Cooperative Extension Fact Sheet FS 1064. Updated November 25, 2008.

Dairy Feed Nutrient Management Fact Sheets

Introduction to Feed Management and Developing a Feed Management Plan

It is strongly recommended that you read these introductory fact sheets before the dairy-specific ones.

Developing A Dairy-Specific Feed Management Plan

Managing Feed Nutrients on a Dairy Farm

Tools and Resources for Developing a Feed Management Plan

These fact sheets were developed as part of the National Feed Management Education Project.

Making Sense of Treatment Technology Options for Livestock Farms

Have you ever wondered whether manure should be treated on your livestock operation? What technology will work best in your situation? This webinar discusses strategies for selecting the right technology to meet your farm’s needs and reviews some proven and emerging technologies that are showing promise for the dairy industry. This presentation was originally broadcast on February 16, 2018. More… Continue reading “Making Sense of Treatment Technology Options for Livestock Farms”

Compost Bedded Pack Barns for Dairy Cows

Compost Dairy Barns

Dairy housing systems have a substantial impact on the overall health and longevity of dairy cattle. A compost bedded pack barn (generally known as a compost dairy barn) is an alternative loose housing system for dairy cows that appears to offer very good cow comfort for lactating, dry, and special needs cows. The first compost dairy barn in Minnesota was built in late 2001 by Portner Brothers from Sleepy Eye. Many more have been built in the state since that time.

Compost dairy barns require excellent pack and ventilation management for the barns to perform well. Producers need to use appropriate bedding in adequate amounts. The bedded pack needs to be aerated twice daily to refresh the surface and enhance microbial activity in the pack. Compost barns will not perform well if the cows are overcrowded. Producers must use excellent cow prep procedures at milking time. Producers can have problems with compost barns if these guidelines are not followed. Compost barns are not the answer for every dairy producer. It is important to always match the manager with the system in order to be successful.

Results of a cross-sectional field study on compost barns were recently published (Barberg et al., 2007a, Barberg et al., 2007b and Endres and Barberg, 2007). Additional field observations have also been reported (Janni et al., 2007).

Figure 1. Good cow comfort in a hoop-style compost dairy barn.


In general, compost barns have an indoor or an outdoor concrete feed alley, a bedded pack (resting) area, and a 4-foot-high wall surrounding the pack. The wall separating the pack and the feed alley has one to four walkways for cows and equipment to access the pack. This wall is 4 feet tall and typically of poured concrete construction. The bedding material is aerated twice daily using a cultivator or chisel plow type of equipment to dry the surface and incorporate manure into the pack.

One of the reasons producers have adopted this alternative housing system is for improved cow comfort and longevity. A compost barn allows cows more freedom of movement than conventional tie stalls or free stalls. These barns may also provide a reduction in manure storage costs and needed space, and a savings in labor and manure handling.

Please check this link first if you are interested in organic or specialty dairy production

Barn Layout

Figure 2 shows a typical drive-by compost barn layout. Compost barns can be laid out for drive-by feeding, covered feeding, or drive-through feeding with pens on both sides. They can also be used with feed bunks under roof or outside.

Figure 2. Compost barn layout for 100 cows with three walkways to the bedded pack, drive-by feeding, and 6-foot overhang. Waterers are against the concrete wall, separating the bedded pack from the feed alley and are accessed from the feed alley only. Not drawn to scale.


Figure 3. Another example of a hoop-style compost barn.


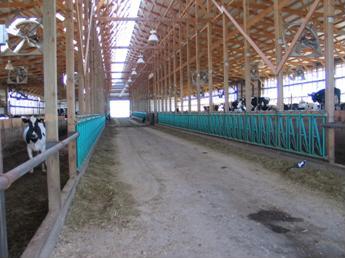
Figure 4. An example of a compost barn with center drive-through feeding.


Compost barns are similar in many respects to typical free-stall dairy barns. Both have feed mangers, feed alleys, and waterers. The key difference is that the free stalls and free-stall alleys in free-stall barns are replaced with a bedded pack area in compost dairy barns that is aerated at least twice daily.

A 4-foot-high (1.2 m) wall surrounds the pack on three sides and separates the pack and feed alley. The exterior walls can be cast-in-place concrete walls on footings below normal frost depths or wood. Some producers have the posts supporting the roof embedded in the exterior walls, while others have the posts mounted on top of the wall. In either case it is important that a structural engineer or the builder understand all of the structural loads that need to be considered (e.g., manure load, lateral earth pressure, machine load, roof load, wind load, wind lift load, snow load, etc.).

The 4-foot wall separating the bedded pack and the feed alley usually has a fence on top to prevent cows from walking over the wall. The wall separating the pack area and the feed alley is cast-in-place concrete or movable concrete panels with a wide base, called Jersey walls.

Walkways, at least 10- to 12-feet wide, are recommended at each end of the wall separating the bedded pack and the feed alley (as a minimum) for cow and equipment access to the pack area. Long barns will require additional walkways.

Waterers are located along the feed alley. Waterers can be located on either side of the feed manger or adjacent to the concrete wall separating the bedded pack and the feed alley. Waterers are not located in the bedded pack area to minimize wetting of the pack, to keep the waterers cleaner, and to avoid having to adjust waterer height as pack depth increases.

Compost barns are recommended to have 3-foot eave overhangs to minimize the chance of roof runoff and rain being blown into the barn and onto the bedded pack. Roof gutters will help reduce roof runoff from being blown onto the pack. The ground surrounding a compost barn should be sloped to minimize rain and snow runoff from entering the barn and wetting the bedded pack.

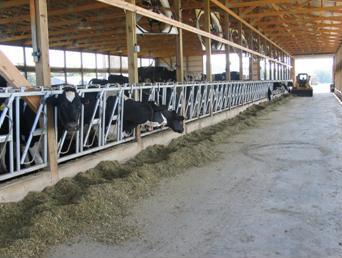
Figure 5. Example of a compost dairy barn with covered drive-by feeding.

Pack Management

Initially 1 to 1 1/2 feet of loose, dry, fine wood shavings or sawdust is put down to start a compost barn pen. Fresh bedding is added when the bedded pack becomes moist enough for it to stick to the cows after they rise from lying down on the bedded pack. We recommend that the bedded area provide at least 80 to 85 feet2 of resting space per cow for an average mature Holstein or similar-sized breed and 65 feet2 for an average Jersey.

The bedding material is aerated to a depth of 8 to 10 inches twice daily while cows are being milked, most often using a modified cultivator on a skid loader or small tractor. It is proposed that aeration is essential to incorporate oxygen for aerobic decomposition and to provide a fresh surface without accumulated manure for cows to lie down on after returning from the milking parlor or after feeding. Some producers in Minnesota are aerating the pack deeper (about 16 to 18 inches) using a chisel plow type of equipment and have observed a reduction in bedding needs and increased pack temperatures.

Typically, a semitruck-load of fresh dry sawdust (approximately 18 tons) is added every two to five weeks, varying by season, weather conditions, and cow density. Some dairies prefer to add a smaller amount of sawdust more frequently, such as once weekly. There are a small number of other dairies adding a thin layer of bedding every day.

Typically, no bedding material is removed from the pack area during the year, except in fall and spring. The bedded pack area is cleaned out entirely once a year in September or October. A load of clean sawdust is usually added after removal of the soiled bedding to provide a bedding layer 1 to 1 1/2 feet high to start the new pack. Some producers leave about half a foot of old material in the barn to help initiate microbial activity.

By the end of summer, most packs average 4 feet high. Several farms remove a portion of the pack material in the spring to provide space for bedding accumulation during the summer. The soiled bedding is spread on the fields according to the farm manure management plan. Some producers pile the spent bedded material to produce finished compost.

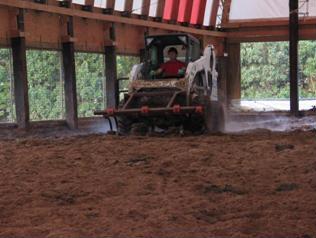
Figure 6. Many producers use a skid-steer loader to aerate the bedding.


Adequate ventilation (air exchange) is needed to remove cow heat and moisture, as well as the heat and moisture that the biologically active pack generates. Sufficient air exchange is needed in cold weather to remove moisture from the pack and extend the time between bedding additions. Moisture, in large amounts, is commonly seen as steam rising from the pack during aerating in cold weather. This moisture needs to leave the barn with the ventilation air.

Compost barns are recommended to have 16-foot sidewalls to provide better ventilation and access for bedding trucks. The sidewall height for a compost barn is recommended to be higher than that for a free-stall barn to accommodate the sidewall opening lost due to the bedded pack walls. Many compost barns have mixing fans to blow air downward onto the bedded pack to help dry the pack surface. The fans must be hung high enough to provide head room for aerating equipment at the maximum pack height.

Fertilizer Value and Pack Temperatures

For our cross-sectional study, we took samples of the bedding material at two depths. These bedding samples were analyzed for moisture, ammonia, pH, total carbon (C), nitrogen (N), phosphorus (P), potassium (K), and electrical conductance (soluble salts) concentrations. Results are summarized on Table 1, including a column with recommended values for composting. The average carbon to nitrogen (C:N) ratio was 19.5:1. A C:N ratio below 25:1 may emit ammonia odor, which may influence the ammonia levels in compost barns.

The average bedding temperature measured at various depths was 108 F and the pack surface temperatures were similar to the ambient temperature. Temperatures were greater in the areas of the pack that were fluffier and that were not as heavily soiled or packed by the cows. This observation is consistent with the need for oxygen and air for microbial activity that promotes composting.

Table 1
Average Range Recommended
Temperature, F 108 76-138 130-150
Moisture, % 54.4 28-78.9 50-60
pH 8.5 6.5-9.9 6.5-8.0
N, % 2.54 0.57-4.22 NA
P, ppm 3247 378-6668 NA
K, ppm 15,270 2568-29,570 NA
C:N ratio 19.5:1 10.9-87.5 25:1-30:1
Electrical Conductance, mmhols/cm 9.6 2.4-20.5 10 maximum

Costs

Barn building costs ranged from $33,000 to $300,000, with a cost per cow ranging from $625 to $1,750 (barn only, does not include milking parlor). The building costs ranged widely depending on the amount of on-farm labor utilized and amenities added.

Bedding material costs ranged from 35 to 85 cents per cow per day, depending on the source of sawdust and from how far it had to be transported to reach the dairy. Bedding costs and availability of bedding materials was by far the major concern expressed by the producers. Alternative bedding options are currently being tested. Preliminary results indicate that sawdust is the best option for these types of barn, but combinations of sawdust with other materials, such as finely ground soybean or flax straw, finely processed corn cobs, or wood chip fines can work relatively well.

Herd Performance and Udder Health

The average herd size for the herds enrolled in our cross-sectional study was 73 cows. The Dairy Herd Improvement Association (DHIA) rolling herd average was 23,005 lb (range of 18,306 to 27,304) and Somatic Cell Count (SCC) was 325,000 cells/mL (range of 88,000 to 658,000) for the test date nearest to our visit.

Statistical analysis of historical DHIA data indicated that 89% of the dairies had a significant increase in 305 mature-equivalent milk production when moving their cows from the previous housing system to the compost barn. The average increase was 2,105 lb/cow per year (range 870 to 2,934 lb). It is important to keep in mind that other changes were made to the dairy operation when moving cows to the compost barn, which most likely also contributed to the significant increase in milk production. Additionally, 57% of the dairies had an increase in heat detection rates (36.9% before and 41.5% after change in housing) and 71% of the dairies had an increase in pregnancy rates (13.2% before and 16.5% after change in housing). Herd turnover rates averaged 25.4% before and 20.9% after change in housing.

We found that 67% of the dairies had a reduction in mastitis infection rates (defined as percent of cows with a SCC>200,000 in each DHIA test date). However, only 43% of the dairies had a significant reduction in bulk tank SCC, with one dairy having a significant increase.

In general, a low level of contagious pathogens was detected in the milk bulk tank samples. One out of 12 farms had a high level of Streptococcus agalactiae, one farm had a high level of Staphylococcus aureus, whereas six farms had high levels of non-ag Strep, and five farms had high levels of coliforms (e.g., E.coli, Klebsiella, and Enterobacter) in the milk.

It is interesting to note that udder health and milk quality were not necessarily compromised when housing cows in this bedded pack system, especially when total bacteria counts in the bedding material were 9,122,700 cfu/mL (range of 2,035,562 to 22,562,604). It has been suggested that bedding should have less than 1 million cfu/mL to reduce the risk for mastitis. Therefore, excellent cow prep procedures at milking time and healthy teat ends are essential in a compost dairy barn system.

Cow Welfare

The feet and leg health of cows was good in the compost barns we visited. Overall, 7.8% of cows were clinically lame (locomotion score ≥ 3), with two herds having no lame cows. The average prevalence of lameness in compost dairy barns was much lower than the 24.6% (Espejo et al., 2006) and 27.8% (Cook et al., 2003) prevalence recently reported in free-stall barns and the 19.6% observed in tie-stall herds (Cook et al., 2003).

Overall, 25.1% of cows exhibited a hock lesion, with 24.1% having hair loss and 1.0% having a swollen hock. Seven of the 12 herds had no severe lesions. Hock lesions that occurred in the previous free-stall or tie-stall barn were most likely still present or healing in the compost barn. Weary and Taszkun (2000) reported that 73% (n = 1,752 cows) of cows housed in free stalls had at least one hock lesion, nearly three times the prevalence we observed in compost barns. Furthermore, Endres et al. (2005) observed in free-stall herds (n = 5,328 cows) that 14.1% of cows housed on mattress-based free stalls and 1.8% of cows on sand-based free stalls had swollen hocks.

Results on the prevalence of lameness and hock lesions in our study suggest that cow welfare, especially in relation to feet and legs, could potentially be better in these barns than in stall systems. We had some concerns about dust, which could predispose cows to pneumonia or cause eye irritation, and air quality, such as ammonia and/or hydrogen sulfide levels. More research is needed in these areas.

Keys to Success with Compost Dairy Barns (Based on Limited Research):

  1. Provide at least 80 to 85 feet2 per cow for Holsteins and similar-sized breeds and 65 feet2 for Jerseys. Some producers provide 100 feet2 per cow.
  2. Use fine, dry wood shavings or sawdust for bedding. Alternative bedding materials are being investigated.
  3. Aerate the pack twice daily 10 inches deep or deeper to keep it aerobic and fluffy. Biological activity helps dry the pack.
  4. Add bedding when it begins to stick to the cows. (Have bedding supply available so you don’t end up adding fresh bedding too late.)
  5. Enhance biological activity to generate heat to drive off moisture, and ventilate the barn well to remove the moisture.
  6. Use excellent cow prep at milking time.

Based on current observations, a compost dairy barn can be an adequate housing system for lactating dairy cows, especially for small- to medium-sized dairies or as a special needs barn in larger free-stall dairies. As with any system, optimum management is absolutely necessary to achieve desirable results. There are many housing options for dairy cattle, and producers should choose the option that will work best for them.

References Cited

Barberg, A.E., M.I. Endres, J.A. Salfer, and J. K. Reneau. 2007a. Performance, health and well-being of dairy cows in an alternative housing system in Minnesota. J. Dairy Sci. 90:1575-1583.

Barberg, A.E., M.I. Endres, and K.A. Janni. 2007b. Dairy compost barns in Minnesota: a descriptive study. Appl. Eng. Agric. 23:231-238.

Cook, N. B. 2003. Prevalence of lameness among dairy cattle in Wisconsin as a function of housing type and stall surface. J. Am. Vet. Med. Assoc. 223:1324-1328.

Endres, M.I. and A.E. Barberg. 2007. Behavior of dairy cows in an alternative bedded-pack housing system. J. Dairy Sci. (in press).

Endres, M.I, L. A. Espejo, and J. A. Salfer. 2005. Effect of stall surface on the prevalence and severity of hock lesions in dairy cows housed in free stall barns. J. Dairy Sci. Vol. 88(Suppl. 1):247. (Abstr.)

Espejo, L.A., M.I. Endres, and J. A. Salfer. 2006. Prevalence of lameness in high-producing Holstein cows housed in freestall barns in Minnesota. J. Dairy Sci. 89:3052-3058.

Janni, K.A., M.I. Endres, J.K. Reneau, and W.W. Schoper. 2007. Compost dairy barn layout and management recommendations. Appl. Eng. Agric. 23:97-102.

Weary, D. M., and I. Taszkun. 2000. Hock lesions and free-stall design. J. Dairy Sci. 83:697-702.

Webcast Presentation

A webcast presentation on compost bedded pack barns was given in January, 2008. The webcast archive includes video segments, power point presentations, and links to additional information.

Author Information

Marcia I. Endres* and Kevin A. Janni
University of Minnesota, St. Paul
*Corresponding Author: miendres@umn.edu

Spill Prevention, Control and Countermeasures

If your farm stores oil, fuel, or oil products, you should take note of the Spill Prevention, Control, and Countermeasures (SPCC) program. This rule applies to storages of a certain size and places some planning requirements on the farm. Speakers also discuss the proposed exemption for certain milk containers.

Reminder: Farms now must amend and implement their Spill Prevention, Control, and Countermeasure (SPCC) Plans. The compliance date for farms is May 10, 2013.

NOTE: This presentation was originally broadcast on November 19, 2010 and the speakers discuss a proposed exemption for certain milk containers. On April 18, 2011, EPA published a final rule amending the SPCC regulations to exempt milk and milk product containers, associated piping and appurtenances. The capacity of the exempt milk and milk product containers, piping and appurtenances should not be included in a facility’s total oil storage capacity calculation to determine if the facility is subject to SPCC. For more information on the milk exemption, see EPA’s SPCC and milk page. Continue reading “Spill Prevention, Control and Countermeasures”