Seasonal and Spatial Variations in Aerial Ammonia Concentrations in Deep Pit Beef Cattle Barns

There are known benefits and challenges to finishing beef cattle under roof. The accumulated manure is typically stored in either a bedded pack (mixture of bedding and manure) or in a deep pit below a slatted floor.  Previous research measured particulate matter, ammonia and other gases in bedded pack barn systems. Deep pit manure storages are expected to have different aerial nutrient losses and manure value compared to solid manure storage and handling. Few studies have looked at concentrations at animal level or aerial/temperature distributions in the animal zone. There is little to no documentation of the air quality impacts of long-term deep pit manure storage in naturally ventilated finishing cattle barns. The objective of this work is to describe the seasonal and spatial variations in aerial ammonia concentrations in deep pit beef cattle barns.

What Did We Do?

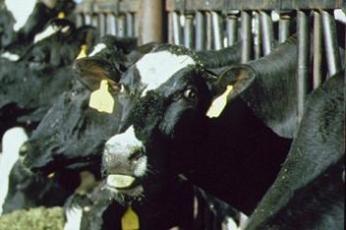
We measured ammonia concentrations among four pens in three beef cattle barns oriented east and west with deep pit manure storage during summer and fall conditions in Minnesota. We measured the concentration below the slatted floor (above the manure surface), 4-6 inches above the floor (floor level) and 4 ft above the floor (nose level). While collecting samples from within a pen, we also collected samples from the north and south wall openings surrounding the pen. We collected air and surface temperatures, air speed at cow level, and surface manure samples to supplement the concentration data. We collected measurements three times between 09:00 and 17:00 on sampling days. The cattle (if present) remained in the pen during measurement collection.

All farms had 12 ft deep pits below slatted floors, and pen stocking densities of 22 ft2 per head at capacity. Barn F finished beef cattle breeds under a monoslope roof, in four pens, with feed alleys on north and south side of pens. Two pens shared a common deep pit, and the farm pumped manure from the deep pits 1 week prior to the fall sampling period. Two pens were empty and the other two pens partially filled with cattle during the fall sampling period. Barn H finished dairy steers under a gable roof in a double-wide barn, in twelve pens over a deep pit and two pens with bedded packs, with a feed alley down the center of the barn. Four (east end) and eight (west end) pens shared common deep pits; the bedded pack pens were in the middle of the barn. The farm moved approximately 1 foot of manure from the east end pit to the west end pit one week prior to fall sampling period. Barn R finished dairy steers under a gable roof with four pens and a feed alley on the north side of the pens. All pens shared a common deep pit. Two pens were empty of cattle during the summer and fall sampling periods.

What Have We Learned?

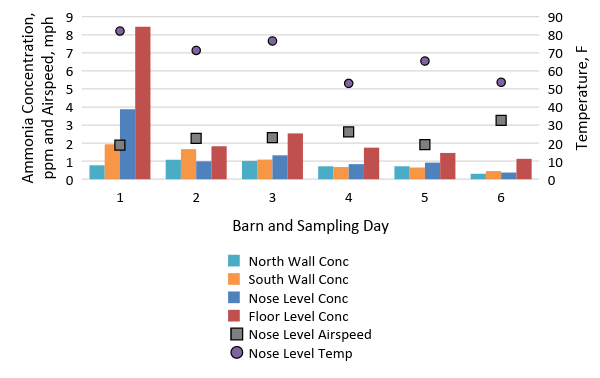
The ammonia concentration levels differed based on the location in the pen area (Figures 1 and 2). As expected, the ammonia concentrations in the pit headspace above the manure surface was the greatest, and at times more than 10x the concentration at floor and nose level. The higher concentration levels measured at Barn F coincided with higher manure nitrogen levels (Total N and Ammonium-N) (Figure 2). Based on July and September measurements, higher ammonia concentration levels also coincided with higher ambient temperatures (Figure 1). The presence and size of cattle in the pens we measured did not strongly influence ammonia concentrations at any measurement height within a barn on sampling days.

Ammonia concentration is variable between barns, and within barns. However, at animal and worker level, average concentrations for the sampling periods were less than 10 ppm during the summer and fall periods. Higher gas levels can develop in the confined space below the slatted floor.

Future Plans

The air exchange between the deep pit headspace and room volume relates these two areas, but is challenging to measure. We are looking at indirect air exchange estimations using ammonia and other gas concentration measurements collected to quantify the amount of air movement through the slatted floor related to environmental conditions. Additional gas and environmental data collected will enhance our understanding of deep pit beef cattle barn environments.

Authors

Erin Cortus, Assistant Professor and Extension Engineer, University of Minnesota

ecortus@umn.edu

Brian Hetchler, Research Technician, University of Minnesota; Mindy Spiehs, Research Scientist, USDA-ARS; Warren Rusche, Extension Associate, South Dakota State University

Additional Information

USDA is an equal opportunity provider and employer

Acknowledgements

The research was supported through USDA NIFA Award No. 2015-67020-23453. We appreciate the producers’ cooperation for on-farm data collection. Thank you to S. Niraula and C. Modderman for assisting with measurements.

Figure 1. Average ammonia concentration levels in the animal and worker zone for three deep pit beef cattle barns during spring and fall sampling days, and the corresponding airspeed and temperature at cow nose level.
Figure 2. Average ammonia concentration levels at nose and manure surface levels for three deep pit beef cattle barns during spring and fall sampling days, and the corresponding surface* manure characteristics. (* Barn F 14-Sep-18 manure sample was an agitated sample collected during manure removal).

The authors are solely responsible for the content of these proceedings. The technical information does not necessarily reflect the official position of the sponsoring agencies or institutions represented by planning committee members, and inclusion and distribution herein does not constitute an endorsement of views expressed by the same. Printed materials included herein are not refereed publications. Citations should appear as follows. EXAMPLE: Authors. 2019. Title of presentation. Waste to Worth. Minneapolis, MN. April 22-26, 2019. URL of this page. Accessed on: today’s date.

Methane Mitigation Strategies for Dairy Herds


Proceedings Home | W2W Home w2w17 logo

Purpose 

The U.S. dairy industry has committed to lowering the carbon footprint of milk production by 25% by 2020. A key factor in meeting this goal is reducing enteric greenhouse gas (GHG) emissions which represent about 51% of the carbon footprint of a gallon of milk. Methane (CH4) is the primary GHG emitted by dairy cows. Total methane emissions represented 10.6% of the total U.S. GHG emissions in 2014. Enteric CH4 emissions were 22.5% of the total methane emissions. Methane emissions from dairy cattle were 5.7% of total U.S. methane emissions or 0.6% of all U.S. GHG emissions. The purpose of this project was to examine nutrition and management options to lower methane emissions from dairy cattle.

What did we do?

This project utilized a number of approaches. One was to develop a base ration using the Cornell Net Carbohydrate and Protein System (CNCPS) model to evaluate the impact of level of dry matter intake and milk production on methane emissions. A second approach was to compile a database of commercial herd rations from 199 dairy farms. This database was used to examine relationships between the feeding program and CH4 emissions. A third component was to utilize published review papers to estimate potential on-farm CH4 reductions based on research data.

What have we learned? 

A base ration developed in the CNCPS model was evaluated at milk production levels ranging from 40 to 120 pounds of milk. As milk production increased, CH4 emissions increased from 373 to 509 grams/cow/day. This is primarily due to increasing levels of dry matter intake as milk production increases. However, the CH4 emissions per pound of milk decreased from 9.32 to 4.24 g as milk production increased. The 199 commercial herd database had an average input milk of 83.7 pounds per day with a range from 50 to 128 pounds. Daily dry matter intake (DMI) averaged 51.4 pounds with a range of 35.2 to 69.8. Simple correlations were run between CH4 emissions and ration components. Dry matter intake had a positive (0.795) correlation with CH4 emissions (g/day). However, the correlation between DMI and CH4/pound of milk was -0.65. These results agree with published research on the relationship of DMI and CH4 emissions. Starch intake also had a positive correlation (0.328) while percent ration starch was negatively correlated (-0.27) with CH4 emissions. There was also a positive correlation (0.79) between the pounds of NDF intake and CH4 emissions.

A review paper indicated that the maximum potential reduction in CH4 emissions by altering rations was 15% (Knapp et. al., 2014). Projected reductions from genetic selection, rumen modifiers and other herd management practices were 18, 5 and 18% in this same paper. The reduction by combining all approaches was estimated to be 30%. A second review paper listed mitigation strategies as low, medium or high (Hristov et. al. 2013). Potential reductions for the low group was <10% while the medium group was 10-30%. The high group had >30% potential to lower CH4 emissions. Ionophores, grazing management and feed processing were in the low group. Improving forage quality, feeding additional grain and precision feeding were in the low to medium group. Rumen inhibitors were listed in the low to high group. No items were listed only in the high group. These results provide guidance in terms of items to concentrate on at the farm level to reduce methane emissions.

Future Plans 

The number of commercial herds in the database will be expanded to increase the types of rations represented and the simple correlations run. In addition, a multiple regression approach will be used to better understand the relationships of ration components and CH4 emissions. Whole herd data will be obtained and examined to determine the proportion of the total herd CH4 emissions contributed by the various animal groups. The CNCPS program will also be used on rations at constant DMI to better understand the impact of specific ration components on CH4 emissions. These results of these will permit a more defined and targeted approach to adjusting rations to decrease CH4 emissions.

Corresponding author, title, and affiliation        

Dr. Larry E. Chase, Professor Emeritus, Dept. of Animal Science, Cornell University

Corresponding author email     

lec7@cornell.edu

Additional information               

Hristov A.N., J. Oh, J.L. Firkins, J. Dijkstra, E. Kebreab, G. Waghorn, H.P.S. Makkar, A.T. Adesogan, W. Yang, C. Lee, P.J. Gerber, B. Henderson and J.M. Tricarico. 2013. Mitigation of methane and nitrous oxide emissions from animal operations: I. Review of enteric methane mitigation options. J. Anim. Sci. 91:5045-5069.

Knapp J.R., G.L. Laur, P.A. Vadas, W.P. Weiss an d J.M. Tricarico. 2014. Enteric methane in dairy cattle production: Quantifying the opportunities and impact of reducing emissions. J. Dairy Sci. 97:3231-3261.

Acknowledgements       

This material is based upon work that is supported by the National Institute of Food and Agriculture U.S. Department of Agriculture under award number 2013-68002-20525. Any opinions, findings, conclusions, or recommendations expressed in this publication are those of the author and do not necessarily reflect the view of the U.S. Department of Agriculture.

The authors are solely responsible for the content of these proceedings. The technical information does not necessarily reflect the official position of the sponsoring agencies or institutions represented by planning committee members, and inclusion and distribution herein does not constitute an endorsement of views expressed by the same. Printed materials included herein are not refereed publications. Citations should appear as follows. EXAMPLE: Authors. 2017. Title of presentation. Waste to Worth: Spreading Science and Solutions. Cary, NC. April 18-21, 2017. URL of this page. Accessed on: today’s date.

Biosecurity for Livestock and Poultry Manure Management

Most biosecurity plans are meant to protect animal and human health by preventing the spread of bacteria or other pathogens. Indirectly, effective biosecurity practices can reduce the likelihood of multiple or catastrophic mortalities which is an issue of environmental concern. While not usually discussed under the umbrella of “biosecurity”, manure handling should not be ignored when considering your plan. Related: Manure Pathogens

Avian Influenza | Swine PEDv | Pumping & Land Application | Inspectors | Mortalities | Recommendations by Species

Avian Influenza Resources

Since 2015, millions of birds have either died or had to be euthanized because of highly pathogenic avian influenza (HPAI). The approved methods of disposal for large-scale (catastrophic) mortalities include: burial, incineration, and composting.

PEDv (Porcine Epidemic Diarrhea virus) Resources

The swine industry has experienced significant losses as a result of PEDv, which can be transmitted through contact with manure of infected pigs. It is possible to move the virus between farms on vehicles, pumps, manure handling equipment, clothing, or any other item that comes in contact with manure and is not thoroughly disinfected between farms/fields. The low amount of viral exposure required to cause illness means that even tiny amounts of residual manure pose significant biosecurity risks.

Preventing Manure Pathogen Dispersal Between Farms or Field

Restricting access of off-farm equipment and personnel involved in manure pumping or manure application and thorough cleaning of equipment between farms are among the recommendations to follow to reduce risks of spreading manure-borne pathogens.

    • North Dakota State Biosecure Nutrient Management. This fact sheet does an especially nice job describing how to manage and clean equipment used in manure handling around the farm.
    • The National Pork Board released fact sheets on Biosecure Manure Pumping Procedures for farmers (pg 20), commercial manure haulers (pg 22), and land owners (pg 20).
    • The Maryland Department of Agriculture developed a brochure related to transporting manure and set out some guidelines to prevent the spread of pathogens.

Biosecurity for Inspectors or Technical Service Providers

What should regulatory inspectors do when traveling between farms to prevent the spread of disease? What requests can farmers make of inspectors to protect their farm biosecurity?

Biosecure Mortality Management

One of the best collections on composting animal mortalities comes from the Cornell Waste Management Institute. Check out their sections on health and safety and animal mortality composting for research on pathogen destruction and other safety considerations.

The following fact sheet was developed in response to the PEDv (porcine epidemic diarrhea virus), although these guidelines should be effective for reducing the risks related to other pathogens. It focuses on the use of rendering as the main mortality disposal method. Biosecure Mortalities Removal (pg 10)

Farmer & Farm Worker Biosecurity Resources

The following resources are not focused on managing manure but give a great overview of the larger biosecurity issue and practices on livestock and poultry farms.

Swine

farm worker in a confined swine barn
This farm worker follows the farm biosecurity protocol and is wearing coveralls and boots that are cleaned and laundered on-site.

Poultry

Dairy

Beef Cattle

Goats and Sheep

Feed Management and Phosphorus Excretion in Dairy Cows

What Is the Connection between Phosphorus and Water Quality?

Holstein Cow

“Phosphorus (P) is an essential element for plant and animal growth and its input has long been recognized as necessary to maintain profitable crop and animal production. Phosphorus inputs can also increase the biological productivity of surface waters by accelerating eutrophication. Eutrophication is the natural aging of lakes or streams brought on by nutrient enrichment. This process can be greatly accelerated by human activities that increase nutrient loading rates to water. Eutrophication has been identified as the main cause of impaired surface water quality (U.S. Environmental Protection Agency 1996). Eutrophication restricts water use for fisheries, recreation, industry, and drinking because of increased growth of undesirable algae and aquatic weeds and the oxygen shortages caused by their death and decomposition.” Reprinted with permission from the author: Sharpley et al., 2003)

The association of P with eutrophication of surface waters has resulted in a significant focus on the role of P in animal agriculture. P-related research in recent years has concentrated on two main areas: reducing P excretion from livestock and application and transport of P on agricultural fields. Lowering dietary P concentration has been a means of reducing P inputs to dairy operations. In 2003, a report indicated that, on average, dietary P concentrations were 34% above recommended levels. Reducing the dietary P concentrations in dairy cattle diets to recommended concentrations has not negatively impacted milk production, health, or reproductive parameters. The economic advantages of reducing P imports to the farm have helped to improve industry acceptance of this management practice and have led dairy producers and nutritionists to reduce the P concentrations in dairy diets. (Reprinted with permission from the author: Harrison et al., 2007).

References

Harrison, J. H., T. D. Nennich, and R. White. 2007. Review: Nutrient management and dairy cattle production. CABI Publishing 2007 (Online ISSN 1749-8848). Available online at https://www.cabi.org/cabreviews/review/20073124579 (Verified 14 December, 2010).

Sharpley, A.N., T. Daniel, T. Sims, J. Lemunyon, R. Stevens, and R. Parry. 2003. Agricultural Phosphorus and Eutrophication, 2nd ed. U.S. Department of Agriculture, Agricultural Research Service, ARS–149, 44 pp.

Research Project on Phosphorus Feed Management

A project started in February 2009 to enhance feed management practices to reduce manure phosphorus excretion in dairy cattle. This project takes an “integrated approach” to increase the adoption of reduced phosphorus feeding on dairy farms.

Overall Goal

Improve our accuracy of meeting the phosphorus requirement of the dairy cow without oversupplying phosphorus in the ration by better understanding the availability of phoshorus in feedstuffs (reduce current practices of overfeeding phosphorus to ensure that the animal requirements of phosphorus are met).

Project Funding

This project has been funded by the USDA National Research Initiative Program from 2009 through 2012.

Project Team

Project Director: Katharine Knowlton Virginia Tech Department of Dairy Science
Email: knowlton@vt.edu

Charlie Stallings Virginia Tech Department of Dairy Science
Email: cstallin@vt.edu

Bob James Virginia Tech Department of Dairy Science
Email: jamesre@vt.edu

Mark Hanigan Virginia Tech Department of Dairy Science
Email: mhanigan@vt.edu

Joe Harrison Washington State University, Puyallup
Email: jhharrison@wsu.edu

Sandy Anderson Washington State University, Puyallup
Email: sandra_anderson@wsu.edu

What We Expect to Achieve

  • Develop analytical techniques to improve assessment of phosphorus digestion and excretion in lactating cows.

To view a larger version of this diagram click on Phosphorus Metabolism in Dairy Cattlecc2.5 Katharine Knowlton

  • Evaluate the variation in digestion and excretion of phosphorus-containing compounds in lactating cows using the newly developed analytical techniques.


Tzu-Hsuan Yang, Virginia Tech grad student, analyzing samples with nuclear magnetic resonance. cc2.5 Katharine Knowlton


  • Develop and test a model that will more accurately estimate phosphorus digestion and metabolism in lactating cows. The model will be used in dairy cattle ration formulation.


To a view a larger version of this diagram click on Phosphorus Digestion and Metabolism Modelcc2.5 Katharine Knowlton


  • Develop, implement, and assess an effective information transfer process to encourage adoption of research findings via educational tools and on-farm assessment.


Dr. Bob James, Virginia Tech dairy science professor, is leading a project where nine Virginia dairy farms have implemented feed management software to improve feed management through ration formulation and more accurate mixing and delivery of rations. cc2.5 Bob James and Lynn VanWieringen.


Outreach Opportunities:

Our team is ready and willing to serve as speaker for nutrition conferences on the following topics:

  • Using feed management software to improve farm profitability and whole farm nutrient balance – Dr. Bob James Email: jamesre@vt.edu
  • Incentive payments to reduce overfeeding of phosphorus – Dr. Charlie Stallings Email: cstallin@vt.edu
  • Next generation of precision feeding – Where are we going from here? – Dr. Katharine Knowlton and Dr. Mark Hanigan Emails: knowlton@vt.edu, mhanigan@vt.edu
  • Modeling Phosphorus Digestion to Improve Predictions in Ration Balancing Software – Dr. Mark Hanigan Email: mhanigan@vt.edu

Presentations:

Impact of feed management software on feeding management and whole farm nutrient balance of Virginia dairy farms

Robert James, B. E. Cox, C. S. Stallings, K. F. Knowlton, M. Hanigan

Virginia Tech – jamesre@vt.edu

The impact of precision feeding utilizing feed management software on whole farm nutrient balance (WFNB), dietary phosphorus, and feeding management was studied on nine treatment and six control farms selected in four regions of the Chesapeake Bay Watershed of Virginia from 2006 through 2008. Herd sizes averaged 271 and 390 lactating cows, and milk yield averaged 30 and 27 kg/cow/d for treatment and control farms. Crop hectares averaged 309 and 310 for treatment and control farms. Treatment farms installed feed management software between May and October 2006. Data were collected for calendar year 2005 and each calendar year through 2008 to compute WFNB. On treatment farms, up to five feed samples were obtained monthly including each total mixed ration (TMR) fed to lactating cows. Control farms submitted TMR samples every two months. Standard wet chemistry analysis of samples was performed. Feed management data stored in the software were collected monthly from each treatment farm concurrent with feed sampling. Daily overfeeding of all dietary ingredients across treatment farms averaged 1.25% ± 5.86, ranging from -67.28% to +54.57% during the first year of the trial. This corresponded to average daily overfeeding of CP and P of 2.26% ± 6.88 and 1.91% ± 6.39, respectively for 2006. Whole farm nutrient balance did not differ between treatment and control farms for 2006. However, eight of nine treatment herds qualified for incentive payments for limiting P intake to less than 120% of NRC requirements in 2006. Data from 2007 and 2008 indicated that herds utilizing feed management software formulated and fed rations that were within 116% of NRC requirements for P. Data from feed management software revealed that extensive use of by-product feeds and the high nutrient variability of forages contributed to overfeeding of both CP and P. Category: Agricultural BMPs

View slide show

This presentation was presented at the 2011 American Dairy Science Meetings in New Orleans by Partha Ray, M D Hanigan, and K F Knowlton.

Quantification of phytate in dairy digesta and feces using alkaline extraction and HPIC


Publications:

Using Incentive Payments to Reduce Overfeeding of Phosphorus

This poster was presented at the 2010 Land Grant and Sea Grant National Water Conference by Charles C. Stallings, K. F. Knowlton, R. E. James, and M. D. Hanigan.

View Dairy Incentive Poster

Total and inorganic phosphorus content of an array of feedstuffs

This poster was presented at the 2011 American Dairy Science Meetings in New Orleans by Jamie Jarrett, M D Hanigan, R Ward, P Sirois, and K F Knowlton.

Total and inorganic phosphorus content of an array of feedstuffs

Fate of phosphorus in large intestine of dairy heifers

This poster was presented at the 2011 American Dairy Science Meetings in New Orleans by Partha Ray, M D Hanigan, and K F Knowlton.

 Fate of phosphorus in large intestine of dairy heifers

Webcasts:

Precision Phosphorus Feeding for Dairy Cows

This presentation was originally broadcast on March 19, 2010. There are four short presentations:

  • Dietary Nutrient Management: What Goes In Must Come Out – Dr. Mark Hanigan, Department of Dairy Science, Virginia Tech
  • Precision Phosphorus Feeding Incentive Program – Dr. Charles Stallings, Department of Dairy Science, Virginia Tech
  • Impact of Feed Management Software on Feeding Management and Whole Farm Nutrient Balance – Dr. Robert James, Department of Dairy Science, Virginia Tech
  • Questions and Answers

View Presentation: Precision Phosphorus Feeding for Dairy Cows

Precision Phosphorus Feeding for Dairy Farms

Katharine Knowlton and Jimmy Huffard

During this session on February 7, 2011, Katharine Knowlton of Virginia Polytechnic Institute and State University and Jimmy Hufard, a dairy producer in Virginia, discussed regulations pertaining to phosphorus and how these can affect the dairy farm.

View Presentation: View Presentation of Precision Phosphorus Feeding for Dairy Farms

View Slide Show from presentation:

For an outline of the materials presented, see: Presentation Transcript

Page Manager: Sandy Anderson

How much land will I need for land-applying manure from dairy cattle?

Many factors impact land requirements including:
1) Dairy feeding program: Feeding excess protein or P increases N and P excretion.
2) Animal performance: Higher-producing cows excrete more manure; 90 lb milk/day was assumed in the example below.
3) Crop yields: A 24-ton/acre and 6-ton/acre yield for corn silage and alfalfa was assumed in the example below.
4) Use of manure on legume crops: Lack of economic return from manure N and possible damage to alfalfa may discourage use of manure on alfalfa by some dairies.

An additional factor is whether a nutrient plan is based on nitrogen (N) or phosphorus (P). For a crop rotation that is predominantly corn silage and alfalfa hay, the approximate land requirement per lactating cow is shown below for a manure system that conserves N and for three distinct dairy rations:

Manure Applied to Corn Only: N / P-based rates
Current Recommendations (18.5% CP & 0.33 %P): 3.1 / 3.1 acres per cow.
Ration with 30% DGS (20.4% CP & 0.45% P): 3.6 / 3.8 acres per cow.
Ration from 10 years ago (18.5% CP & 0.5% P): 3.1 / 4.1 acres per cow.

Manure Applied to Corn and Alfalfa: N / P-based rates
Current Recommendations (18.5% CP & 0.33 %P): 1.7 / 1.7 acres per cow.
Ration with 30% DGS (20.4% CP & 0.45% P): 1.9 / 2.0 acres per cow.
Ration from 10 years ago (18.5% CP & 0.5% P): 1.7 / 2.2 acres per cow.

30% DGS: 30% inclusion of distillers grains with solubles on a dry matter basis.

Several observations result from this information. First, a traditional rule of thumb of 1 acre per cow is possibly too simplistic for modern dairy cattle. Second, as the concentration of P in the dairy ration has decreased, N often becomes the limiting nutrient for manure application, and so an N and P-based application rate is often similar (this is true for nitrogen-conserving system only and assumes that manure application never exceeds N requirement). Third, use of DGS in the diet increases both N and P excretion and the resulting land required for managing manure.

Tools and fact sheets to assist dairy nutrient planning can be found at eXtension LPE Feed Management. To determine land requirements for your own farm, you may want to enter your own farm-specific information into a Nutrient Inventory spreadsheet.

Author: Rick Koelsch, University of Nebraska

What’s the P Index?

The P Index is the Phosphorus Index, a risk assessment tool to quantify the potential for phosphorus runoff from a field. The P Index helps to target critical source areas of potential P loss for greater management attention. It includes source and transport factors. Source factors address how much P is available (for example, soil test P level and P fertilizer and manure application amounts). Transport factors evaluate the potential for runoff to occur (for example, soil erosion, distance and connectivity to water, soil slope, and soil texture). The P Index allows for relative comparisons of P runoff risk. When the P Index is high, recommendations are made either to apply manure on a P basis or not to apply manure at all. When the P Index is low, manure can be applied on a N basis. Also, if the P Index is high, the factors that are responsible for the higher risk of P loss are identified, and this information provides guidance for management practices to reduce the risk. For example, if the P Index is high because of high soil erosion, a recommendation to implement soil conservation best management practices (BMPs) may lower the risk and allow safe manure application.

For additional information:

To find your state’s P Index, do a web search for “phosphorus index” plus your state name.

Author: Jessica Davis, Colorado State University

What is the difference between the “higher heating value” (HHV) and “lower heating value” (LHV) of a biomass fuel, and why is the difference important?

We need these two ways of expressing the heating value of fuels because the combustion of some hydrogen-rich fuels releases water that is subsequently evaporated in the combustion chamber. In other words, the process of evaporating water “soaks up” some of the heat released by fuel combustion. That heat, known as the “latent heat of vaporization,” is temporarily lost and therefore does not contribute to the work done by the combustion process. As a result, the formation and vaporization of water in the combustion chamber reduce the amount of thermal energy available to do work, whether it be driving a piston, spinning a turbine, or superheating steam.

If the water vapor released by fuel combustion simply passes out of the chamber into the environment via the exhaust stream, the latent heat of vaporization is irreversibly and irretrievably lost. That is the case, for example, with most internal-combustion engines, such as diesel and gasoline engines. On the other hand, some advanced boilers have a secondary condensation process, downstream of the combustion step, which condenses the water vapor in the exhaust stream and recovers most of the latent heat being carried with it. The recovered heat can then be used productively.

So, in summary:

1. The numerical difference between the LHV and HHV of a fuel is roughly equivalent to the amount of latent heat of vaporization that can be practically recovered in a secondary condenser per unit of fuel burned.

2. When internal-combustion engines or boilers with no secondary condenser are designed, the appropriate fuel value to use in the design process is the LHV, which assumes that the water vapor generated when the fuel is burned goes out in the exhaust stream.

3. When advanced combustion units having secondary or tertiary condensers are designed, the appropriate fuel value to use in the design process is the HHV.

4. The numerical value of HHV is always greater than or equal to the LHV.

How can I prevent leaching of nitrate into groundwater from manure applications?

Nitrate contamination of groundwater occurs when excess nitrate in the soil profile moves along with water that is moving down past the root zone of the crop. In most cases, it is not possible to keep water from moving past the roots, so the only other option for preventing nitrate leaching is to avoid having excess nitrate present in the root zone during times when leaching events are likely to occur. Determine the available nitrogen content of manure prior to application, and don’t apply more available nitrogen than the crop can use. Make the applications as close to the time the crop will use the nitrogen as possible.

Although only available nitrogen is subject to leaching, organic form nitrogen will become available as it mineralizes, at which time it too can leach if not utilized by the crop. The amount of nitrogen that will mineralize prior to and during the crop season should be taken into account when calculating manure application rates. If significant mineralization from previous applications is expected, plan to have a crop present to utilize it prior to leaching events.

How do you calibrate a manure spreader?

Calibrating a manure spreader is critical to ensure that the appropriate rate of manure nutrients is being applied to a field. For some livestock operations, this practice may be a required practice as part of their permit. Calibration will differ depending on the equipment and type of manure being applied.

If you know the capacity of the spreader, you need to determine the width of each pass and the distance it takes to empty the spreader to determine the rate of application. A measuring wheel is a useful tool and can often be borrowed from a local Cooperative Extension or Natural Resources Conservation Service (NRCS) office. After you have determined both of those measurements, use the charts in the publication linked below to determine application rate.

If the capacity of the manure spreader is unknown and solid manure is being spread, you can use a process that involves setting out plastic sheets or tarps of known size and driving the manure spreader over them and weighing the amount of manure that is collected on the sheets. A 22-square-foot tarp is a convenient size because the net weight of the manure on the sheet will be equal to the application rate in tons per acre. A step-by-step guide on making these calculations for other size tarps is available in the publication linked below.

For more, including specifics on calibrating solid, liquid, and irrigation manure equipment, visit Calibrating Manure Application Equipment.

Author: Jill Heemstra, University of Nebraska Extension Educator

Biofiltration: Mitigation for Odor and Gas Emissions from Animal Operations

Reprinted, with permission, from the proceedings of: Mitigating Air Emissions From Animal Feeding Operations Conference.

The proceedings, “Mitigating Air Emissions from Animal Feeding Operations”, with expanded versions of these summaries can be purchased through the Midwest Plan Service.

This Technology is Applicable To:

Species: Swine, Dairy
Use Area: Animal Housing
Technology Category: Biofilter
Air Mitigated Pollutants: Hydrogen Sulfide, Ammonia, Methane, Volatile Organic Compounds, Odors

System Summary

A biofilter is simply a porous layer of organic material, typically wood chips or a mixture of compost and wood chips, that supports a population of microbes. Odorous building exhaust air is forced through this material and is converted by the microbes to carbon dioxide and water. The compounds in the air are transferred to a wet biofilm that grows on the filter material where microorganisms breakdown the odorous compounds.

Biofiltration can reduce odor and hydrogen sulfide (H2S) emissions by as much as 95% and ammonia by 65%. The method has been used in industry for many years and was recently adapted for use in livestock and poultry systems. Biofilters work in mechanically ventilated buildings or on the pit fans of naturally ventilated buildings. Biofilters can also treat air vented from covered manure storage.

Two configurations of biofilters are being used to treat exhaust air from swine buildings: a horizontal media bed and a vertical media bed. Horizontal biofilters require more land area but are less expensive than vertical biofilters. Horizontal beds can be shallow (< 0.45 m) or deep (> 0.75 m).

Applicability and Mitigating Mechanism

Key factors influencing biofilter size and performance:

  • time the odorous gases spend in the biofilter
  • volume of air treated
  • moisture content of the filter material
  • sizing the biofilter media volume
  • selecting fans capable to push the air through the biofilter
  • choosing biofilter media

Limitations

  • Biofilters are only effective when there is a captured air stream
  • Media moisture content effects the biofilter performance, i.e. dry media results in poor odor reduction
  • Media porosity is related to the fan’s ability to move air through the biofilter. If media is less than 50% porosity most agriculture ventilation fans will not perform satisfactorily

Cost

Costs to install a biofilter include the cost of the materials—fans, media, ductwork, plenum—and labor. Typically, cost for new horizontal biofilter on mechanically ventilated buildings will be between $150 and $250 per 1,700 m3/hr (1,000 cfm). A vertical biofilter is approximately 1.5 times the cost of a horizontal biofilter. Annual operation/maintenance of the biofilter is estimated to be $5-$10 per 1,700 m3/hr (1,000 cfm). This includes the increase in electrical costs to push the air through the biofilter and the cost of replacing the media after 5 years.

Authors

R.E. Nicolai1, K.J. Janni2, D.R. Schmidt21South Dakota State University, 2University of Minnesota
Point of Contact:
Richard Nicolai, richard.nicolai@sdstate.edu

The information provided here was developed for the conference Mitigating Air Emissions From Animal Feeding Operations Conference held in May 2008. To obtain updates, readers are encouraged to contact the author.