Purpose
This research aims to determine the effectiveness of cover crops (CCs) to improving nutrient uptake and soil health in a corn silage-cover crop system. Nutrient accumulation in soils from years of dairy manure or compost applications has increased the level of soil nutrients, creating environmental concerns. The study tests the feasibility and performance of different management strategies using CCs to mine nutrients from agricultural soils and reduce the negative environmental impact of manure or compost application.
What Did We Do?
In one study, two CC mixes (low height or tall) were inter-seeded (dual cropping) with corn silage at two different dates, near the corn planting date and later in the vegetative development. Two post-harvesting management strategies were used by either keeping the CC during the next season or terminating the CC in the spring, before the next corn silage planting. The control had no CC, only the corn silage. In an additional study, a fall CC mix was planted after corn silage harvest (double cropping). Different management strategies were used, including harvesting the CC, simulated grazing, green manuring the CC, and control with no CC. Both studies received the same amount of dairy manure compost annually, plus synthetic fertilizers. All other parameters, including corn planting and harvesting times and irrigation, were the same for both studies and all treatments. Weed management was adjusted using mowing as a method on plots with CCs, and herbicide on plots with no CCs.
What Have We Learned?
This study will continue for two more years. The first year of data collection was 2021. The inter-seeding (dual cropping) study results show very few significant differences in soil analysis comparing CC treatments. There were, however, statistically significant differences between some treatments and the control. This situation indicates that having an actively growing CC influences the soil nutrients and nutrient uptake compared to not having any CC when growing corn silage. The short CC mixes, either planted near the corn planting date or later during the corn vegetative development, tend to have the highest increase in soil OM, especially under reduced or no-till conditions, and reducing soil nitrates, ammonium, and total nitrogen. This can be explained by the better growth of the low mixes that continued growing after the corn silage harvest, compared with the high mixes that were harvested with the corn and rarely regrew after harvesting. CC establishment and growth was a challenge each year due to the corn silage shade. The low CC mix was the only one that was not terminated and continued to grow until after planting the corn silage the following spring. This treatment has proven challenging due to the aggressive CC regrowth and low growth of the corn with the CC competition, even when using strip tillage.
In most years, the previous season CC needed to be terminated to allow for the corn to grow and to reduce weed pressure before replanting the CC again. Soil phosphorous (P) did not show significant differences across treatments and control on the surface level. Phosphorus levels kept increasing during the study, indicating that the application rate far exceeded the crop uptake. In the case of nitrogen, even when CC showed increased nitrogen (N) uptake for all N species, nitrates have accumulated in soils, especially at lower depths, indicating leaching processes in all treatments and much more in the control (Figure 1). Cover crops can uptake some of the excess nitrogen, especially on the soil top layer, reducing the impact of N leaching (Figure 2). Under nutrient overapplication conditions, CCs that have not developed to their full potential cannot handle all the nutrients’ load, thus leaching can still occur. Overall, inter-seeding CC may have a positive impact on nutrient management when managed properly. This positive effect may be complex to quantify when comparing different CC practices with lower-than-ideal CC growth and under nutrient-overapplication conditions.
The second trial with double cropping with a single fall CC mix after harvesting the corn silage was more successful in most years in growing much more CC mass than the inter-seeding CC. The greatest differential was present only for a short period in spring before harvesting or terminating the CC for corn planting. Weed management during the corn growing season was simplified in the double (fall) cropping system. Results on the impact of fall CC and the different treatments compared to the control have not been fully analyzed.
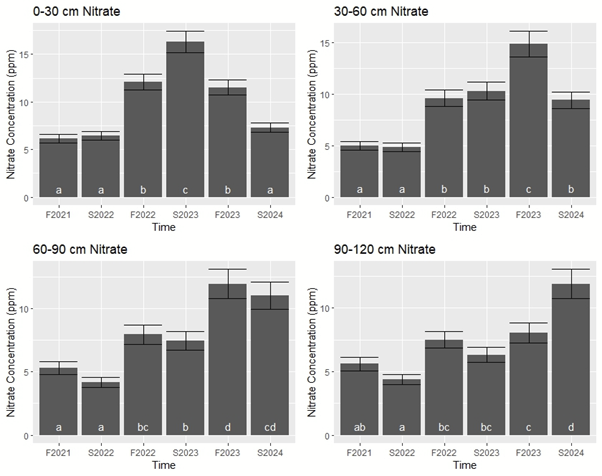
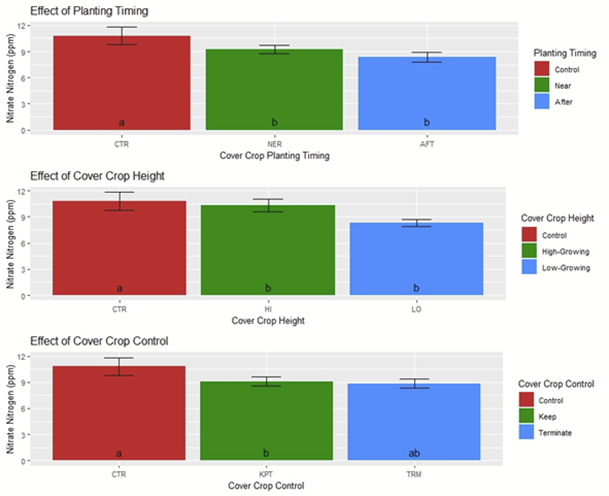
Figure 2. Estimated marginal means of soil nitrate at 0-30 cm depth by CC planting timing, CC height, and CC vs control in an inter-seeding corn silage-cove crop system receiving annual applications of dairy compost and synthetic fertilizer.
Future Plans
There is additional data to analyze in both studies, including other soil chemical parameters, corn silage and CC yields, and feed quality. In the last year, moisture sensors were installed in some plots, measuring and recording soil moisture and temperature at different depths up to three feet. This moisture data at various depths could be correlated with nitrate values and other soil chemical parameters data to determine nutrient leaching, irrigation efficiency, and what role CC may play. Two additional seasons of data will be included to the dataset.
Authors
Presenting & corresponding author
Mario E. de Haro-Martí, Professor and Extension Educator, University of Idaho, mdeharo@uidaho.edu
Additional authors
Linda Schott, Assistant Professor, Extension Specialist, University of Idaho
Miguel Mena, MS Graduate Student, SWS Department, University of Idaho
Steven Hines, Professor and Extension Educator, University of Idaho
Anthony S. Simerlink, Assistant Professor and Extension Educator, University of Idaho
Clarence Robison, Research Support Scientist, University of Idaho
Additional Information
Idaho Sustainable Agriculture Initiative for Dairy website: https://www.uidahoisaid.com/
Acknowledgements
The research team thanks the USDA-ARS Kimberly, ID personnel for their support with machinery and assistance with this project.
Funding for this project was provided by a USDA-NIFA Sustainable Agriculture Systems (SAS) grant #2020-69012-31871.
The authors are solely responsible for the content of these proceedings. The technical information does not necessarily reflect the official position of the sponsoring agencies or institutions represented by planning committee members, and inclusion and distribution herein does not constitute an endorsement of views expressed by the same. Printed materials included herein are not refereed publications. Citations should appear as follows. EXAMPLE: Authors. 2025. Title of presentation. Waste to Worth. Boise, ID. April 7-11, 2025. URL of this page. Accessed on: today’s date.