Purpose
Idaho ranks in the top 10 in the US for dairy, potato, barley, hay, sugarbeet, corn silage, and dry bean production with the highest producing area being in South Central Idaho. Crop and livestock producers in the Magic Valley depend on affordable access to clean water, healthy and productive soils, and quality grazing land to remain profitable. However, portions of the Middle Snake River, which provides irrigation and drinking water to the Magic Valley, have been impaired by high phosphorous and sediment loading for over two decades (Tetra Tech, 2014). To measure progress in producer efforts for reducing erosion and runoff, appropriate methods need identified. The soils in this region are prone to crusting, have low organic matter, and are high in calcium carbonates making these soils unique to much of the United States. Thus, the overall goal of this project was to identify management practices that enhance soil health physical properties in the Magic Valley.
What Did We Do?
Two study sites were located on the USDA-ARS Northwest Irrigation & Soils Research Laboratory farm in Kimberly, Idaho, and were established in 2013 (Long-Term Manure) and 2016 (Cover Crop). Long-Term Manure was set up as a randomized complete block design with four replicates and eight treatments. The treatments are as follows: annual application of solid dairy manure at rates of (i) 10, (ii) 20, and (iii) 30 ton per acre(dry weight), biennial application of solid dairy manure at rates of (iv) 10, (v) 20, and (vi) 30 ton per acre (dry weight), (vii) application of inorganic fertilizer (applied to match manure N and P rates; Fert), and (viii) no amendments (Control). A commercial crop rotation of wheat-potato-barley-sugarbeet was used at this study site, and sampling occurred under sugarbeet in 2020. All plots were disked immediately after manure application, and all plots were moldboard plowed prior to sugarbeet and potato planting. The Cover Crop study was set up as a split plot design with four replications and tillage as the main experimental factor (strip till vs disk/chisel plow). The four sub-treatments are as follows: (a) no cover crop or dairy manure (Control), (b) cover crop only (CC only), (c) manure only (M only), and (d) cover crop with manure (CC + M). Treatments that did not receive manure received inorganic fertilizer to meet recommended crop needs based on spring soil tests. Inorganic fertilizer was only applied to manure treatments if spring soil tests indicated that additional nutrients were required and the manure did not meet the crop needs. From 2016 to 2021, the field was cropped with continuous silage corn. Triticale was used as a winter forage cover crop and was planted directly after manure application and was harvested within one week of corn planting. Stockpiled dairy manure was applied at a rate of 30 ton per acre (dry weight) in the fall after corn silage harvest and incorporated by disking or left on the surface.
The physical properties accessed for each study in late summer 2020 were soil aggregate stability, runoff rate and rainfall before runoff, bulk density, and compaction. Two methods were used to measure soil aggregate stability: wet sieving and a hybrid method utilizing a Cornell Sprinkle Infiltrometer (CSI). The wet sieving method incorporated four nested stainless steel wire sieves at particle diameters of 5/32, 5/64, 1/64, and 0.002 inch. The samples were submerged in 9.5 inch of water oscillating up and down 1.5 inch at 30 oscillations per minute for 10 minutes. A CSI was used to measure soil aggregate stability at the heights of 1, 3, and 5 feet. The CSI operated at a constant rainfall rate of 0.79 inch of rainfall per 10 min of operation. Runoff rate and rainfall before runoff were calculated based on the values collected from the CSI using the equations listed in van Es and Schindelbeck (2001). The CSI was placed on top of a metal ring (9.5 inch diameter), and a runoff tube was fitted in the metal ring to measure runoff. The CSI had an air entry of 3.9 inch, and data was recorded every 2 minutes once runoff started to occur until the outflow reached steady state. Because each measurement took a minimum of one hour, only one block was measured each day for a total of four days. Bulk density measurements were taken at depths of 0-2, 2-4, and 4-6 inch at each plot. Compaction was measured using a penetrometer to measure a total depth of 12 inch at increments of 1 inch.
What Have We Learned?
Two methods (wet sieving and CSI hybrid) were compared for accessing soil aggregate stability among the two studies. No differences in aggregate stability were found when the wet sieving method was used among treatments for both studies (Figure 1). However, the CSI hybrid method was found to be statistically different at an operational height of 1 foot among treatments at mean values of 0.147 ± 0.005 inch (CC + M), 0.145 ± 0.005 inch(CC only), and 0.146 ± 0.005 inch (M only) as compared to the control (0.124 ± 0.005 inch) for the Cover Crop study. It is also clear that there are large numerical differences in mean weight diameters between the operational heights for the Cover Crop study.

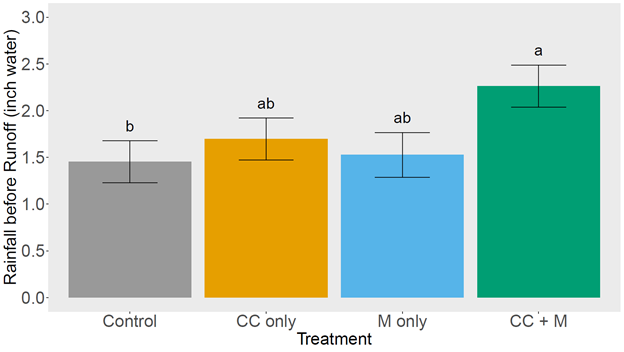
Significant differences in rainfall before runoff were found between treatments in the Cover Crop study, and the mean values were 2.26 ± 0.23 in (CC + M), 1.70 ± 0.23 in (CC only), and 1.53 ± 0.23 in (M only) when compared to the control (1.45 ± 0.23 in) (Figure 2). No differences were found in the Long-Term Manure study. When measuring bulk density, it was found that measurements at the 0–2-inch depth were found to be statically significant (p≤0.05) with means of 52.7 ± 3.7 pound per cubic foot (CC + M), 59.6 ± 3.7 pound per cubic foot (CC only), and 49.4 ± 3.7 pound per cubic foot (M only) when compared to the control (65.9 ± 3.7 pound per cubic foot), respectively. Compaction was found to be statistically significant at the depths of 1 through 4 inch and 10 and 12 inches. The tillage by treatment effect was also found to be statistically significant at 2 and 3 inches. Assessing physical properties among management practices can give producers a clearer insight into soil health in the Magic Valley.

Future Plans
At the Long-Term Manure study site, dairy manure was applied annually or biannually from 2013-2019. The project now focuses on nutrient drawdown and manure will no longer be applied. Cover crops may be incorporated into the project. At the Cover Crop study site, inversion tillage will be performed spring of 2022 prior to planting silage corn to incorporate the dairy manure into the topsoil. Dairy manure has not been applied to the field since fall of 2020. Inorganic fertilizer will be applied if needed.
Authors
Presenting author
Kevin Kruger, Research Support Scientist, University of Idaho
Corresponding author
Linda R. Schott, Nutrient and Waste Management Extension Specialist, University of Idaho
Corresponding author email address
Additional authors
Jenifer L. Yost, Research Soil Scientist, USDA-ARS; April B. Leytem, Research Soil Scientist, USDA-ARS; Robert S. Dungan, Research Microbiologist, USDA-ARS; Amber D. Moore, Soil Fertility Specialist, Oregon State University
Additional Information
Part of this research was presented at the ASA, CSSA, SSSA International Annual Meeting in Salt Lake City, Utah, in November of 2021. The link to the recorded presentation is found in the citation below:
Yost, J.L., Kruger, K., Leytem, A.B., Dungan, R.S., & Schott, L.R. (2021). Measuring Soil Aggregate Stability Using Three Methods in Aridisols Under Continuous Corn in Southern Idaho [Abstract]. ASA, CSSA, SSSA International Annual Meeting, Salt Lake City, UT.
https://scisoc.confex.com/scisoc/2021am/meetingapp.cgi/Paper/138171
More information about the Long-Term Manure project can be found in the following scientific papers:
Leytem, A.B., Moore, A.D., & Dungan, R.S. (2019). Greenhouse gas emissions from an irrigated crop rotation utilizing dairy manure. Soil Science Society of America Journal, 83, 137-152.
https://eprints.nwisrl.ars.usda.gov/id/eprint/1693/
Bierer, A.M., Leytem, A.B., Dungan, R.S., Moore, A.D., & Bjorneberg, D.L. (2021). Soil organic carbon dynamics in semi-arid irrigated cropping systems. Agronomy, 11, 484.
https://doi.org/10.3390/agronomy11030484
The papers that were referenced in this proceedings paper are:
Reynolds, W. D., & Elrick, D. E. (1990). Ponded infiltration from a single ring: I. Analysis of steady flow. Soil Science Society of America Journal, 54, 1233–1241.
https://doi.org/10.2136/sssaj1990.03615995005400050006x.
Tetra Tech. (2014). Reevaluation of Mid Snake/Upper Snake-Rock Subbasin TMDL: Data Summary, Evaluation, and Assessment.
van Es, H. & Schindelbeck, R. (2001). Field Procedures and Data Analysis for the Cornell Sprinkler Infiltrometer. Department of Crop and Soil Science Research Series R03-01. Cornell University.
Acknowledgements
This project was funded by a USDA ARS Cooperative Agreement and USDA NIFA Project Number IDA01657. The authors would like to thank Emerson Kemper for assisting with the lab work and Peiyao Chen for assisting with field work.
The authors are solely responsible for the content of these proceedings. The technical information does not necessarily reflect the official position of the sponsoring agencies or institutions represented by planning committee members, and inclusion and distribution herein does not constitute an endorsement of views expressed by the same. Printed materials included herein are not refereed publications. Citations should appear as follows. EXAMPLE: Authors. 2022. Title of presentation. Waste to Worth. Oregon, OH. April 18-22, 2022. URL of this page. Accessed on: today’s date.