While anaerobic digestion is often touted for producing renewable energy/fuels, producers at concentrated animal feeding operations (CAFOs) are often most concerned about nutrient loading, an issue that has garnered increasing regulatory scrutiny. Anaerobic digestion, while a carbon management tool capable of producing carbon fuels, does little in regard to nitrogen and phosphorus management. Thus digestion projects, if they are to meet producer needs, must incorporate downstream separation to recover nutrients and protect soils. This presentation highlights the key environmental issues and hurdles facing manure management and disposal and lays the framework for a needed focus on combined anaerobic digestion and nutrient recovery systems capable of meeting producer and regulatory needs regarding nutrient management.
Why Review Nutrient Recovery Technologies for Anaerobic Digestion?
A literature review and conversations with dairy farmers both suggest that improving manure nutrient management is a major concern for dairy producers. This supports the conclusion that ongoing research and development efforts to support development of nutrient recovery technologies, including those that can be used in concert with anaerobic digestion (AD), will be key to enhancing adoption rates for AD technology.
What did we do?
A literature review was used to support and enhance findings from conversations with farmers about anaerobic digestion technologies.
What have we learned?
Managing manure is major consideration for dairy producers, and one that comes with high potential costs in areas where there are few crop producers willing to accept manure (USDA ERS 2009). Dairies in many regions of the U.S. are facing increased pressure from growing public concern about nutrient-related water and air quality issues. In some cases, regulation of dairies has increased.
As a result, there is increased interest from dairy producers and others in nutrient recovery technologies. Although no technologies are widely commercialized at present, several emerging nitrogen and phosphorus recovery technologies exist. Some of these technologies are most appropriately used on specific forms of untreated dairy manure (e.g. scrape, flush), while others are more appropriate when combined with AD as part of an AD system (Figure 1).
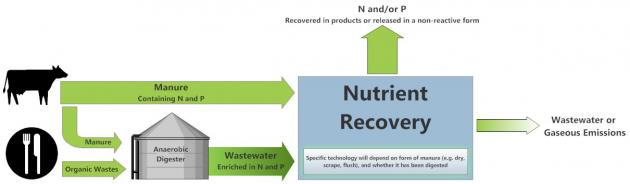
Figure 1. Nutrient recovery fact sheet diagram

Figure 2. Overhead view of a nutrient recovery system for nitrogen and phosphorus.
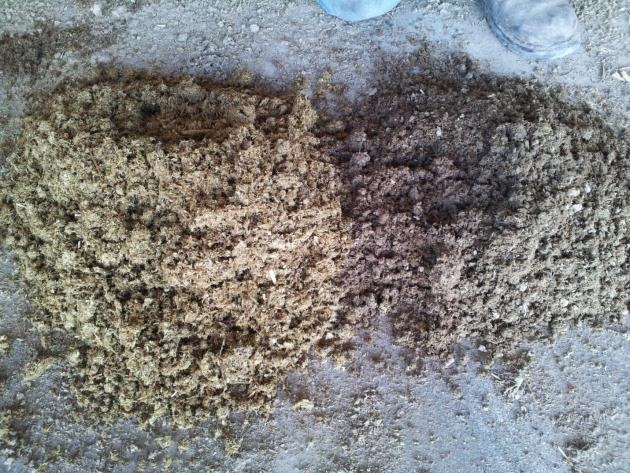
Approaches also vary in that some recover both phosphorus and nitrogen (Figure 2), while others focus on only one nutrient (Figure 3). Some nutrient recovery processes dispose of these nutrients in form that is non-reactive, and therefore not problematic environmentally. However, most nutrient recovery technologies produce concentrated nutrient products that can be transported more easily, and economically, than manure. The most promising technologies also make products with characteristics (e.g. homogenous and predictable nutrient content, easy to handle, reduced pathogen counts or pathogen-inert chemicals) that make them more appealing to crop producers than manure.
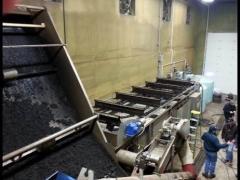
Figure 3. Commercial scale recovery of phosphorus.
With further technological and market development, these technologies have the potential to transform dairy manure nutrient management. They may also become a cost-effective approach to improving nutrient management at a watershed level, through the replacement of imported chemical nutrients by crop-farms with manure-derived nutrients already in the watershed. However, nutrients can still be lost from nutrient recovery products or from the wastewater that normally is a by-product of nutrient recovery. This is especially true if these are applied with improper application rates or timing. Nutrient recovery technologies therefore need to be used as part of a comprehensive watershed-level strategy that addresses nutrient balance, equitable distribution of costs and benefits, and improved nutrient application timing and methodology.
Nutrient recovery could also encourage adoption of anaerobic digestion technologies. Although anaerobic digestion changes the form of nitrogen and phosphorus in manure, it does not appreciably decrease the total amount of nutrients, most of which are concentrated in the liquid effluent that is a product of the AD process (Frear et al. 2012). Also, co-digestion of dairy manure with additional organic food wastes can import nutrients to the farm, exacerbating existing nutrient management issues. Nutrient recovery can make AD more appealing to dairy producers by addressing one of their most important concerns. Meanwhile, potential income from the sale of recovered nutrients can contribute to the economic feasibility of an AD project.
Future Plans
The authors and collaborators are continuing efforts to review existing information about nutrient recovery systems (see talk by Jingwei Ma et al., Nutrient Recovery Technologies—A Primer on Available and Emerging Nitrogen, Phosphorus, and Salt Recovery Approaches, their Performance and Cost). They are also continuing technological development and commercialization efforts for specific nutrient recovery technologies.
Authors
Georgine Yorgey, Research Associate at Center for Sustaining Agriculture and Natural Resources, Washington State University yorgey@wsu.edu
Craig Frear, Assistant Professor in the Department of Biological Systems Engineering, Washington State University, and Chad Kruger, Director, Center for Sustaining Agriculture and Natural Resources, Washington State University
Additional Information
The topics covered in this presentation are covered in more depth in a factsheet that is available from Washington State University Extension. The Rationale for Recovery of Phosphorus and Nitrogen from Dairy Manure is available at https://pubs.extension.wsu.edu/the-rationale-for-recovery-of-phosphorus-and-nitrogen-from-dairy-manure-anaerobic-digestion-systems-series. This document is part of a series of extension documents on Dairy AD Systems, being prepared by the authors and other colleagues at Washington State University.
References:
Frear, C., W. Liao, T. Ewing, and S. Chen. 2012. Evaluation of Co-digestion at a Commercial Dairy Anaerobic Digester. Clean Water, Air, and Soil, 39 (7): 697-704.
USDA-ERS. 2009. Manure Use for Fertilizer and for Energy. Report to Congress. United States Economic Research Service. Washington, DC.
Acknowledgements
This work was supported by funding from USDA National Institute of Food and Agriculture, Contract #2012-6800219814; National Resources Conservation Service, Conservation Innovation Grants #69-3A75-10-152; and Biomass Research Funds from the WSU Agricultural Research Center.
The authors are solely responsible for the content of these proceedings. The technical information does not necessarily reflect the official position of the sponsoring agencies or institutions represented by planning committee members, and inclusion and distribution herein does not constitute an endorsement of views expressed by the same. Printed materials included herein are not refereed publications. Citations should appear as follows. EXAMPLE: Authors. 2015. Title of presentation. Waste to Worth: Spreading Science and Solutions. Seattle, WA. March 31-April 3, 2015. URL of this page. Accessed on: today’s date.


 ost basic then drilling down to peer-reviewed publications, data from life-cycle assessment studies and models related to the topics. The Virtual Farm focuses on decision makers and stakeholders including consumers, producers, policymakers, scientists and students who are interested in milk production on modern dairy farms. The top entry level of the site navigates through agricultural topics of interest to the general public. Producers can navigate to a middle level to learn about practices and how they might help them continue to produce milk for consumers responsibly in a changing climate while maintaining profitability. Featured beneficial (best) management practices (BMPs) reflect options related to dairy sustainability, climate change, greenhouse gas emissions, and milk production. Researchers can navigate directly to deeper levels to publications, tools, models, and scientific data. The website is designed to encourage users to dig deeper and discover more detailed information as their interest develops related to sustainable dairies and the environment.


 Agriculture releases significant amounts of CO2, CH4 and N2O to the atmosphere. It is estimated that the agriculture sector contributes around 10-12% (~ 5-6 Gt CO2-equivelents yr-1 in 2005) of total global anthropogenic GHG emissions, which is about 50 and 60% of methane and nitrous oxide emissions, respectively. UGA made a commitment to reduce the GHG emissions. These emissions are currently calculated using a model called campus-carbon-calculator. However this model is limited in agricultural applications because it does not account for many management changes that might reduce GHG emissions. The purpos e of our project was to select or develop a model for estimating the GHG emissions from UGA farms. It was necessary for this model to account for crop production, dairy production and swine production and desirable for the model to have limited data requirements, be easy to use and allow for a variety of management options to reduce GHG emissions.
 What have we learned?
 What did we do?