USDA-NRCS and the National Air Quality Site Assessment Tool (NAQSAT) for Livestock and Poultry Operations

Proceedings Home | W2W Home w2w17 logo

Purpose

The National Air Quality Site Assessment Tool (NAQSAT) was developed as a first-of-its-kind tool to help producers and their advisors assess the impact of management on air emissions from livestock and poultry operations and identify areas for potential improvement related to those air emissions.

What did we do?

In 2007, several land-grant universities, with leadership from Michigan State University, began developing NAQSAT under a USDA-NRCS Conservation Innovation Grant (CIG). The initial tool included beef, dairy, swine, and poultry operations. A subsequent CIG project, with leadership from Colorado State University, made several enhancements to the tool, including adding horses to the species list. In 2015, USDA-NRCS officially adopted NAQSAT as an approved tool for evaluating air quality resource concerns at livestock and poultry operations. USDA-NRCS also contracted with Florida A&M University in 2015 to provide several regional training workshops on NAQSAT to NRCS employees. Six training workshops have been completed to date (Raleigh, NC; Modesto, CA; Elizabethtown, PA; Lincoln, NE; Richmond, VA; and Yakima, WA) with assistance from multiple NAQSAT development partners. Additionally, USDA-NRCS revised its comprehensive nutrient management plan (CNMP) policy in October 2015 to make the evaluation of air quality resource concerns mandatory as part of CNMP development.
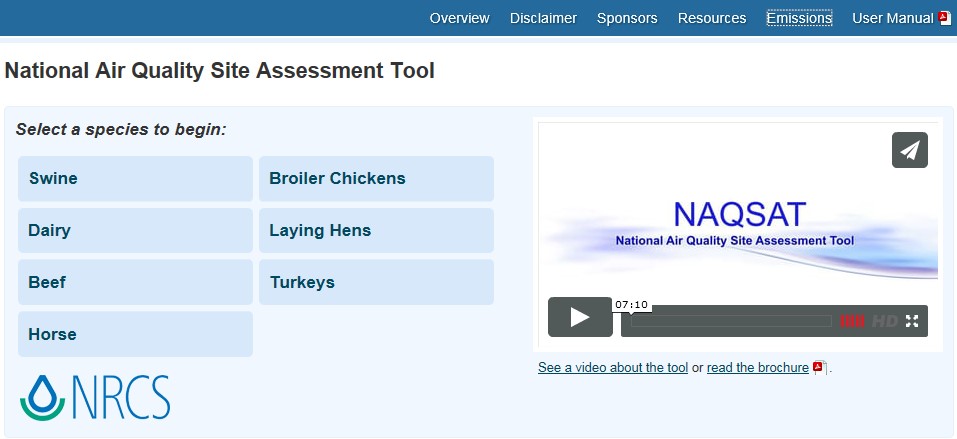
Snippet from website of the National Air Quality Site Assessment Tool

Group photo of team in field

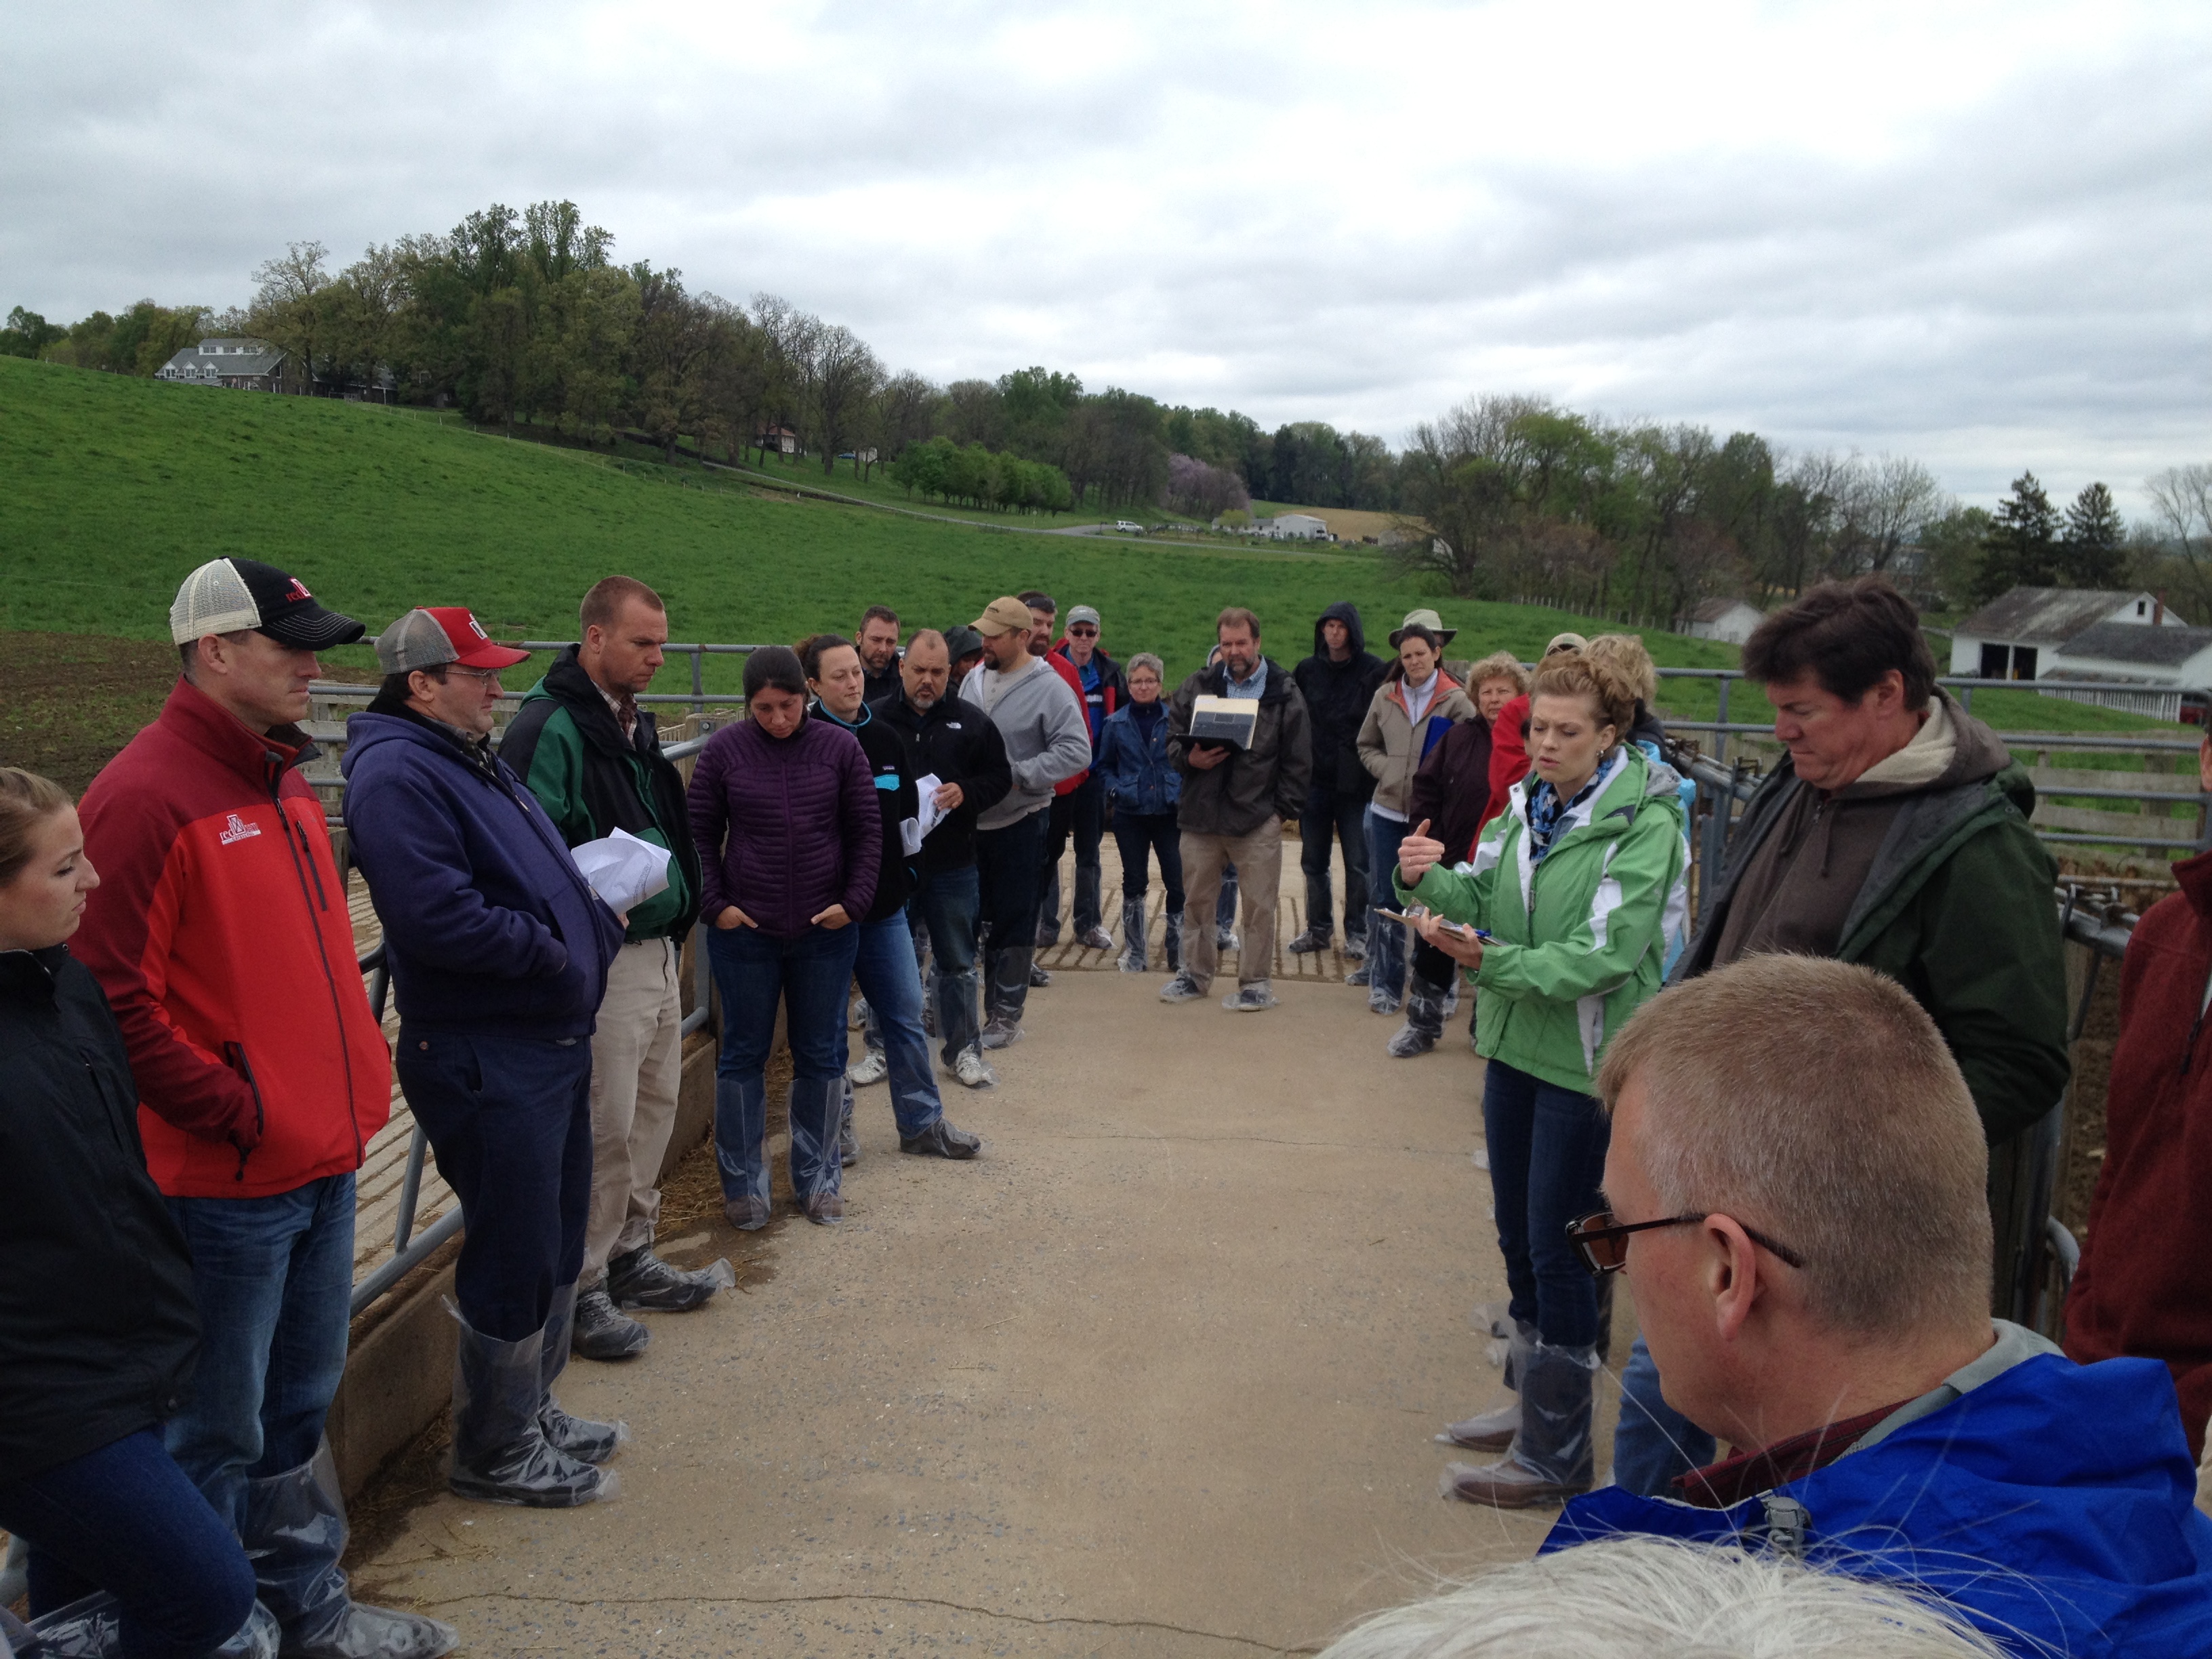
Zwicke in class lecturing

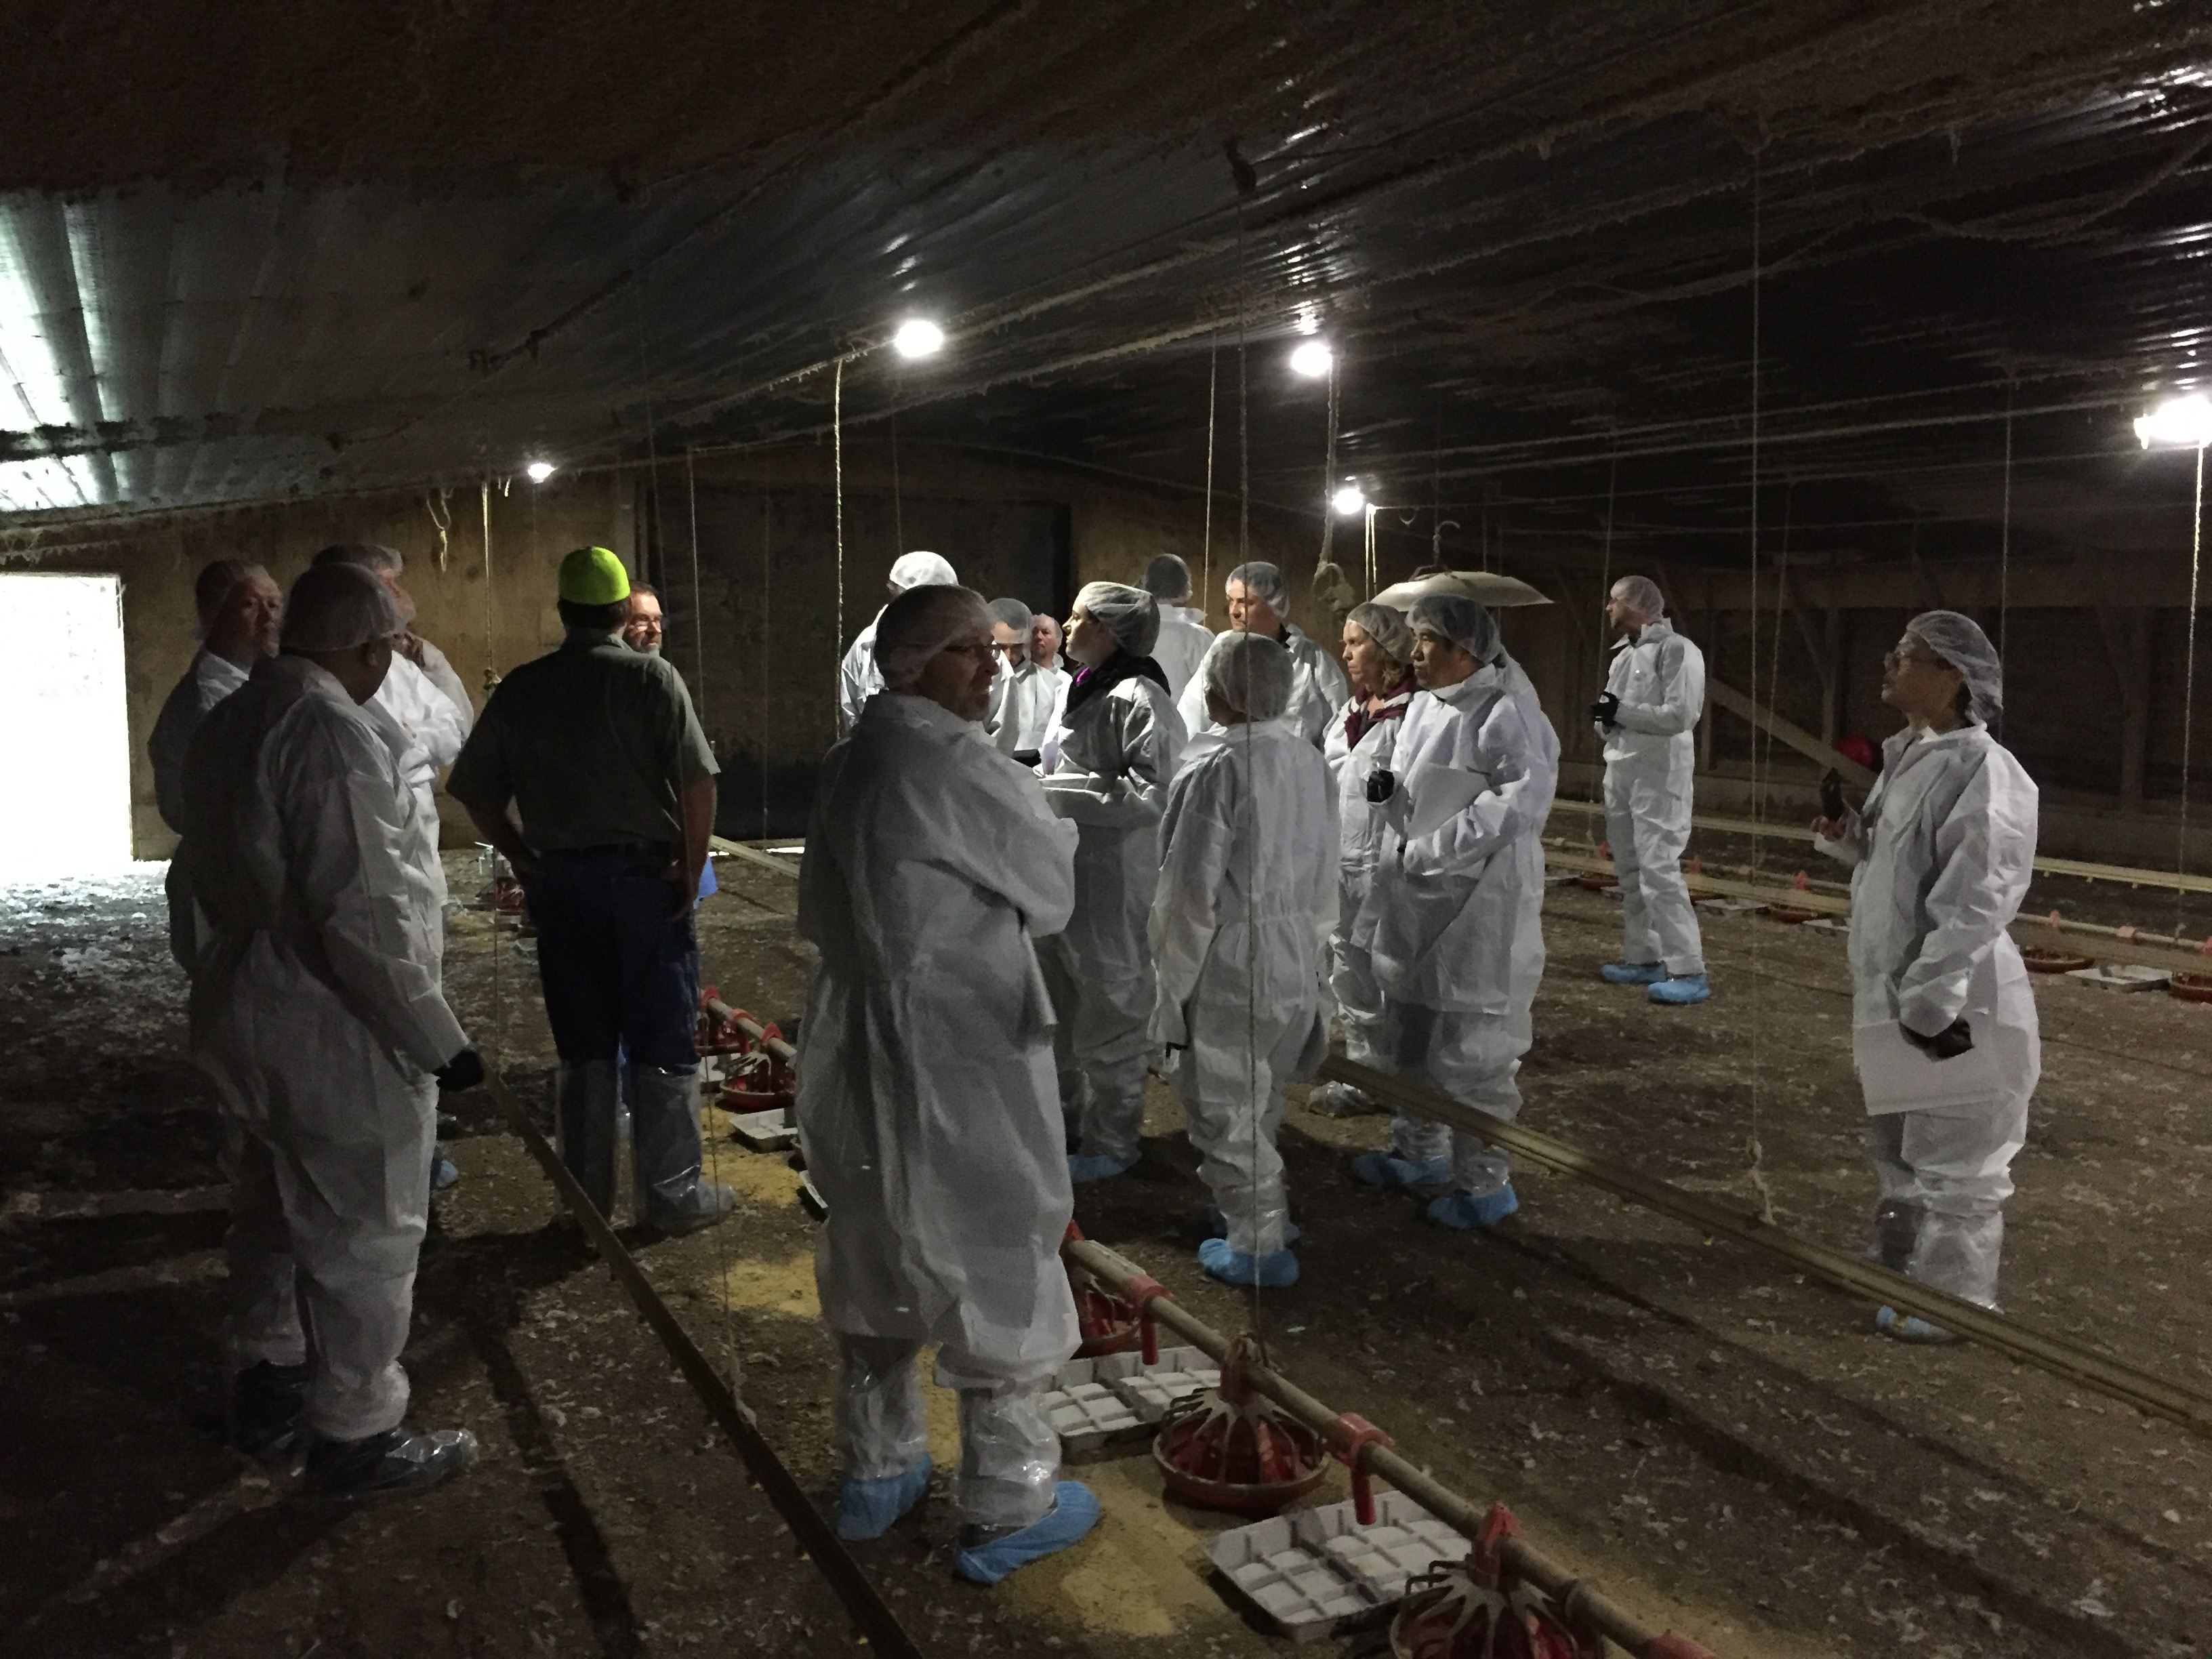
Zwicke and group in animal housing facility

What have we learned?

NAQSAT has proven to be a useful tool for bench-marking the air emissions impacts of current management on confinement-based livestock and poultry operations. In the training sessions, students have been able to complete NAQSAT runs on-site with the producer or producer representative via tablet or smartphone technologies. Further classroom discussion has helped to better understand the questions and answers and how the NAQSAT results can feed into the USDA-NRCS conservation planning process. Several needed enhancements and upgrades to the tool have been identified in order to more closely align the output of the tool to USDA-NRCS conservation planning needs. NAQSAT has also proven to be useful for evaluating the air quality resource concern status of an operation in relation to the CNMP development process.

Future Plans

It is anticipated that the identified needed enhancements and upgrades will be completed as funding for further NAQSAT development becomes available. Additionally, as use of NAQSAT by USDA-NRCS and our conservation planning and CNMP development partners expands, additional training and experience-building opportunities will be needed. The NAQSAT development team has great geographic coverage to assist in these additional opportunities.

Corresponding author, title, and affiliation

Greg Zwicke, Air Quality Engineer – Air Quality and Atmospheric Change Team, USDA-NRCS

Corresponding author email

greg.zwicke@ftc.usda.gov

Other authors

Greg Johnson, Air Quality and Atmospheric Change Team Leader, USDA-NRCS; Jeff Porter, Animal Nutrient and Manure Management Team Leader, USDA-NRCS; Sandy Means, Agricultural Engineer – Animal Nutrient and Manure Management Team, USDA-NRCS

Additional information

naqsat.tamu.edu

https://lpelc.org/naqsat-for-swine-and-poultry

https://lpelc.org/naqsat-for-beef-and-dairy/

Acknowledgements

C.E. Meadows Endowment, Michigan State University

Colorado Livestock Association

Colorado State University

Florida A&M University

Iowa Turkey Federation

Iowa Pork Producers

Iowa Pork Industry Center

Iowa State University

Iowa State University Experiment Station

Kansas State University

Michigan Milk Producers Association

Michigan Pork Producers Association

Michigan State University

Michigan State University Extension

National Pork Board

Nebraska Environmental Trust

Oregon State University

Penn State University

Purdue University

Texas A&M University

University of California, Davis

University of Georgia

University of Georgia Department of Poultry Science

University of Idaho

University of Maryland

University of Maryland Department of Animal and Avian Sciences

University of Minnesota

University of Missouri

University of Nebraska

USDA-ARS

Virginia Tech University

Washington State University

Western United Dairymen

Whatcom County (WA) Conservation District

The authors are solely responsible for the content of these proceedings. The technical information does not necessarily reflect the official position of the sponsoring agencies or institutions represented by planning committee members, and inclusion and distribution herein does not constitute an endorsement of views expressed by the same. Printed materials included herein are not refereed publications. Citations should appear as follows. EXAMPLE: Authors. 2017. Title of presentation. Waste to Worth: Spreading Science and Solutions. Cary, NC. April 18-21, 2017. URL of this page. Accessed on: today’s date.
Planning for Resilience: Using Scenarios to Address Potential Impacts of Climate Change for the Northern Plains Beef System

Proceedings Home W2W Home w2w17 logo

Purpose

Resiliency to weather extremes is a topic that Northern Plains farmers and ranchers are already familiar with, but now climate change is adding new uncertainties that make it difficult to know the best practices for the future. Scenario planning is a method of needs assessment that will allow Extension and beef system stakeholders to come together using the latest climate science to discover robust management options, highlight key uncertainties, prioritize Extension programming needs, and provide an open forum for discussion for this sometimes controversial topic.

Overall objectives:

1. Determine a suite of key future scenarios based on climate science that are plausible, divergent, relevant, and challenging to the beef industry.

2. Determine robust management options that address the key scenario drivers.

3. Develop a plan for Extension programming to address determined educational needs.

What did we do?

A team of researchers, Extension specialists, and educators was formed with members from University of Nebraska and South Dakota State University. They gathered the current research information on historical climate trends, projections in future climate for the region, and anticipated impacts to the beef industry. These were summarized in a series of white papers.

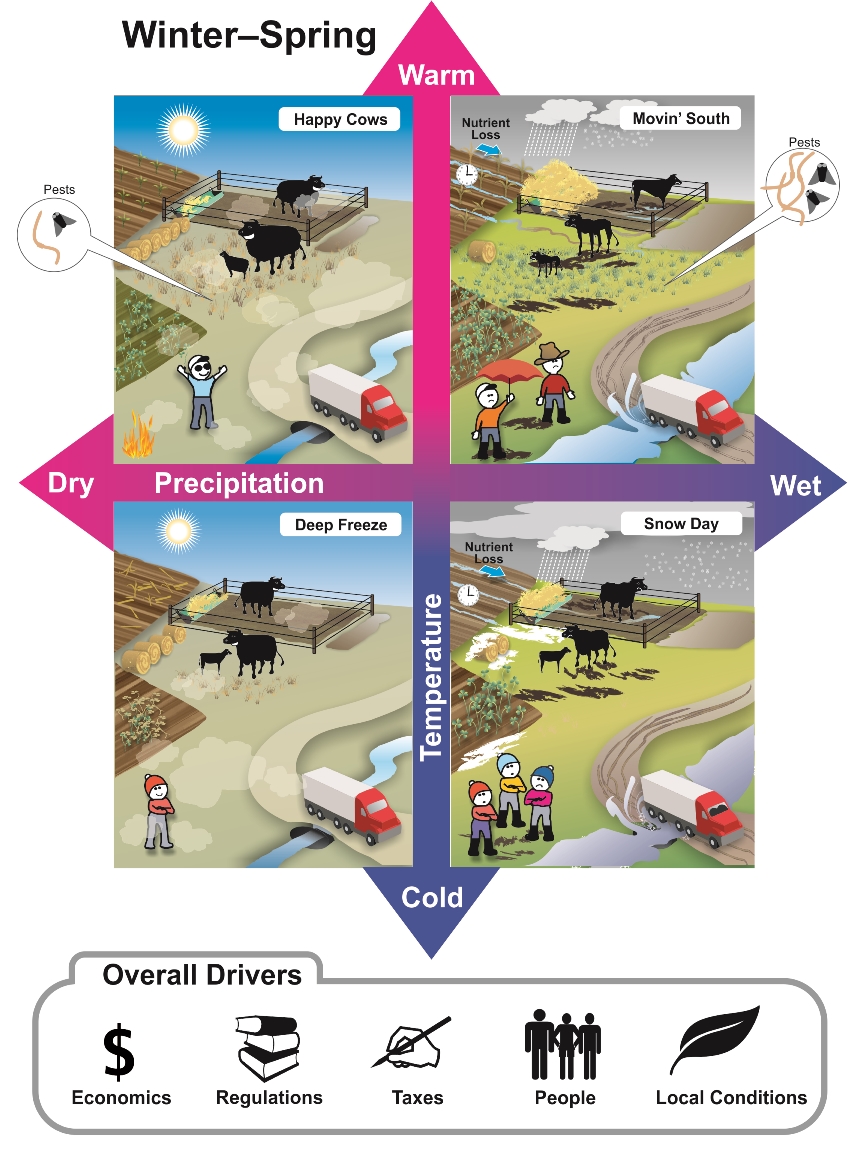
Three locations were selected to host two half day focus groups, representing the major production regions. A diverse group representing the beef industry of each region including feedlot managers, cow calf ranchers, diversified producers, veterinarians, bankers, NRCS personnel, and other allied industries. The first focus group started with a discussion of the participants past experiences with weather impacts. The team then provided short presentations starting with historic climate trends and projection, anticipated impacts, and uncertainties. The participants then combined critical climate drivers as axis in a 2×2 grids, each generating a set of four scenarios. They then listed impacts for each combination. The impacts boundaries were feed production through transporting finished cattle off-farm.

Project personnel then combined the results of all three locations to prioritize the top scenarios, which were turned into a series of graphics and narratives. The participants were then brought together for a second focus group to brainstorm management and technology options that producers were already implementing or might consider implementing. These were then sorted based on their effectiveness across multiple climate scenarios, or robustness. The options where also sorted by the readiness of the known information: Extension materials already available, research data available but few Extension materials, and research needed.

Graphic depicting warm/dry, warm/wet, cold/dry, cold/wet conditions on the farm during winter-spring

Graphic depicting hot/dry, hot/wet, cool/dry, cool/wet conditions on the farm during summer-fall

What have we learned?

The key climate drivers were consistent across all focus groups: temperature and precipitation, ranging from below average to above average. In order to best capture the impacts, the participants separated winter/spring and summer/fall.

This method of using focus groups as our initial interaction with producers on climate change was well received. Most all farmers love to talk about the weather, so discussing historical trends and their experiences with it as well as being upfront with the uncertainties in future projections, while emphasizing the need for proactive planning seemed to resonate.

With so many competing interests for producers’ time, as well as a new programming area, it was critical to have trusted local educators to invite participants. Getting participants to the second round of focus groups was also more difficult, so future efforts should considering hosting a single, full day focus group, or allowing the participants to set the date for the second focus group, providing more motivation to attend.

Future Plans

The scenarios and related management options will be used to develop and enhance Extension programming and resources as well as inform new research efforts. The goal is to provide a suite of robust management options and tools to help producers make better decisions for their operation.

Corresponding author, title, and affiliation

Crystal Powers, Extension Engineer, University of Nebraska – Lincoln

Corresponding author email

cpowers2@unl.edu

Other authors

Rick Stowell, Associate Professor at University of Nebraska – Lincoln

Additional information

Crystal Powers

402-472-0888

155 Chase Hall, East Campus

Lincoln, NE 68583

Acknowledgements

Thank you to the project team:

University of Nebraska – Lincoln: Troy Walz, Daren Redfearn, Tyler Williams, Al Dutcher, Larry Howard, Steve Hu, Matthew Luebbe, Galen Erickson, Tonya Haigh

South Dakota State University: Erin Cortus, Joseph Darrington,

This project was supported by the USDA Northern Plains Regional Climate Hub and Agricultural and Food Research Initiative Competitive Grant No. 2011-67003-30206 from the USDA National Institute of Food and Agriculture.

The authors are solely responsible for the content of these proceedings. The technical information does not necessarily reflect the official position of the sponsoring agencies or institutions represented by planning committee members, and inclusion and distribution herein does not constitute an endorsement of views expressed by the same. Printed materials included herein are not refereed publications. Citations should appear as follows. EXAMPLE: Authors. 2017. Title of presentation. Waste to Worth: Spreading Science and Solutions. Cary, NC. April 18-21, 2017. URL of this page. Accessed on: today’s date.

Livestock Methane Emissions Estimated and Mapped at a County-level Scale for the Contiguous United States


Proceedings Home W2W Home w2w17 logo

Purpose         

This analysis of methane emissions used a “bottom-up” approach based on animal inventories, feed dry matter intake, and emission factors to estimate county-level enteric (cattle) and manure (cattle, swine, and poultry) methane emissions for the contiguous United States.

What did we do? 

Methane emissions from enteric and manure sources were estimated on a county-level and placed on a map for the lower 48 states of the US. Enteric emissions were estimated as the product of animal population, feed dry matter intake (DMI), and emissions per unit of DMI. Manure emission estimates were calculated using published US EPA protocols and factors. National Agricultural Statistic Services (NASS) data was utilized to provide animal populations. Cattle values were estimated for every county in the 48 contiguous states of the United States. Swine and poultry estimates were conducted on a county basis for states with the highest populations of each species and on a state-level for less populated states. Estimates were placed on county-level maps to help visual identification of methane emission ‘hot spots’. Estimates from this project were compared with those published by the EPA, and to the European Environmental Agency’s Emission Database for Global Atmospheric Research (EDGAR).

What have we learned? 

Overall, the bottom-up approach used in this analysis yielded total livestock methane emissions (8,888 Gg/yr) that are comparable to current USEPA estimates (9,117 Gg/yr) and to estimates from the global gridded
EDGAR inventory (8,657 Gg/yr), used previously in a number of top-down studies. However, the
spatial distribution of emissions developed in this analysis differed significantly from that of
EDGAR.

Methane emissions from manure sources vary widely and research on this subject is needed. US EPA maximum methane generation potential estimation values are based on research published from 1976 to 1984, and may not accurately reflect modern rations and management standards. While some current research provides methane emission data, a literature review was unable to provide emission generation estimators that could replace EPA values across species, animal categories within species, and variations in manure handling practices.

Future Plans    

This work provides tabular data as well as a visual distribution map of methane emission estimates from enteric (cattle) and manure (cattle, swine, poultry) sources. Future improvement of products from this project is possible with improved manure methane emission data and refinements of factors used within the calculations of the project.

Corresponding author, title, and affiliation        

Robert Meinen, Senior Extension Associate, Penn State University Department of Animal Science

Corresponding author email    

rjm134@psu.edu

Other authors   

Alexander Hristov (Principal Investigator), Professor of Dairy Nutrition, Penn State University Department of Animal Science Michael Harper, Graduate Assistant, Penn State University Department of Animal Science Richard Day, Associate Professor of Soil

Additional information                

None.

Acknowledgements       

Funding for this project was provided by ExxonMobil Research and Engineering.

The authors are solely responsible for the content of these proceedings. The technical information does not necessarily reflect the official position of the sponsoring agencies or institutions represented by planning committee members, and inclusion and distribution herein does not constitute an endorsement of views expressed by the same. Printed materials included herein are not refereed publications. Citations should appear as follows. EXAMPLE: Authors. 2017. Title of presentation. Waste to Worth: Spreading Science and Solutions. Cary, NC. April 18-21, 2017. URL of this page. Accessed on: today’s date.
Evaluation of a Model to Predict Enteric Methane Production from Feedlot Cattle


Proceedings Home W2W Home w2w17 logo

Purpose

Continual refinement of methods estimating enteric methane production in beef finishing cattle provides a more accurate assessment of the environmental impact of the beef industry.  The USDA-OCE publication “Quantifying Greenhouse Gas Fluxes in Agriculture and Forestry: Methods for Entity-Scale Inventory” identified conservation practices and management strategies for reducing greenhouse gas emissions while improving agriculture production (Eve et al., 2014).  In Chapter 5 a new method to estimate effects of nutrition and management on enteric methane production of feedlot cattle is provided.  The system recommends using adjustment factors to correct the IPCC (2006) tier 2 Methane Conversion Factor (Ym) of 3.0% of gross energy intake to an adjusted Ym.  Adjustment factors are used for dietary grain and fat concentrations, grain type and processing method, and ionophore use.  These adjustment factors let beef producers more accurately determine the enteric methane production associated with their individual finishing operation.

What Did We Do?

To evaluate this new model, we developed a database consisting of 36 refereed publications, with 75 treatment means.  The focus of this database was to identify published research relating to high concentration beef finishing that provided methane as a percent of gross energy, or provided enough information for calculation.  Treatments containing greater than 20% forage were excluded, as they are not representative of a high concentration finishing diet.  Additionally, treatment diets utilizing a methane mitigation agent were excluded from the database. 

What Have We Learned?

This database encompassed 75 treatment means containing a wide range in weight, intake and protein of the diets.  Body weight, dry matter intake, and dietary crude protein concentrations for the database ranged from 150 to 723 kg, 4.78 to 12.9 kg, and 9.4 to 23%, respectively.  Predicted Ym had a significant but relatively low correlation (r = 0.31, P = 0.0077) to actual Ym.  However, when one experiment (4 treatments) with very high methane values (likely a result of manure CH4) was removed, the correlation improved (r = 0.62, P < 0.0001), resulting in the following relationship:  Predicted Ym = 2.23 + (0.41 * actual YM) (r2 = 0.39, RMSE = 0.58).  Predicted g of CHproduced daily were highly correlated to actual g of CH4/d (r2 = 0.63, RMSE = 22.61), and predicted CH4 produced, as a percentage of digestible energy intake, was highly correlated to actual CHper kcal of digestible energy intake, DEI (r2 = 0.46, RMSE = 0.61).  Under the conditions of this investigation, the new model moderately predicted enteric methane production from feedlot cattle fed high-concentrate diets.

Future Plans

The database will be expanded as refereed publications suitable to the selection criteria are identified.  Trials with greater forage inclusion will be evaluated to test the robustness of the model and evaluate the correlation to IPPC (2006) estimations. 

Corresponding author (name, title, affiliation) 

Tracy D. Jennings, Associate Research Scientist, Texas A&M AgriLife Research

Corresponding author email address  

Tracy.Jennings@ag.tamu.edu

Other Authors 

Kristen Johnson, Professor, Washington State University; Luis Tedeschi, Professor, Texas A&M University; Michael Galyean, Provost, Texas Tech University, Richard Todd, Soil Scientist, USDA-ARS; N. Andy Cole, Retired Animal Scientist, USDA-ARS

The authors are solely responsible for the content of these proceedings. The technical information does not necessarily reflect the official position of the sponsoring agencies or institutions represented by planning committee members, and inclusion and distribution herein does not constitute an endorsement of views expressed by the same. Printed materials included herein are not refereed publications. Citations should appear as follows. EXAMPLE: Authors. 2017. Title of presentation. Waste to Worth: Spreading Science and Solutions. Cary, NC. April 18-21, 2017. URL of this page. Accessed on: today’s date.

Methods for Regulating Dry Matter Intake in Grazing Horses


Proceedings Home W2W Home w2w17 logo

Purpose 

Pasture dry matter intake of many horses (e.g., mature idle horses) exceeds that necessary to provide daily energy requirements creating an inefficiency. One strategy for regulating pasture intake is to restrict the herbage mass (HM) available for grazing by “pre-grazing” with horses having higher nutrient requirements (e.g., work, growth, lactation), or an entirely different species (e.g., cattle, sheep or goats) using a “leader-follower” rotational grazing system. Another strategy for regulating pasture intake is to restrict the time allowed for grazing. Both methods have the potential to improve the efficiency of pasture use by preventing over-consumption.

What did we do? 

Two experiments were conducted to evaluate the effectiveness of regulating pasture intake by: 1) restricting HM available for grazing, or 2) restricting time allowed for grazing. In the first experiment six mature geldings were assigned to a HIGH (n=3) or LOW (n=3) density HM pasture (0.37 ha) for a 7 d. Treatments were reversed and carried out for an additional 7 d. The LOW pasture HM was achieved by mowing to a predetermined sward height that yielded a target HM. Mowing was used to achieve the target HM, instead of “leader-follower” rotational grazing, in order to accurately obtain the desired target HM. Herbage mass of each grazing cell was estimated using a weighted falling plate meter according to Vibart et al. (1). Body weight (BW) was measured on d-0 and 7 and changes in BW were used to reflect differences in DM intake between treatments. Mean HM available at the start of grazing was 876 and 2180 ± 76 kg DM/ha, for LOW and HIGH, respectively (Treatment P < .001), and corresponds to approximately 11 and 27 kg DM•d^-1•hd^-1 available for grazing, for LOW and HIGH, respectively, assuming a grazing efficiency of 70%. Herbage mass density decreased from d-1 to 7 (Treatment x Day; P < 0.001) by 148 and 771 ± 105 kg DM/ha for LOW and HIGH, respectively. The magnitude of BW change tended (P = .06) to be greater for LOW (-11.5 ± 3.9 kg) than HIGH (3.3 ± 3.9). The tendency for BW loss in LOW was likely a function of decreased intake leading to decreased gut fill, as opposed to a body tissue loss, given the estimated initial HM for LOW was more than adequate to meet energy requirements of all 3 horses over the 7-d period (i.e., approximately 11 kg DM•d^-1•hd^-1) (3). The greater HM reduction in HIGH, as compared to LOW, suggests horses in HIGH consumed more forage than required to meet maintenance energy requirements (e.g., potentially 14 kg DM/d), and! represen ts inefficient use of pasture.

A second experiment using eight mature geldings maintained in a single pasture (1.5 ha) and containing approximately 3,000 kg DM/ha was conducted to determine the effect of restricting time available for grazing on pasture DM intake. Horses were randomly assigned to either continuous grazing (CG; n=4) or restricted grazing (RG; n=4) for 14 d. Horses in the RG group were muzzled to prevent grazing from 1600 to 800 the following day, but otherwise allowed to graze freely. Body weight was measured on d-0, 7 and 14. Differences in body weight between treatments were used as an indicator of differences in pasture DM intake. Body weight was not different between treatments on d-0, however BW increased from d-0 to 7 for CG (22 ± 6.6 kg; P < .01), and decreased over the same period for RG (-19 ± 6.6 kg; P < .01). The gain in BW along with the initial 3,000 kg DM/ha available for grazing (approximately 28 kg DM•d-1•hd-1) suggests CG consumed DM well above that required for meeting maintenance energy requirements; whereas the loss of BW in RG suggests reduced DM intake as compared to CG. A longer term study is necessary to determine if BW change observed for RG stabilizes or continues on a downward trajectory, indicating restriction was too severe.

1. Vibart RE, White-Bennet SL, Green JT, Washburn SP. Visual assessment versus compressed sward heights as predictors of forage biomass in cool-season pastures. J Dairy Sci. 2004;87:36.

2. Walker GA. Common Statistical Methods for Clinical Research. Vol. 2nd. Cary, NC: SAS Institute, Inc; 2002.

3. NRC. Nutrient Requirements of Horses: Sixth Revised Edition. Washington, D.C.: The National Academies Press; 2007. 360 p.

What have we learned?        

The results of both experiments suggest that: 1) Mature idle horses, continuously grazing abundant pasture, consume more DM than is necessary to meet daily energy requirements representing inefficiency, 2) restriction of either herbage mass available for grazing, or time available for grazing can be developed as tools to regulate pasture DM intake of grazing horses, and ultimately enhance efficiency of pasture use.

Future Plans    

Future plans include designing experiments to refine both restriction of herbage mass available for grazing, and time available for grazing as practical methods for improving the efficiency of feeding horses on pasture.

Corresponding author, title, and affiliation        

Paul D. Siciliano, Professor, North Carolina State University

Corresponding author email  

Paul_Siciliano@ncsu.edu

Other authors   

Morghan A. Bowman, Graduate Research Assistant, North Carolina State University

Additional information              

Glunk, E.C., Pratt-Phillips, SE and Siciliano, P.D. 2013. Effect of restricted pasture access on pasture dry matter intake rate, dietary energy intake and fecal pH in horses. J. of Equine Vet. Sci. 33(6):421-426.

Dowler, L.E., Siciliano, P.D., Pratt-Phillips, S.E., and Poore, M. 2012. Determination of pasture dry matter intake rates in different seasons and their application in grazing management. J. Equine Vet. Sci. 32(2):85-92.

Siciliano, P.D. and S. Schmitt. 2012. Effect of restricted grazing on hindgut pH and fluid balance. J. Equine Vet. Sci. 32(9):558-561.

Acknowledgements       

This project was supported by the North Carolina Agricultural Research Service.

The authors are solely responsible for the content of these proceedings. The technical information does not necessarily reflect the official position of the sponsoring agencies or institutions represented by planning committee members, and inclusion and distribution herein does not constitute an endorsement of views expressed by the same. Printed materials included herein are not refereed publications. Citations should appear as follows. EXAMPLE: Authors. 2017. Title of presentation. Waste to Worth: Spreading Science and Solutions. Cary, NC. April 18-21, 2017. URL of this page. Accessed on: today’s date.
Nutrient Cycling in Horse Pastures


Proceedings Home W2W Home w2w17 logo

Purpose 

This presentation will review the existing multi-species literature on nutrient cycling and how it is affected by the horse’s diet and rotational grazing.

Grazed pastures, particularly rotationally grazed pastures, recycle nutrients faster than ungrazed pastures. Nutrients on pasture land enter through animal waste, and waste feed or fertilizer; they leave through removal of forage, leaching/runoff, or animal product/waste removal. Taking away the animal component removes about half of the inputs needed to recycle the nutrients. Dietary nitrogen (N), phosphorus (P) and potassium (K) are required for basic maintenance of horses; however, not all of what is consumed is used by the animal, therefore the dietary concentrations of these nutrients will impact the nutrient cycling. Digestibility of N, P and K in horses is approximately 80, 25 and 75 %, respectively. What does not get digested will end up excreted back into the soil.

What did we do? 

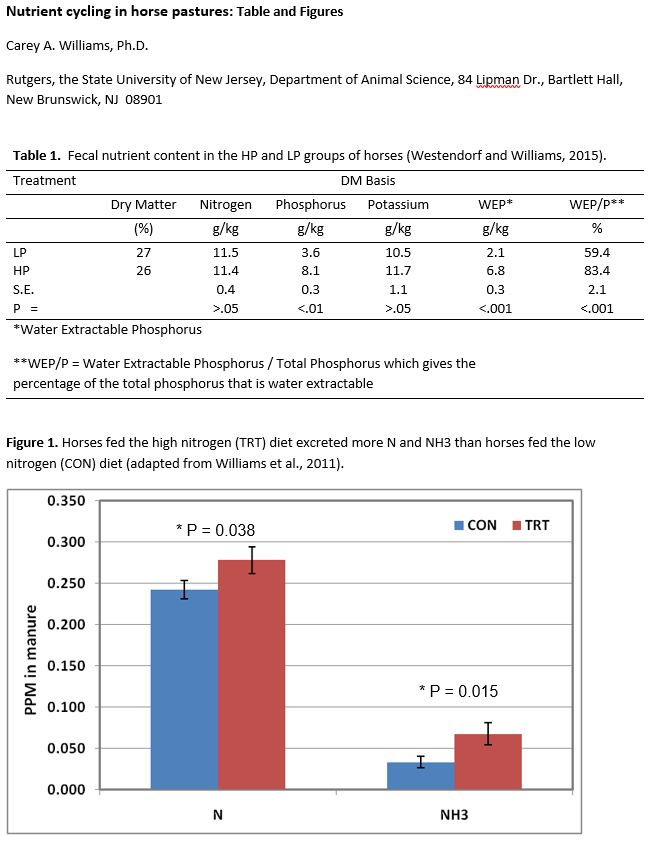
For example, in one study eight Standardbred mares were divided into two groups and received diets of grass hay and grain. The high P (HP) group received 142 g/d of NaH2PO4, formulated to provide 4.5-times the dietary P requirement, or 65 g phosphorus/d. The low P (LP) group received 28 g of phosphorus/d in the basal diet. Data showed that horses receiving the HP diet excreted higher P and water extractable P in the manure than those fed the LP diet (Table 1; Westendorf and Williams, 2015). The same goes for N, where one study used a treatment group that was supplemented with 700 g/d of soybean meal top dressed on 500 g of sweet feed per day (TRT; 1042 g protein/d DM total), while the control group received the sweet feed meals without the soybean meal (CON; 703 g protein/d total). Both groups were also fed 8 kg/d of a grass hay mix (562 g protein /d DM), water and salt ad libitum. Horses fed the TRT diet excreted more N and NH3 than horses fed the CON diet (Figure 1; Williams et al., 2011).

Nutrient Cycling in horse pastures: Tables and Figures

What have we learned? 

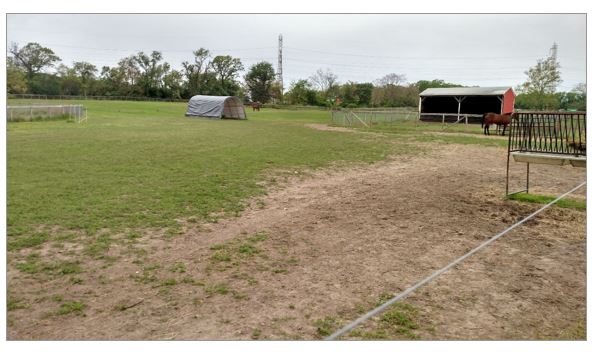
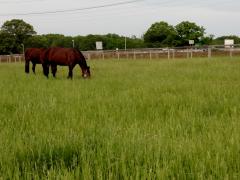
More intensive grazing also creates an increased rate of nutrient cycling due to the added animal inputs on the land. Even though no horse related studies have been performed on this topic studies in cattle have found that plant-available N levels doubled when cattle were rotationally grazed with five grazings per season instead of three (Baron et al., 2002). Kenny (2016) looked at horses grazed under either a continuous or rotational grazing system (see Pictures 1 and 2, Left to Right, respectively) and found no differences in system after one year of grazing, however, the author concludes that more time on the system could have generated differences.

Other factors that affect the rate of nutrient cycling include amount of legumes in the pasture, distribution of manure on pastures (i.e. relation to water, shelters and fencing), and use or rates of fertilizer.


Horse in pastureRotational grazing horse

Future Plans    

More equine specific studies need to be performed looking at how grazing systems and equine diets affect nutrient cycling and how horse farm owners can utilize this to best manage their farm for optimal nutrient utilization.

Corresponding author, title, and affiliation        

Carey A. Williams, Equine Extension Specialist, Rutgers, the State University of New Jersey, Department of Animal Science

Corresponding author email    

carey.williams@rutgers.edu

Additional information 

References:

Baron, V. S., E. Mapfumo, A. C. Dick, M. A. Naeth, E. K. Okine, and D. S. Chanasyk. 2002. Grazing intensity impacts on pasture carbon and nitrogen flow. J. Range Manage. 55:525-541.

Kenny, L. B. 2016. The Effects of Rotational and Continuous Grazing on Horses, Pasture Condition, and Soil Properties. Master thesis, Rutgers, the State University of New Jersey, New Brunswick, NJ.

Westendorf, M. L., and C. A. Williams. 2015. Effects of excess dietary phosphorus on fecal phosphorus excretion and water extractable phosphorus in horses. J. Equine Vet. Sci. 35:495-498. doi:10.1016/j.jevs.2015.01.020

Williams, C. A., C. Urban, and M. L. Westendorf. 2011. Dietary protein affects nitrogen and ammonia excretion in horses. J. Equine Vet. Sci. 31:305-306.


The authors are solely responsible for the content of these proceedings. The technical information does not necessarily reflect the official position of the sponsoring agencies or institutions represented by planning committee members, and inclusion and distribution herein does not constitute an endorsement of views expressed by the same. Printed materials included herein are not refereed publications. Citations should appear as follows. EXAMPLE: Authors. 2017. Title of presentation. Waste to Worth: Spreading Science and Solutions. Cary, NC. April 18-21, 2017. URL of this page. Accessed on: today’s date.
A Quantitative Assessment of Beneficial Management Practices to Reduce Carbon and Reactive Nitrogen Footprints of Dairy Farms in the Great Lakes Region

w2w17 LogoProceedings Home | W2W Home 

Purpose 

Assessing and improving the sustainability of dairy production is essential to secure future food production. Implementation of Beneficial Management Practices (BMPs) can reduce carbon and reactive nitrogen footprints of dairy farms. BMPs can and have been developed for different farm components, including feed, manure management and field cultivation practices. It is practically and economically infeasible to empirically test all combinations of BMPs at a whole farm scale. We therefore use whole-farm process-based models to assess the impact of several Beneficial Management Practices (BMPs) on carbon and reactive nitrogen footprints of dairy farms in the Great Lakes region. Specifically the aim of this study is to evaluate the influence of Beneficial Management Practices (BMPs) on carbon, reactive nitrogen and phosphorus footprints of dairy farms in the Great Lakes region.

What did we do? 

1. Baseline farms

We developed two baseline model farms, a small 150 cow herd farm and a large 1500 cow herd farm, that are thought to be representative for current dairy farming practices in the Great Lakes region, particularly Wisconsin and New York State (Table 1). The two baseline dairy farms were developed based on individual team members’ expertise and a consultation with external experts (Dane County Conservationists, Madison, Wisconsin). For the 1500 cow farm, the baseline scenario was partly based on a previously-studied commercial dairy farm in NY state. Since this commercial dairy farm already employs some BMPs (e.g. anaerobic digestion as BMP in manure management), the farm was ‘downgraded’ to derive the baseline.

Table 1. Description of the baseline farms

2. Beneficial Management Practices

Farm-specific BMPs were developed for three farm components, i.e. “Feed”, “Manure Management & Storage” and “Field management”. These BMPS were developed based on expert judgement and are expected or known to reduce whole-farm GWPs.

To ensure a meaningful integration of BMPs and a consistent comparison of whole-farm BMPs to the baseline and to each other, we used the following set of rules (per farm type): i) Total cultivated area was fixed (areas of individual crops can vary per scenario); ii) Herd size was fixed; iii) Milk production was allowed to float, however, only if the production increased (no decreases in milk production); iv) Purchases of crops and protein mixes were minimized as far as possible.

Table 2. Individual BMPs for the 1500 and 150 cow farm

3. Process model simulation

The Integrated Farm System Model (IFSM4.3) was used to simulate the two baseline farms (i.e. 1500 cow farm in NY and 150 cow farm in WI) and all the individual BMPs. IFSM was used as a baseline model. The other process-based models, that is DNDC, APEX and CNCPS, were used to check IFSM predictions.

4.Whole-farm mitigation strategy

The individual BMPs were analyzed in terms of potential reduction in carbon and reactive nitrogen footprint. The best performing individual BMPs were combined into a whole-farm mitigation strategy and this whole-farm mitigation strategy was subsequently modeled in IFSM.

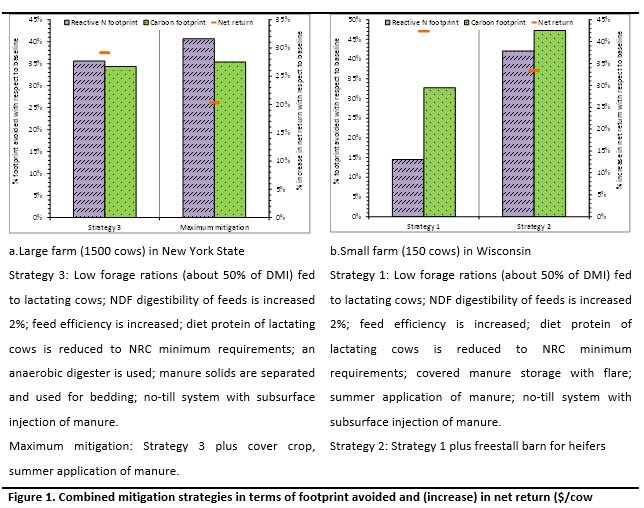
Figure 1. Combined mitigation strategies in terms of footprint avoided and (increase) in net return ($/cow

What have we learned? 

A comparison of model simulations of feed BMPs to the baseline shows that an integrated feed BMP (low forage, corn silage:alfalfa 3:1, ~2% NDF digestibility, reduced protein 14%, added fat, increased feed efficiency) can potentially reduce carbon and reactive nitrogen footprints with ~20% and ~24%, respectively, while remaining cost effective (18% increase in net return in $/cow), for both farm sizes.

For the small farm, replacing the bedded-pack barn with a free stall barn for the heifers, substantially reduces the carbon and the reactive nitrogen footprint with 12% and 11%, respectively. The manure management BMP ‘sealed with flare’ provides the largest potential reduction in carbon footprint for both farms (11% – 20%), primarily through a mitigation of CH4 emissions from manure storage.

Field management BMPs only provide a minimal reduction in carbon footprint (~3%), however, the field BMP ‘no-till with injection’ substantially reduces the reactive N footprint (~16%) for both farm sizes. This reduction is primarily achieved by a reduction in ammonia volatilization.

Based on the results for the individual BMPs, two combined whole-farm mitigation strategies were developed per farm and simulated in IFSM (Figure 1). For both the large farm and the small farm, the integrated whole-farm BMPs show an overall potential to reduce carbon and reactive nitrogen footprints with 33% to 37% and 15% to 42% respectively, simultaneously increasing milk production and the net return per cow with 10% to 12% and 20% to 42%, respectively.

This analysis suggests that BMPs can be applied to reduce greenhouse gas emissions and reactive nitrogen losses without sacrificing productivity or profit to the farmer.

Future Plans    

Future research plans include a further comparison and analysis of IFSM predictions with predictions from other process models, including CNCPS, APEX, and ManureDNDC. In addition, we will assess the impact of climate change on the reactive nitrogen and carbon footprint of the baseline farms and the developed whole-farm mitigation strategies.

Corresponding author, title, and affiliation         

Karin Veltman, PhD, University of Michigan, Ann Arbor

Corresponding author email    

veltmank@umich.edu

Other authors   

Alan Rotz, Joyce Cooper, Larry Chase, Richard Gaillard, Pete Ingraham, R. César Izaurralde, Curtis D. Jones, William Salas, Nick Stoddart, Greg Thoma, Peter Vadas, Olivier Jolliet

Additional information                

Veltman et al. (2017) Comparison of process-based models to quantify nutrient flows and greenhouse gas emissions associated with milk production. Agricultural Ecosystems and Environment, 237, 31–44

DairyCAP project, www.sustainabledairy.org, aims to reduce the life cycle environmental impact of dairy production systems in the US.

Acknowledgements       

This material is based upon work that is supported by the National Institute of Food and Agriculture, U.S. Department of Agriculture, under award number 2013-68002-20525. Any opinions, findings, conclusions, or recommendations expressed in this publication are those of the author(s) and do not necessarily reflect the view of the U.S. Department of Agriculture.

The authors are solely responsible for the content of these proceedings. The technical information does not necessarily reflect the official position of the sponsoring agencies or institutions represented by planning committee members, and inclusion and distribution herein does not constitute an endorsement of views expressed by the same. Printed materials included herein are not refereed publications. Citations should appear as follows. EXAMPLE: Authors. 2017. Title of presentation. Waste to Worth: Spreading Science and Solutions. Cary, NC. April 18-21, 2017. URL of this page. Accessed on: today’s date.
Intake and Digestibility of Nutrients, Manure Production, and Nitrogen Excretion as Affected by Nonfiber Carbohydrate Sources and Rumen Degradable Protein Levels in the Diet of Dairy Cows


Proceedings Home W2W Home w2w17 logo

Purpose           

This study was to determine the effects of nonfiber carbohydrate (NFC) sources and rumen degradable protein (RDP) levels in diet on apparent total-tract nutrient digestibility, manure production and nitrogen (N) excretion in dairy cows.

What did we do?         

Eighteen mid-lactation multiparous Holstein cows were used in this split-plot study. Cows were randomly assigned to 9 or 11% RDP (16.5% crude protein (CP) for all diets, dry matter (DM) basis) as main plots and cows within each RDP level were further assigned to 3 NFC treatments, including (DM basis): 10% dextrose (D), 5% dextrose, 5% purified starch (DS), and 10% purified starch (S). Each period lasted 4 weeks and samples were collected during the fourth week.

What have we learned? 

There was no NFC x RDP interaction for response variables. Intake (kg/d) responded linearly for DM (24.3, 24.2, and 22.6), organic matter (22.7, 22.6, and 21.1), CP (4.0, 3.9, and 3.7), and neutral detergent fiber (7.0, 6.9, and 6.5) for D, DS and S, respectively (all P < 0.01). Same pattern was observed for the amount of nutrient digested, but apparent total-tract digestibility (%) was unaffected by dietary treatments, averaging 70.4, 71.8, 72.2, and 41.9 for DM, organic matter, CP and neutral detergent fiber, respectively. Fecal DM excretion (kg/d) was 7.2, 7.2, and 6.7 for D, DS, and S, respectively (P = 0.02), but urine volume (29.3 L/d) and urine N (254 g/d) were not affected. However, fecal N (180, 179, and 173 g/d) decreased, and N use efficiency (100x Milk N/N intake; 26.9, 27.4, and 29.3 %) increased linearly as starch in diet increased. There was no dietary effect on milk protein production (173 g/d). In this study, the substitution of starch for dextrose in the diet reduced DM and nutrient intake, did not alter digestibility, but reduced fecal DM and N excretions.

Future Plans   

Future studies will further look into the effect of carbohydrate and nitrogen in diet on nutrient use efficiency, manure excretion, as well as methane emission in dairy cows.

Corresponding author, title, and affiliation      

Michel Wattiaux, Professor, Department of Dairy Science, University of Wisconsin-Madison

Corresponding author email  

wattiaux@wisc.edu

Other authors  

Fei Sun, PhD candidate, Department of Dairy Science, University of Wisconsin-Madison -Matias Aguerre, Assistant Professor, Department of Animal and Veterinary Sciences, Clemson University

Additional information               

Fei Sun is the presenting author of this presentation and can be contacted for questions regarding this study via fei.sun@wisc.edu

Acknowledgements      

This study was funded by the Dairy Coordinated Agricultural Project

Transferring Knowledge of Dairy Sustainability Issues Through a Multi-layered Interactive “Virtual Farm” Website

Proceedings Home W2W Home w2w17 logo

Purpose

The goal of the Sustainable Dairy “Virtual Farm” website is to disseminate research-based information to diverse audiences from one platform. This is done with layers of information starting with the mSustainable dairy logoost basic then drilling down to peer-reviewed publications, data from life-cycle assessment studies and models related to the topics. The Virtual Farm focuses on decision makers and stakeholders including consumers, producers, policymakers, scientists and students who are interested in milk production on modern dairy farms. The top entry level of the site navigates through agricultural topics of interest to the general public. Producers can navigate to a middle level to learn about practices and how they might help them continue to produce milk for consumers responsibly in a changing climate while maintaining profitability. Featured beneficial (best) management practices (BMPs) reflect options related to dairy sustainability, climate change, greenhouse gas emissions, and milk production. Researchers can navigate directly to deeper levels to publications, tools, models, and scientific data. The website is designed to encourage users to dig deeper and discover more detailed information as their interest develops related to sustainable dairies and the environment.

What did we do?

As part of a USDA Dairy Coordinated Agricultural Project addressing climate change issues in the Great Lakes region, this online platform was developed to house various products of the transdisciplinary project in an accessible learning site. The Virtual Farm provides information about issues surrounding milk production, sustainability, and farm-related greenhouse gases. The web interface features a user-friendly, visually-appealing interactive “virtual farm” that explains these issues starting at a less-technical level, while also leading to much deeper research into each area. The idea behind this was to engage a general audience, then encourage them to dig deeper into the website for more technical information via Extension offerings.

The main landing page shows two sizes of dairy farms: 150 and 1,500-cows. The primary concept was to replace an all-day tour of multiple real dairy farms by combining their features into one ‘virtual farm’. For example, the virtual farm can describe and demonstrate the impact of various manure processing technologies. Users can explore the layout image, hover over labeled features for a brief description, and click to learn more about five main categories: crops and soils, manure management, milk production, herd management, and feed management. Each category page contains a narrative overview with illustrations and links to more detailed information.

What have we learned?

The primary benefit is that participants can learn about different practices, at their level of interest, all in one place. The virtual farm incorporates a broad theme of sustainability targeted at farming operations in the northeastern Great Lakes region of the USA.

The project has included regional differences in dairy farming practices and some important reasons for this such as environmental concerns (focus on N and/or P management in different watersheds) and long-term climate projections. Dairy industry supporters find value in having a one-stop repository of information on overall sustainability topics rather than having to visit various organizations’ sites.

Future Plans

We plan to continue to develop the website by adding relevant information, keeping information up to date, developing the platform for related topic areas and adding curriculums for school students.

Corresponding author, title, and affiliation

Daniel Hofstetter, Extension-Research Assistant, Penn State University (PSU)

Corresponding author email

dwh5212@psu.edu

Other authors

Eileen Fabian-Wheeler, Professor, PSU; Rebecca Larson, Assistant Professor, University of Wisconsin (UW); Horacio Aguirre-Villegas, Assistant Scientist, UW; Carolyn Betz, Project Manager, UW; Matt Ruark, Associate Professor, UW

Additional information

Visit the following link for more information about the Sustainable Dairy CAP Project:

http://www.sustainabledairy.org

Acknowledgements

This material is based upon work that is supported by the National Institute of Food and Agriculture, U.S. Department of Agriculture, under award number 2013-68002-20525. Any opinions, findings, conclusions or recommendations expressed in this publication are those of the author(s) and do not necessarily reflect the view of the U.S. Department of Agriculture.

The authors are solely responsible for the content of these proceedings. The technical information does not necessarily reflect the official position of the sponsoring agencies or institutions represented by planning committee members, and inclusion and distribution herein does not constitute an endorsement of views expressed by the same. Printed materials included herein are not refereed publications. Citations should appear as follows. EXAMPLE: Authors. 2017. Title of presentation. Waste to Worth: Spreading Science and Solutions. Cary, NC. April 18-21, 2017. URL of this page. Accessed on: today’s date.

Methane Mitigation Strategies for Dairy Herds


Proceedings Home | W2W Home w2w17 logo

Purpose 

The U.S. dairy industry has committed to lowering the carbon footprint of milk production by 25% by 2020. A key factor in meeting this goal is reducing enteric greenhouse gas (GHG) emissions which represent about 51% of the carbon footprint of a gallon of milk. Methane (CH4) is the primary GHG emitted by dairy cows. Total methane emissions represented 10.6% of the total U.S. GHG emissions in 2014. Enteric CH4 emissions were 22.5% of the total methane emissions. Methane emissions from dairy cattle were 5.7% of total U.S. methane emissions or 0.6% of all U.S. GHG emissions. The purpose of this project was to examine nutrition and management options to lower methane emissions from dairy cattle.

What did we do?

This project utilized a number of approaches. One was to develop a base ration using the Cornell Net Carbohydrate and Protein System (CNCPS) model to evaluate the impact of level of dry matter intake and milk production on methane emissions. A second approach was to compile a database of commercial herd rations from 199 dairy farms. This database was used to examine relationships between the feeding program and CH4 emissions. A third component was to utilize published review papers to estimate potential on-farm CH4 reductions based on research data.

What have we learned? 

A base ration developed in the CNCPS model was evaluated at milk production levels ranging from 40 to 120 pounds of milk. As milk production increased, CH4 emissions increased from 373 to 509 grams/cow/day. This is primarily due to increasing levels of dry matter intake as milk production increases. However, the CH4 emissions per pound of milk decreased from 9.32 to 4.24 g as milk production increased. The 199 commercial herd database had an average input milk of 83.7 pounds per day with a range from 50 to 128 pounds. Daily dry matter intake (DMI) averaged 51.4 pounds with a range of 35.2 to 69.8. Simple correlations were run between CH4 emissions and ration components. Dry matter intake had a positive (0.795) correlation with CH4 emissions (g/day). However, the correlation between DMI and CH4/pound of milk was -0.65. These results agree with published research on the relationship of DMI and CH4 emissions. Starch intake also had a positive correlation (0.328) while percent ration starch was negatively correlated (-0.27) with CH4 emissions. There was also a positive correlation (0.79) between the pounds of NDF intake and CH4 emissions.

A review paper indicated that the maximum potential reduction in CH4 emissions by altering rations was 15% (Knapp et. al., 2014). Projected reductions from genetic selection, rumen modifiers and other herd management practices were 18, 5 and 18% in this same paper. The reduction by combining all approaches was estimated to be 30%. A second review paper listed mitigation strategies as low, medium or high (Hristov et. al. 2013). Potential reductions for the low group was <10% while the medium group was 10-30%. The high group had >30% potential to lower CH4 emissions. Ionophores, grazing management and feed processing were in the low group. Improving forage quality, feeding additional grain and precision feeding were in the low to medium group. Rumen inhibitors were listed in the low to high group. No items were listed only in the high group. These results provide guidance in terms of items to concentrate on at the farm level to reduce methane emissions.

Future Plans 

The number of commercial herds in the database will be expanded to increase the types of rations represented and the simple correlations run. In addition, a multiple regression approach will be used to better understand the relationships of ration components and CH4 emissions. Whole herd data will be obtained and examined to determine the proportion of the total herd CH4 emissions contributed by the various animal groups. The CNCPS program will also be used on rations at constant DMI to better understand the impact of specific ration components on CH4 emissions. These results of these will permit a more defined and targeted approach to adjusting rations to decrease CH4 emissions.

Corresponding author, title, and affiliation        

Dr. Larry E. Chase, Professor Emeritus, Dept. of Animal Science, Cornell University

Corresponding author email     

lec7@cornell.edu

Additional information               

Hristov A.N., J. Oh, J.L. Firkins, J. Dijkstra, E. Kebreab, G. Waghorn, H.P.S. Makkar, A.T. Adesogan, W. Yang, C. Lee, P.J. Gerber, B. Henderson and J.M. Tricarico. 2013. Mitigation of methane and nitrous oxide emissions from animal operations: I. Review of enteric methane mitigation options. J. Anim. Sci. 91:5045-5069.

Knapp J.R., G.L. Laur, P.A. Vadas, W.P. Weiss an d J.M. Tricarico. 2014. Enteric methane in dairy cattle production: Quantifying the opportunities and impact of reducing emissions. J. Dairy Sci. 97:3231-3261.

Acknowledgements       

This material is based upon work that is supported by the National Institute of Food and Agriculture U.S. Department of Agriculture under award number 2013-68002-20525. Any opinions, findings, conclusions, or recommendations expressed in this publication are those of the author and do not necessarily reflect the view of the U.S. Department of Agriculture.

The authors are solely responsible for the content of these proceedings. The technical information does not necessarily reflect the official position of the sponsoring agencies or institutions represented by planning committee members, and inclusion and distribution herein does not constitute an endorsement of views expressed by the same. Printed materials included herein are not refereed publications. Citations should appear as follows. EXAMPLE: Authors. 2017. Title of presentation. Waste to Worth: Spreading Science and Solutions. Cary, NC. April 18-21, 2017. URL of this page. Accessed on: today’s date.