Climate Change Mitigation and Adaptation in Dairy Production Systems of the Great Lakes

Proceedings Home | W2W Home  waste to worth 2017 logo

Purpose

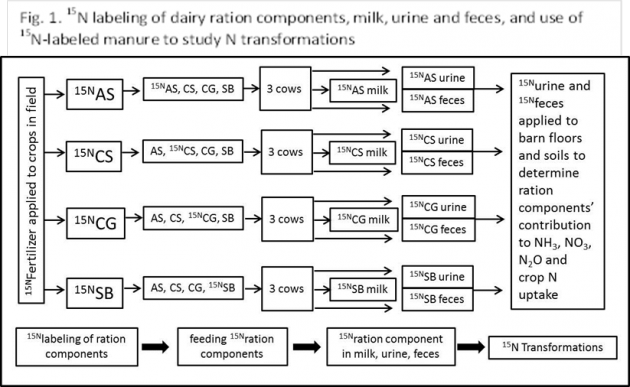
To better understand how dairy agriculture can reduce its impact on climate change, the USDA has supported a large, transdisciplinary research project to examine dairy production systems across the Great Lakes region of the United States. The goals of the Sustainable Dairy Coordinated Agricultural Project are to identify where in the life cycle of a dairy system can beneficial management practices (BMP) be applied to reduce greenhouse gases (GHG) without sacrificing productivity or profit to the farmer. Since 2013, a team of 70 researchers has been collaborating across institutions and disciplines to conduct the investigations.

What did we do?

Experimental data were collected at the cow, barn, manure, crop and soil levels from 2013-2016 by agricultural and life scientists. Modelers continue to conduct comparative analyses of process models at the animal, field and farm scales. Atmospheric scientists have down-scaled global climate models to the Great Lakes region and are integrating climate projections with process modeling results. The Life Cycle Assessment team is evaluating select beneficial management practices to identify where the greatest reduction of greenhouse gases (GHG) may occur. Results of focus groups and farmer surveys in Wisconsin and New York will help us understand how producers currently farm and what types of changes they may be willing to implement, not just to reduce emissions but to adapt to long-term changes in climate.

What have we learned?

Through the Dairy CAP grant, researchers have developed and refined the best ways to measure GHG emissions at the cow, barn, manure, crop and soil levels, and these data are archived through the USDA National Sustainable Dairy LogoAgricultural Library. Results show that the greatest levels of methane produced on a farm come from enteric emissions of the cow and changes in the diet, digestion and genetics of the cow can reduce those emissions. Another significant source of methane—manure production, storage and management—can be substantially reduced through manure management practices, particularly when it is processed through an anaerobic digester. Changes in timing of nitrogen application and use of cover crops practices are found to improve nitrogen efficiency and reduce losses from the field.

A comparative analysis of process models showed multiple differences in their ability to predict GHG emissions and nutrient flow (particularly nitrogen dynamics) at the animal, farm, and field scales. Field data collected were used to calibrate and refine several models. The Life Cycle Assessment approach shows that a combination of BMPs can reduce GHG emissions without sacrificing milk production. The application of down-scaled climate data for the Great Lakes region is being used in conjunction with the suite of BMPs to develop mitigation and adaptation scenarios for dairy farming in the Upper Midwest.

Research findings are shared through a series of fact sheets available on the project website, and a web-based, virtual farm that presents educational materials for 150- and 1500-cow operations to a variety of audiences, ranging from high school students to academics.

Future Plans

The Dairy CAP grant sunsets in 2018, but research questions remain relative to the efficacy of beneficial management practices at different stages in the life cycle of a farm. Challenges revolve around the complexity of farming practices, the individuality of each farm and how it is managed, and uncertainty associated with the predictive capabilities of models. Mitigation and adaptation strategies will be shared with the dairy industry, educators and extension partners who will be responsible for working with farmers at the field level. Implementation of these strategies will make dairy farming in the Great Lakes region more resilient.

Corresponding author, title, and affiliation

Carolyn Betz, Research Project Manager, University of Wisconsin-Madison. Department of Soil Science

Corresponding author email

cbetz@wisc.edu

Other authors

Matt Ruark and Molly Jahn

Additional information

http://www.sustainabledairy.org

http://virtualfarm.psu.edu

Acknowledgements

This material is based upon work that is supported by the National Institute of Food and Agriculture, U.S. Department of Agriculture, under award number 2013-68002-20525.

Reducing Hay Waste Associated with Outdoor Feeding of Adult Horses

Why Be Concerned with Hay Waste On Horse Farms?

Hay is commonly fed to horses and is usually the largest and most expensive dietary component for adult horses. Hay waste can occur during both storage and feeding, and can add up to ≥ 40%, depending on forage type, storage method, environment, and storage length. Horses are commonly fed large round-bales and small square-bales in outdoor paddocks; however, no research exists to characterize hay waste. The objectives were to determine hay waste and economics of small square-bale and large round-bale feeders when used in outdoor feeding of adult horses. Related: Managing Manure on Horse Farms

What did we do?

Large round- and small-square bale hay feeders were evaluated during two separate studies. photo of different bale feeders
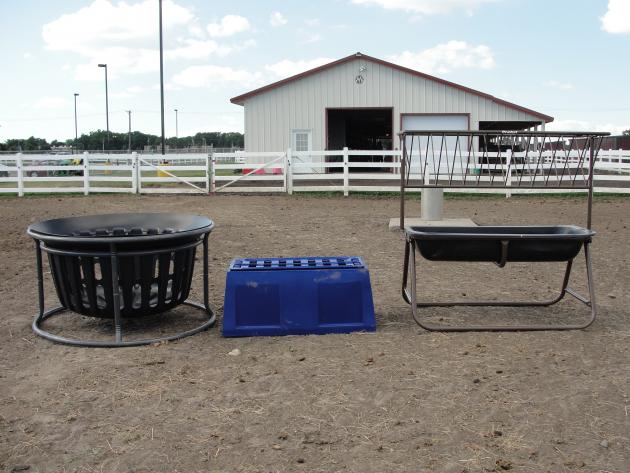
Nine round-bale feeders, were tested, including the Cinch Net ($147; Cinch Chix LLC), Cone ($1,195*; Weldy Enterprises; model R7C), Covered Cradle ($3,200; SM Iron Inc.), Hayhut ($650; Hayhuts LLS), Hay Sleigh ($425; Smith Iron Works Inc.), Ring ($300; R & C Livestock), Tombstone ($250; Dura-Built), Tombstone Saver ($650; HiQual), Waste Less ($1,450; JSI Innovations LLC), and a no-feeder control (Figure 1). Twenty-five mature horses were used to form five groups of five horses. Each feeder was placed on the ground in an outdoor dirt paddock. The groups of horses fed in rotation for four days, and every fourth day, groups were rotated to a different paddock. Waste hay (hay on the ground outside of the feeder) and orts (hay remaining inside the feeder) were collected daily. Percent hay waste was calculated as the amount of hay waste divided by the amount of hay fed minus orts. The number of months to repay the feeder cost (payback) was calculated using hay valued at $200/ton, and improved efficiency over the no-feeder control.

Three small square-bale feeders were tested, including a hayrack ($280; Horse Bunk Feeder and Hay Rack, Priefert Manufacturing), slat feeder ($349; The Natural Feeder), basket feeder ($372; Equine Hay Basket, Tarter Farm and Ranch Equipment), and a no-feeder control (Figure 1). Two feeders of each type were placed in separate, outdoor, dirt paddocks. Twelve adult horses were divided into four similar herds of three horses each and were rotated through the four paddocks, remaining in each paddock for a period of seven days. Grass hay was fed at 2.5% of the herd bodyweight split evenly between two feedings. Waste hay (hay on the ground outside of the feeder) and orts (hay remaining inside the feeder) were collected before each feeding. Percent hay waste was calculated as the amount of hay waste divided by the amount of hay fed minus orts. The number of months to repay the feeder cost (payback) was calculated using hay valued at $200/ton, and improved efficiency over the no-feeder control.

What have we learned?

No injuries were observed from any feeder types during the data collection period.

Hay waste differed between round-bale feeder designs. Mean percent waste was: Waste Less, 5%; Cinch Net, 6%; Hayhut, 9%; Covered Cradle, 11%; Tombstone Saver, 13%; Tombstone, Cone and Ring, 19%; Hay Sleigh, 33%; and no-feeder control, 57%. All feeders reduced waste compared to the no-feeder control. Feeder design affected payback. The Cinch Net paid for itself in less than 1 month; Tombstone and Ring, 2 months; Hayhut and Tombstone Saver, 4 months; Hay Sleigh, 5 months; Waste Less, 8 months; Cone, 9 months; and Covered Cradle, 19 months.

Hay waste was different between small square-bale feeder designs. Mean hay waste was 1, 3, 5 and 13% for the slat, basket, hayrack and no-feeder control, respectively. All feeders resulted in less hay waste compared with the no-feeder control. Feeder design also affected payback. The hayrack, basket, and slat feeders paid for themselves in 11, 10, and 9 months, respectively.

Future Plans

Future research investigating hay waste associated with outdoor feeding of adult horses should focus on different forage types and the optimum number of horses per feeder. Related: Small Farm Environmental Stewardship

Authors

Krishona Martinson, Associate Professor, University of Minnesota krishona@umn.edu

Amanda Grev, Research Assistant, University of Minnesota; Emily Glunk, Assistant Professor, Montana State University; William Lazarus, Professor, University of Minnesota; Julie Wilson, Executive Director, Minnesota Board of Veterinary Medicine; and Marcia

Additional information

Grev, A.M., E.C. Glunk, M.R. Hathaway, W.F. Lazarus, and K.L. Martinson. 2014. The effect of small square-bale feeder design on hay waste and economics during outdoor feeding of adult horses. Journal of Equine Veterinary Science. 34: 1,269-1,273.

Martinson, K., J. Wilson, K. Cleary, W. Lazarus, W. Thomas and M. Hathaway. Round-bale Feeder Design Affects Hay Waste and Economics During Horse Feeding. 2012. J. Anim. Sci. 90: 1047–1055.

Acknowledgements

The large round-bale feeder research was funded by a grant from the MN Horse Council and manufacturer fees. The small-square bale feeder research was funded by a grant from the American Quarter Horse Foundation.

The authors are solely responsible for the content of these proceedings. The technical information does not necessarily reflect the official position of the sponsoring agencies or institutions represented by planning committee members, and inclusion and distribution herein does not constitute an endorsement of views expressed by the same. Printed materials included herein are not refereed publications. Citations should appear as follows. EXAMPLE: Authors. 2015. Title of presentation. Waste to Worth: Spreading Science and Solutions. Seattle, WA. March 31-April 3, 2015. URL of this page. Accessed on: today’s date.

Use of zilpaterol hydrocholoride to reduce odors and gas production from the feedlot surface when beef cattle are fed diets with or without ethanol byproducts

Purpose

Many malodorous compounds emitted from the feedlot surface of beef finishing facilities result from protein degradation of feces and urine (Mackie et al., 1998; Miller and Varel, 2001, 2002). The inclusion of wet distillers grain with solubles (WDGS) in beef finishing diets has been shown to increase nitrogen excretion (Spiehs and Varel, 2009; Hales et al., 2012) which can increase odorous compounds in waste (Spiehs and Varel, 2009). Zilpaterol hydrochloride (ZH) is a supplement fed to cattle for a short period of time (21 days) near the end of the finishing phase to improve efficiency of lean gain. Improvements in feed efficiency and lean tissue accretion potentially decrease nitrogen excretion from cattle. Therefore, the use of ZH in feedlot diets, especially those containing WDGS, may reduce the concentration of odorous compounds on the feedlot surface. The objective of this study was to determine if the addition of ZH to beef f inishing diets containing 0 or 30% WDGS would decrease odor and gas production from the feedlot surface.

What did we do?

Sixteen pens of cattle (25-28 cattle/pen) were used in a 2 x 2 factorial study. Factors included 0 or 30% WDGS inclusion and 0 or 84 mg/steer daily ZH for 21 d at the end of the finishing period. Each of the four following treatment combinations were fed to 4 pens of cattle: 1) finishing diet containing 0% WDGS and 0 mg ZH, 2) finishing diet containing 30% WDGS and 0 mg ZH, 3) finishing diet containing 0% WDGS and 84 mg/animal daily ZH and 4) finishing diet containing 30% WDGS and 84 mg/animal daily ZH. A minimum of 20 fresh fecal pads were collected from each feedlot pen on six occasions. Samples were mixed within pen and a sub-sample was placed in a small wind-tunnel. Duplicate samples for each pen were analyzed. Odorous volatile organic compounds were collected on sorbent tubes and analyzed for straight-chain fatty acids, branched-chain fatty acids, aromatic compounds, and sulfide compounds using a thermal desorption-gas chromatograph-mass spectrometry (Aglient Technologies, Inc, Santa Clara, CA). Ammonia (NH3) production was measured using a Model 17i Ammonia Analyzer (Thermo Scientific, Franklin, MA), and hydrogen sulfide (H2S) was measured using a Model 450i Hydrogen Sulfide Analyzer (Thermo Scientific, Franklin, MA).

What have we learned?

Inclusion of ZH in beef finishing diets was effective in lowering the concentration of total sulfides, total branched-chain fatty acids, and hydrogen sulfide from fresh cattle feces. Inclusion of 30% WDGS to beef feedlot diets increased the concentration of odorous aromatic compounds from feces. Ammonia concentration was not affected by the inclusion of either WDGS or ZH in the finishing diet. Producers may see a reduction in odorous emissions when ZH are fed to beef finishing cattle.

Table 1. Effect of ZH and WDGS inclusion in beef feedlot diets on concentration of odorous volatile organic compounds from cattle feces

Future Plans

Additional research is planned to evaluate the use of β-agonists, such as ZH, with moderate and aggressive implant strategies. These implants may further improve feed efficiency and lean gain, thereby potentially reducing excess nutrient excretion and odorous emissions. Evaluation odorous emissions from the feedlot surface when ZH are fed is also needed.

Authors

Mindy J. Spiehs, USDA, ARS, U.S. Meat Animal Research Center, Clay Center, NE mindy.spiehs@ars.usda.gov

Kristin E. Hales, USDA, ARS, U.S. Meat Animal Research Center, Clay Center, NE

Additional information

Mention of trade names or commercial products in their article is solely for the purpose of providing specific information and does not imply recommendation or endorsement by the USDA. USDA is an equal opportunity provider and employer.

Literature cited

Hales, K. E., N. A. Cole, and J. C. MacDonald. 2012. Effects of corn processing method and dietary inclusion of wet distillers grains with solubles on energy metabolism, carbon-nitrogen balance, and methane emissions of cattle. J. Anim. Sci. 90:3174-3185.

Mackie, R. I., P. G. Stroot, and V. H. Varel. 1998. Biochemical identification and biological origin of key odor components in livestock waste. J. Anim. Sci. 76:1331-1342.\

Miller, D. N. and V. H. Varel. 2001. In vitro study of the biochemical origin and production limits of odorous compounds in cattle feedlots. J. Anim. Sci. 79:2949-2956.

Miller, D. N. and V. H. Varel. 2002. An in vitro study of manure composition on the biochemical origins, composition, and accumulation of odorous compounds in cattle feedlots . J. Anim. Sci. 80:2214-2222.

Spiehs, M. J. and V. H. Varel. 2009. Nutrient excretion and odorant production in manure from cattle fed corn wet distillers grains with solubles. J. Anim. Sci. 87:2977-2984.

Acknowledgements

The authors wish to thank Alan Kruger and Elaine Ven John for assistance with data collection.

The authors are solely responsible for the content of these proceedings. The technical information does not necessarily reflect the official position of the sponsoring agencies or institutions represented by planning committee members, and inclusion and distribution herein does not constitute an endorsement of views expressed by the same. Printed materials included herein are not refereed publications. Citations should appear as follows. EXAMPLE: Authors. 2015. Title of presentation. Waste to Worth: Spreading Science and Solutions. Seattle, WA. March 31-April 3, 2015. URL of this page. Accessed on: today’s date.

Measuring Pasture Dry Matter Intake of Horses


Why Is It Important to Accurately Measure Horse Dry Matter Intake?*

The ability to predict a horse’s rate of pasture dry matter intake (DMI) assists horse owners/managers in accounting for pasture’s contribution toward a horse’s daily nutrient requirements. Accounting for nutrients obtained from pasture improves the ability to accurately balance rations thereby preventing inefficiencies associated with over- or under- feeding nutrients. This presentation will review pasture DMI estimates for horses reported in scientific literature, sources of variation associated with the measurements, and methods used to measure pasture DMI.

Pasture dry matter intake varies considerably. Estimates for continuously grazing horses range from 1.5 to 2.5% of body weight in dry matter (DM). Factors contributing to variability in pasture DMI include herbage mass available for grazing, sward height, plant maturity, plant chemical composition, plant palatability, horse physiological status and time allowed for grazing. Dry matter intake tends to increase as pasture herbage mass increases, provided forage does not become over-mature. Sward height may also play a role in dry matter intake as it can influence harvest efficiency (e.g., bit size and rate of chewing necessary to swallow ingested forage). Level of plant maturity and sward height are also related to plant chemical composition. As plants reach maturity acid detergent fiber (ADF) and neutral detergent fiber (NDF) increase. Both ADF and NDF concentration are negatively correlated to a horse’s preference for forage. Plant nonstructural carbohydrate (NSC) has been reported to be positively correlated with horse pasture plant preference. Therefore plant chemical composition (ADF, NDF, NSC) influences horse preference and likely influences pasture DM intake. Dry matter intake is also influenced by horse physiological status. Horses having physiological states with nutrient requirements above maintenance may also have greater pasture dry matter intakes (e.g., lactating mares). Dry matter intake is also influenced by the amount of time a horse is allowed to graze. As the amount of time allowed for grazing is restricted a horse’s rate of dry matter intake increases. Therefore it is possible in some cases for horses to have restricted pasture access yet still consume a significant amount of forage DM due to an increased rate of DMI.

What Did We Do?

Several methods exist to measure pasture intake among grazing horses, yet none are perfect and all face challenges in their application. The primary methods are herbage mass difference, difference in BW pre- versus post-grazing, and marker techniques (e.g., alkanes, acid-insoluble ash etc…). Herbage mass difference measures the herbage mass prior to grazing and again following grazing. This is accomplished by harvesting multiple small forage sub-samples each having the same area (e.g., a sub-sample is harvested within a .25 m x .25 m frame at a height of 2.5 cm above the ground). The difference between pre- and post-grazing herbage mass reflects the amount of forage consumed by the horse. However, as the time between pre- and post-grazing increases, pasture re-growth contributes to error in this measurement. An additional source of error in this measurement results from variability in sub-samples used to predict pre- and post-grazing herbage mass. Therefore this met hod tends to work best in small areas where grazing takes place less than 12 h. Change in body weight during a grazing bout, corrected for fecal, urine and other water loss, is another method used to predict dry matter intake. However, this method requires an efficient means of collecting feces and urine (e.g., collection harness apparatus) and requires a livestock scale having a relatively high sensitivity. The sensitivity of many livestock scales is ± 1 kg, which can represent considerable variation for smaller intakes. Chemical markers, either inherent to the plant or provided externally, provide a means of measuring DMI in a natural grazing setting. Markers rely on the following principle: Intake = fecal output/indigestibility. Fecal output is determined by feeding a known amount of an external marker, not present in pasture plants (e.g., even-chained alkanes) and then measuring its dilution in the feces. Indigestibility is calculated as 1 – digestibility. Digestibility is determined by the ratio of a marker concentration within the plant to that in the feces. Internal markers used for estimating digestibility in horses include odd-chained alkanes and acid-insoluble ash. Marker methods provide accurate measures but are relatively expensive and require considerable care when sampling forage (e.g., the composition of forage sampled must reflect the composition of the forage consumed).

What Did We Learn?

Although each of these methods has their short comings they can provide a starting point to estimate dry matter intake. Coupling these estimates with horse performance measures (change in BW or body condition, average daily gain for growing horses) should be used in conjunction with these estimates in order to validate them and correct for their sources of error. Ultimately, these methods can be used to develop models that incorporate factors responsible for variation in DMI among horses to more accurately predict pasture intake thereby facilitating efficient use of pasture derived nutrients in feeding horses.

Author

Paul D. Siciliano is a Professor of Equine Management and Nutrition in the Department of Animal Science, North Carolina State University. He teaches classes in equine management and conducts research in the area of equine grazing management. Paul_Siciliano@ncsu.edu

Additional Information

Chavez, S.J., P.D. Siciliano and G.B. Huntington. 2014. Intake estimation of horses grazing tall fescue (Lolium arundinaceum) or fed tall fescue hay. Journal of Animal Science. 92:p.2304–2308.

Siciliano, P.D. 2012. Estimation of pasture dry matter intake and its practical application in grazing management for horses. Page 9-12 in Proc. 10th Mid-Atlantic Nutrition Conference. N.G. Zimmermann ed., Timonium, MA, March 2012.

The authors are solely responsible for the content of these proceedings. The technical information does not necessarily reflect the official position of the sponsoring agencies or institutions represented by planning committee members, and inclusion and distribution herein does not constitute an endorsement of views expressed by the same. Printed materials included herein are not refereed publications. Citations should appear as follows. EXAMPLE: Authors. 2015. Title of presentation. Waste to Worth: Spreading Science and Solutions. Seattle, WA. March 31-April 3, 2015. URL of this page. Accessed on: today’s date.

Equine Pasture Management Introduction


Purpose*

Sound grazing management strategies for horses have beneficial impacts on horse health, the environment, and the overall cost of keeping horses. This presentation explains how the fundamental principles of horse grazing behavior, horse nutrient requirements, plant chemical composition, and plant physiology are integrated in the development of sound grazing management strategies.

Why Is Pasture Management Important for Horse Operations?

Horses graze continuously and are capable of relatively large nutrient intakes in comparison with their requirements. This “wastage” of pasture nutrients has negative implications on both the cost of feeding horses and horse health. Mature horses, grazing pasture continually, consume on average 2.5% of their body weight in dry matter (DM) per day (range 1.5 to 3%). Therefore a 500 kg horse consumes approximately 12.5 kg DM/d. This level of DM intake represents a significant proportion of a horse’s daily caloric requirements.

Digestible energy (DE) content of grass pasture can range from 1.78 to 2.74 Mcal/kg DM (mean ± S.D., 2.26 ± 0.48 Mcals/kg DM; n = 6959; Dairy One, 2011). Therefore a mature 500 kg horse consuming 12.5 kg DM/d from pasture consumes 28.85 Mcals DE/d, which is 11.58 Mcals greater than required (16.67 Mcals/d). A DE intake of 20 Mcal above maintenance DE is required per kg of BW gain and an increase in 1 body condition score unit requires approximately 18 kg of body weight gain (NRC, 2007).

Given these assumptions the horse in this example would gain just under 1 body condition score unit per month, provided adequate pasture was available. The excess DE intake, and related pasture intake, in the above example is equivalent to approximately 0.7 of a grazing day (i.e., the horse consumes enough DE in 1 d to last 1.7 d). This scenario demonstrates that in some instances continuous grazing regimes, where intake is uncontrolled, can lead to excessive nutrient intake resulting in wasted resources, and contribute negatively to equine health (i.e., excess body condition). Therefore strategies that control and/or account for pasture DM intake should be implemented.

One strategy that can be used to control pasture intake is restricting the amount of time a horse has access to pasture. Restricting pasture access is accomplished by placing horses in dry-lots or by use of a grazing muzzle. It should be noted that horses may still be able to consume a significant amount of forage while wearing a grazing muzzle in place, depending on whether forage is prostrate or erect. Therefore, placing horses in a dry-lot for part of the day may be a more effective practice.

The daily amount of time allowed for grazing in order to match nutrient intake with nutrient requirements (e.g., caloric intake vs caloric requirement) varies with a horse’s physiological state. Mature idle horses, horses at light work (e.g., ridden 2 to 3 times per week), mares in early gestation (less than 5 months), breeding stallions in the non-breeding season can consume their daily DE requirement in 8 to 10 h of grazing well managed pasture (i.e., > 90% ground cover maintained at a height of > 15 cm) during the seasons where pasture is actively growing. Horses having other physiological states can graze the entire day, as pasture intake alone will not likely provide all required nutrients due to their relatively high requirements.

Horses graze selectively, given the choice, which can negatively impact a plant’s ability to re-grow and ultimately to persist. Horses tend to avoid grazing extremely mature pasture grasses, particularly those areas that are used as latrines. When areas of mature pasture grass are avoided horses concentrate grazing on less mature areas undergoing re-growth. Uneven grazing patterns can also result from horses over-grazing preferred forage in pastures that contain multiple plant species.

Horses show considerable preference toward some species (e.g, Kentucky bluegrass) as compared to others (e.g., tall fescue). The net result of uneven grazing is two-fold, wasted forage in one area and over-grazing in others. Prevention of uneven grazing and its consequences can be achieved by rotational grazing. Rotational grazing strategies allocate an area of pasture containing an amount of dry matter that will last a given number of horses 1 to 7 days and then horses are moved to a new area. This strategy forces horses to graze more uniformly.

The allocation process used in rotational grazing can also be used to limit intake to an amount that provides only the daily requirement thus preventing the problem of excessive pasture nutrient intake, such as that illustrated in the previous paragraph.

A sound grazing management plan manages grazing behavior in manner that attempts to match nutrient intake with nutrient requirements while simultaneously minimizing selective grazing and over grazing.

Authors

Paul Siciliano is a Professor of Equine Management and Nutrition in the Department of Animal Science at North Carolina State University where he teaches courses in equine management and conducts research dealing with grazing management of horses. Paul_Siciliano@ncsu.edu

Additional information

Chavez, S.J., P.D. Siciliano and G.B. Huntington. 2014. Intake estimation of horses grazing tall fescue (Lolium arundinaceum) or fed tall fescue hay. Journal of Animal Science. 92:p.2304–2308.

Bott, R.C., Greene, E.A., Koch, K., Martinson, K.L., Siciliano, P.D., Williams, C., Trottier, N.L., Burke, A., Swinker, A. 2013. Production and environmental implications of equine grazing. J. Equine Vet. Sci. 33(12):1031-1043.

Glunk, E.C., Pratt-Phillips, SE and Siciliano, P.D. 2013. Effect of restricted pasture access on pasture dry matter intake rate, dietary energy intake and fecal pH in horses. J. of Equine Vet. Sci. 33(6):421-426.

Dowler, L.E., Siciliano, P.D., Pratt-Phillips, S.E., and Poore, M. 2012. Determination of pasture dry matter intake rates in different seasons and their application in grazing management. J. Equine Vet. Sci. 32(2):85-92.

Siciliano, P.D. and S. Schmitt. 2012. Effect of restricted grazing on hindgut pH and fluid balance. J. Equine Vet. Sci. 32(9):558-561.

Siciliano, P.D. 2012. Estimation of pasture dry matter intake and its practical application in grazing management for horses. Page 9-12 in Proc. 10th Mid-Atlantic Nutrition Conference. N.G. Zimmermann ed., Timonium, MA, March 2012.

The authors are solely responsible for the content of these proceedings. The technical information does not necessarily reflect the official position of the sponsoring agencies or institutions represented by planning committee members, and inclusion and distribution herein does not constitute an endorsement of views expressed by the same. Printed materials included herein are not refereed publications. Citations should appear as follows. EXAMPLE: Authors. 2015. Title of presentation. Waste to Worth: Spreading Science and Solutions. Seattle, WA. March 31-April 3, 2015. URL of this page. Accessed on: today’s date.

Effect of Grazing Cell Size on Horse Pasture Utilization


Purpose *

Horses grazing continuously within a single pasture often graze selectively resulting in under- and over-grazed areas. The net result is inefficient use of forage and/or eventually loss of ground cover. This practice contributes negatively to pasture health and the environment. Rotational grazing can alleviate this problem by forcing horses to be less selective due to constraints on space and time allowed for grazing. It is generally accepted that grazing cells should be sized to provide enough forage for no more than 7 d in order to prevent selective grazing. However, little information is available to definitively confirm this maximum residence time. If the residence time could be increased to greater than 7 d by increasing the size of the grazing cell without the occurrence of selective grazing then labor inputs associated with reconstructing fences and moving horses could be reduced. A reduction in labor might also contribute to an increased acceptance of this practice among horse owners and managers. Therefore a study was designed to compare effect of increasing residence time by increasing grazing cell size on the level of grazing uniformity.

What did we do? 

A predominately tall fescue pasture (approximately 1.5 ha; Lolium arundinaceum Schreb cultivar Max-Q; Pennington Seed, Madison, GA) was divided into four equal sub-plots (approximately 0.37 ha). Eight mature geldings (approximately 500 kg; 9.75 ± 4.4 yr) were paired and randomly assigned to one of two grazing regimes within subplots as follows to determine the effect of residence time and grazing cell size on pasture characteristics reflecting uniformity of grazing: 1) single large grazing cell (SLGC) where horses had access to the entire 0.37 ha subplot for 21-d, or 2) multiple small grazing cells (MSGC) where horses had access to approximately one-third (0.123 ha) of the 0.37 ha subplot for 7 d and were then moved to the next adjacent one-third of the subplot every 7-d for a total of 21-d. Subplot size was estimated to contain enough DM to support DM intake of 2.4% of BW/d for 21 d assuming a grazing efficiency of 0.7. Pasture herbage mass, sward height, compressed sward height and percent ground cover were determined on d-0 and d-21within each sub-plot. The percent compressed sward height below 5 cm within each subplot was used as an estimate of “over-grazed” area. Response variables were analyzed as a repeated measures design for treatment, time and treatment x time interactions. A P-value of 0.05 was considered significant; whereas a P-value of 0.1 was considered a tendency.

What have we learned? 

Pasture herbage mass, sward height, compressed sward height and percent ground cover were not affected by treatment or treatment time interactions. Pasture herbage mass tended to decrease over time (P = 0.08). Sward height and compressed sward height decreased over time (P < 0.05). Percentage of compressed sward height below 5 cm tended to increase at a greater rate within MSGC as compared to SLGC (P = 0.07). Results of this study suggest that sizing grazing cells for longer residence times is feasible and that sizing grazing cells for a shorter residence time requires more management to insure overgrazing does not occur.

Future Plans    

Although the results of this study suggests that two horses can graze a 0.37 ha area containing enough dry matter to facilitate 2.4% of BW intake (assuming a grazing efficiency of 0.7); it is unknown how increasing the stocking rate (and related grazing cell size) will affect uniformity of grazing. Future experiments will investigate this question.

Authors      

Paul D. Siciliano, Professor, Dept. of Animal Science, North Carolina State University Paul_Siciliano@ncsu.edu

Jennifer Gill, Department of Animal Science, North Carolina State University

Additional information               

Bott, R.C., Greene, E.A., Koch, K., Martinson, K.L., Siciliano, P.D., Williams, C., Trottier, N.L., Burke, A., Swinker, A. 2013. Production and environmental implications of equine grazing. J. Equine Vet. Sci. 33(12):1031-1043.

Acknowledgements      

This project was supported by the North Carolina Agricultural Research Service.

The authors are solely responsible for the content of these proceedings. The technical information does not necessarily reflect the official position of the sponsoring agencies or institutions represented by planning committee members, and inclusion and distribution herein does not constitute an endorsement of views expressed by the same. Printed materials included herein are not refereed publications. Citations should appear as follows. EXAMPLE: Authors. 2015. Title of presentation. Waste to Worth: Spreading Science and Solutions. Seattle, WA. March 31-April 3, 2015. URL of this page. Accessed on: today’s date.

How much of the nitrogen contained in dairy ration components is partitioned into milk, manure, crops and environmental N loss?

Purpose

Of the total nitrogen (N) consumed by dairy cows on confinement farms (cows fed in barns), a general range of 20% to 35% is secreted in milk and the remaining N is excreted in manure. The N contained in manure is either recycled through crops after field application, or lost to the environment. To better understand the synergistic nature of feed N and manure N management and environmental N loss from dairy farms, a series of cow, laboratory and field experiments (Figure 1) was undertaken to quantify the relative amounts of N contained in individual ration components that are secreted in milk, excreted in urine and feces, taken up by crops after manure application to soil, and lost as ammonia (NH3) and nitrous oxide (N2O) from dairy barns and soils.

What did we do?

Alfalfa silage, corn silage, corn grain and soybeans were enriched in the field with the stable isotope 15N. Each 15N-enriched component was then fed individually (soybeans were solvent-extracted and the resultant soybean meal was fed) to twelve mid-lactation cows (3 cows per 15N-enriched ration component) as part of a total mixed ration (TMR). The masses of milk, urine and feces produced by each cow were recorded and sampled during the 4 day 15N feeding period, and for 3 days thereafter. This presentation will provide information on the 15N enrichment level of each ration component, the relative amount of each consumed component’s 15N that was secreted in milk and excreted in feces and urine. We will also present the results of a field trial that measured the relative contribution of each ration component’s manure N to corn N uptake during the first and second year after manure application. We will end with explanation of some of the experimental procedures we will use for measuring gaseous N losses after manure applications to barn floors and soils.

Fig. 1. 15N labeling of dairy ration components, milk, urine and feces, and use of 15N-labeled manure to study N transformations

What have we learned?

Here we present some preliminary information on 15N labeling of ration components, the TMR that was fed, and some animal responses. Concentrations of fiber, total N and 15N in the ration components are provided in Table 1.

Table. 1. Concentrations of neutral detergent fiber (NDF), total N (TN) and 15N in ration components fed to dairy cows

Highest 15N incorporation was achieved with corn (silage and grain) and lowest with alfalfa and soybean. This was due to 15N dilution by the atmospherically-fixed N by these legumes. The methods we used to ensile the 15N-enriched corn and alfalfa, the milling of 15N-enriched corn grain and the extraction of 15N-enriched soybeans to produce soybean meal did not appear to impact TMR intake, milk production or N excretion by dairy cows, as indicated by the narrow range (and non-significant differences among TMR containing the 15N-enriched components) in dry matter intake, N intake, milk production, dietary N use efficiency (relative amount of N intake secreted as milk N) and N excretion in urine, urea and feces (Table 2).

Table. 2. Range dry matter intake (DMI), N intake (NI), milk production, dietary N use efficiency (DNUE) and N excretion by 12 cows fed rations containing 15N-enriched components

Future Plans

Feces and urine from each 15N enriched ration component will be applied to laboratory emission chambers that simulate barn floors and field soil surfaces, and 15NH3, 15NH4 15NO3 and 15N2O will be measured. Manure-soil incubations, greenhouse and field trials are underway to determine each ration N component contribution to crop N uptake.

Authors

J. Mark Powell, Soil Scientist, USDA-ARS US Dairy Forage Research Center mark.powell@ars.usda.gov

Tiago Barros, Marina Danes, Matias A. Aguerre and Michel A. Wattiaux Dep. Dairy Sci., University of Wisconsin, Madison, Wisconsin USA


The authors are solely responsible for the content of these proceedings. The technical information does not necessarily reflect the official position of the sponsoring agencies or institutions represented by planning committee members, and inclusion and distribution herein does not constitute an endorsement of views expressed by the same. Printed materials included herein are not refereed publications. Citations should appear as follows. EXAMPLE: Authors. 2015. Title of presentation. Waste to Worth: Spreading Science and Solutions. Seattle, WA. March 31-April 3, 2015. URL of this page. Accessed on: today’s date.

Rotational Grazing Effects on Pasture Nutrient Content


Why Look at Rotations Grazing in Horse Pastures?

Rotational grazing is a recommended strategy to improve pasture health and animal performance. Previous studies have reported improved forage quality in rotationally grazed pastures compared to those continuously grazed by cattle, but data are limited for horse pastures.

What did we do?

A study at the University of Tennessee was conducted to evaluate the effects of rotational grazing on the nutrient content of horse pastures. A 2.02 ha rotational grazing pasture (RG) and a 2.02 ha continuous grazing pasture (CG) were each grazed by three adult horses at a stocking rate of 0.6 ha/horse over a two year period. The RG system was divided into four 0.40 ha paddocks and a heavy use area. Pastures were maintained at uniform maximum height of 15 to 20 cm by mowing. Horses were rotated between the RG paddocks every 10 to 14 d, or when forage was grazed to a height of approximately 8 cm. Pasture forage samples (n = 520) were collected and composited monthly (n = 14) during the growing season (April to November) by clipping forage from randomly placed 0.25 m2 quadrates from RG and CG, as well as before and after grazing each RG paddock. Botanical composition and percent ground cover were visually assessed. Forage samples were oven dried at 60°C in a forced air oven for 72 h to determine DM. Forage biomass yield (kg/ha), digestible energy (DE, Mcal/kg), crude protein (CP), acid detergent fiber (ADF), neutral detergent fiber (NDF), lignin, calcium (Ca), phosphorous (P), potassium (K), magnesium (Mg), ash, fat, water soluble carbohydrates (WSC), sugar and fructan were measured using a FOSS 6500 near-infrared spectrometer. Data were analyzed using paired T-tests and differences were determined to be significant at P < 0.05. Data are reported as means ± SEM as a percent of DM.

What have we learned?

Table 1. Nutrient content of continuously grazed (CG) pasture and rotationally grazed (RG) pasture. Data are summarized as means ± SE.
Nutrient Continuous Rotational
DM, % 91.72 ± 0.36 91.89 ± 0.34
DE, Mcal/kg 2.31 ± 0.064 2.42± 0.039*
CP, % 14.92 ± 0.77 15.79 ± 0.64
ADF, % 33.16 ± 1.21 30.81 ± 0.82*
NDF, % 56.80 ± 1.75 53.53 ± 1.65*
Lignin, % 3.47 ± 0.38 2.88 ± 0.32*
Ca, % 0.69 ± 0.11 0.68 ± 0.11
P, % 0.25 ± 0.009 0.27 ± 0.008*
K, % 1.92 ± 0.10 2.11 ± 0.087*
Mg, % 0.25 ± 0.009 0.26 ± 0.007
Ash, % 9.35 ± 0.83 9.39 ± 0.66
Fat, % 2.65 ± 0.12 2.83 ± 0.08
WSC, % 4.95 ± 0.60 6.72 ± 0.71*
Sugar, % 3.33 ± 0.50 4.86 ± 0.55*
Fructan, % 1.61 ± 0.15 1.59 ± 0.16
*means within rows differ; P < 0.05

Forage biomass yield did not differ between RG and CG (2,125 ± 52.2; 2,267 ± 72.4 kg/ha, respectively). The percentage of grass species was greater in RG compared to CG (81.7 ± 3.9; 73.9 ± 4.5, respectively) and the percentage of weed species was lower in RG compared to CG (3.4 ± 0.8; 12.0 ± 1.5, respectively). Tall fescue, kentucky bluegrass, bermudagrass and white clover were the dominant forage species. Rotational grazing increased forage quality compared to continuous grazing. The RG system was higher in DE (Mcal/kg), phosphorous (P), potassium (K), water soluble carbohydrates (WSC), and sugar compared to the CG system (Table 1). While there wasn’t a significant difference in crude protein (CP) content between RG and CG, the numerical difference could potentially affect animal performance. The RG pasture was lower in acid detergent fiber (ADF), neutral detergent fiber (NDF) and lignin compared to the CG pasture. Within the RG pasture, forage nutrient content declined following a grazing period, but recovered with rest. Paddocks were lower in DE, CP, P, K, Fat, WSC and sugar while they were higher in ADF and NDF after grazing compared to before grazing (Table 2).

Table 2. Nutrient content of rotational grazing (RG) paddocks before and after grazing. Data are summarized as means ± SE.
Nutrient Before After
DM, % 91.84 ± 0.27 91.84 ± 0.39
DE, Mcal/kg 2.34 ± 0.03 2.21 ± 0.02*
CP, % 14.98 ± 0.39 13.71 ± 0.43*
ADF, % 32.24 ± 0.54 34.33 ± 0.48*
NDF, % 55.97 ± 0.88 59.24 ± 0.89*
Lignin, % 2.79 ± 0.20 3.41 ± 0.25*
Ca, % 0.58 ± 0.05 0.59 ± 0.05
P, % 0.28 ± 0.004 0.25 ± 0.006*
K, % 2.11 ± 0.08 1.72 ± 0.07*
Mg, % 0.26 ± 0.007 0.26 ± 0.009
Ash, % 8.76 ± 0.19 8.79 ± 0.21
Fat, % 2.64 ± 0.05 2.45 ± 0.06*
WSC, % 6.05 ± 0.47 4.85 ± 0.39*
Sugar, % 4.40 ± 0.38 3.22 ± 0.30*
Fructan, % 1.67 ± 0.15 1.69 ± 0.16
*means within rows differ; P < 0.05

Future Plans

Rotational grazing may be a preferred alternative to continuous grazing as it favors grass production, suppresses weeds and increases energy and nutrient content of pastures. While rotational grazing may be beneficial from an environmental and animal production standpoint, an increase in DE and WSC may pose a risk for horses prone to obesity and metabolic dysfunction. Appropriate precautions should be taken in managing at risk horses under rotational grazing systems. This work is being continued at Virginia Tech and other universities to further understand the use of rotational grazing systems for horses.

Authors

Bridgett McIntosh, Equine Extension Specialist, Virginia Tech bmcintosh@vt.edu

Matt Webb, Ashton Daniel, David McIntosh and Joe David Plunk, University of Tennessee

Additional information

http://www.arec.vaes.vt.edu/middleburg/

Acknowledgements

The authors thank the University of Tennessee Middle Tennessee Research and Education Center and the Tennessee Department of Agriculture’s Nonpoint Source Pollution 319 Water Quality Grant for their support of this project.

The authors are solely responsible for the content of these proceedings. The technical information does not necessarily reflect the official position of the sponsoring agencies or institutions represented by planning committee members, and inclusion and distribution herein does not constitute an endorsement of views expressed by the same. Printed materials included herein are not refereed publications. Citations should appear as follows. EXAMPLE: Authors. 2015. Title of presentation. Waste to Worth: Spreading Science and Solutions. Seattle, WA. March 31-April 3, 2015. URL of this page. Accessed on: today’s date.

Evaluation of Feed Storage Runoff Water Quality and Recommendations on Collection System Design

Why Study Silage Leachate?

Silage storage is required for many livestock and poultry facilities to maintain their animals throughout the year.  While feed storage is an asset which allows for year round animal production systems, they can pose negative environmental impacts due to silage leachate and runoff.  Silage leachate and runoff have high levels of oxygen demand and nutrients (up to twice the strength of animal manure), as well as a low pH posing issues to surface waters when discharged.  Although some research exists which shows the potency of silage leachate and runoff, little information is available to guide the design of collection, handling, and treatment facilities to minimize the impact to water quality.  Detailed information to characterize the strength of the runoff through a storm is needed to develop collection systems which segregate runoff to the appropriate handling and treatment system based on the strength of the waste. 

What did we do?

In order to evaluate collection designs, we evaluated six bunker silage storage systems in Wisconsin.  Runoff from these systems was collected using automated samplers throughout one year to assess water quality for nutrients (nitrogen and phosphorus species), oxygen demand, total solids, and pH.  Flow rate for each system was also recorded along with weather data including precipitation information.  Feed quantity and quality was also recorded at each site to have a better understanding of the impact of silage management on water quality.  Data was analyzed to determine flow weighted average runoff concentrations for pollutants measured, seasonality and feed impacts to water quality, storage design impacts, the presence or absence of first flush conditions, total loading, and evaluated to make collection design recommendations.

What have we learned?

Flow rate, timing of ensiling of forage, site bunker design, and amount of litter present were determined to influence silage runoff concentrations.  Leachate collection played a significant role in water quality as the runoff from the site without leachate collection had a lower average pH (4.64) and higher COD values (5,789 mg L-1) than the sites with leachate collection (6.09 and 5.54 pH, and 1,296 and 3,318 mg L-1 COD).  Nutrients were also higher for the site without leachate collection TP (83 mg L-1), NH3 (68 mg L-1), and TKN (222 mg L-1) compared to TP (29 and 63 mg L-1), NH3 (25 and 48 mg L-1), and TKN (184 and 215 mg L-1) for the sites with leachate removal. Time of ensilage also played an important role in water quality with increased losses occurring within two weeks of ensilage.  The most important finding for the design of treatment systems was that the water quality parameters (including nutrients) were found to be negatively correlated with flow.   The resulting effect is that the storms hydrograph has a significant impact on the pollutant loading to the surrounding waterways.  It was also found that loading was relatively linear throughout each storm event indicating that there is no first flush phenomenon which is found to occur with urban runoff systems.  Therefore designing systems to collect the initial runoff from a system is not an efficient way to capture the greatest pollutant load.  It was found that low flows throughout a storm have high pollutant concentrations and collecting low flows throughout a storm would result in the greatest load collected per unit volume.

Future plans

The next phase of this research will be to develop loading recommendations to filter strips for sizing and minimizing impact to the environment.

Corresponding author

Rebecca Larson, Assistant Professor and Extension Specialist, Biological Systems Engineering, University of Wisconsin-Madison ralarson2@wisc.edu

Mike Holly, Eric Cooley, Aaron Wunderlin

Additional information

Published paper is currently in review and will be available within the next year.

Acknowledgements

Wisconsin Discovery Farms

Case Study of Contaminated Compost: Collaborations Between Vermont Extension and the Agency of Agriculture to Mitigate Damage Due to Persistent Herbicide Residues

Why Study Herbicide Contamination of Compost?

Picloram, clopyralid, aminopyralid and aminocyclopyrochlor are broadleaf herbicides commonly used in pastures due to effectiveness in controlling undesirable plants and the very low toxicity for animals and fish. In fact, some of these herbicides do not require animal removal post application. The grazing animals can ingest treated leaves with no ill health effects, but may pass the herbicides through to the manure. Also see: Composting Livestock or Poultry Manure

When a complaint driven problem of damaged tomatoes and other garden crops in Vermont was traced back to a single compost provider in Chittenden County in Vermont, a series of actions and reactions commenced. Complaints were fielded and investigated by personnel from the Vermont Agency of Agriculture, Food and Markets (VT-AG) and the University of Vermont Extension (UVM-EXT). The compost provider sent samples of various components of the compost to a single laboratory and received positive results for persistent herbicides in sources of equine bedding/manure components. Subsequent interviews by the facility manager in both print and television media seemed to cast blame on Vermont equine operations for ruining Vermont gardens. Coincidentally, the composter had recently changed compost-processing methods. Initial samples sent to a separate laboratory did not support the composter’s laboratory results. Samples of feed, manure, shavings, and many other components which were shipped to several laboratories by VT-AG, resulted in extremely inconsistent and/or contradictory data between laboratories running the exact same samples.

Related: Small Farm Environmental Stewardship or Managing Manure on Horse Farms

What did we do? 

Several processes were underway by several agencies in a coordinated and collaborative effort to resolve and mitigate the herbicide issues:

• Vermont Agency of Agriculture, Food and Markets was receiving and investigating complaints.

• University of Vermont Extension plant biology personnel were identifying, documenting, and sampling affected plants, as well as counseling gardeners.

• University of Vermont equine extension worked with horse owners and media to mitigate unsubstantiated claims of “horses poisoning garden plants”.

• A more thorough investigation by VT-AG involved collection of raw samples (feed, hay, shavings, manure) from 15 horse farms who utilized the compost facility to dispose of manure and bedding.

• The VT Secretary of Agriculture and the VT-AG Agri-chemical Management Section Chief were brought together with equine and compost experts attending the NE-1041 Equine Environmental Extension Research group annual meeting hosted by UVM equine extension.

• VT-AG worked with herbicide manufacturers to use high quality testing equipment and procedures to gather consistent data from samples.

What have we learned? 

More extensive details of this particular case have been published in the Journal of NACAA (http://www.nacaa.com/journal/index.php?jid=201).

• The levels of persistent herbicides were low enough that they were below the acceptable limits for water, yet they still harmed sensitive garden plants.

• Nationally and locally manufactured grains tested positive for persistent herbicides; most likely due to the individual components being treated within legal limits during field production.

• Many of the laboratories were unable to provide accurate or consistent results when testing for the persistent herbicides.

• Discussions between the NE-1041 group and VT-AG resulted in a fruitful exchange of information, as well as development and delivery of pertinent information for the general public and County Agricultural Agents.

Future Plans 

Several proactive activities have already been initiated and/or completed. A peer reviewed case study on all aspects of the contaminated compost has been published in the Journal of NACAA; and two episodes of Vermont’s Agricultural television show (Across the Fence) were created to educate and update the general public on the situation. A Vermont compost working group has been assembled and set goals to create potential educational materials including a horse owner pamphlet (in final editing phase), a farmer/livestock pamphlet, and press releases for the public education on challenges with persistent herbicides. The VT-AG website has a Compost FAQs page addressing the most common questions associated with compost and herbicides.

Authors

Betsy Greene, Professor/Extension Equine Specialist, University of Vermont Betsy.Greene@uvm.edu

Carey Giguere, Agrichemical Management,Vermont Agency of Agriculture

Rebecca. Bott, Extension, South Dakota State University

Krishona. Martinson, Extension, University of Minnesota

Ann Swinker, Extension, Penn State University

Additional information

• Greene, E.A., R.C. Bott, C. Giguere, K.L. Martinson, and A.W. Swinker. 2013. “Vermont Horses vs. Twisted Tomatoes: A Compost Case Study. J of NACAA. 6:1 (http://www.nacaa.com/journal/index.php?jid=201)

• Vermont Agency of Agriculture, Food and Markets Compost FAQ’s: http://agriculture.vermont.gov/node/696

• Davis, J. Dept. of Horticultural Science, NC State University. 2010. Herbicides in Manure: How Does It Get there and why Should I Care?, Proceedings 8th Annual Mid-Atlantic Nutrition Conference, Timonium, MD. pp 155-160.

• Across the Fence Television Show: An Update on Green Mountain Compost Contamination and Testing-Greene/ Gigliuere (9/14/12)

• Across the Fence Television Show: Information from NE 1041 Meetings and National Equine Specialists-Greene (9/17/12)

• Article from Minnesota Extension explaining the problem in hay and how to avoid it. The article is devoted to “ditch hay”, but the information is relevant to all hay. https://extension.umn.edu/horse-nutrition/managing-herbicides-ditch-forages

• Washington State University Web site on clopyralid carryover includes pictures of affected vegetables, research results, and the bioassay protocol http://www.puyallup.wsu.edu/soilmgmt/Clopyralid.htm

• Dow Agrosciences United Kingdom website with information on aminopyralid: http://www.manurematters.co.uk/

• CDMS Agro-chemical database with access to all the herbicide labels: http://www.cdms.net/LabelsMsds/LMDefault.aspx?t

Acknowledgements

The State University Extension Equine Specialists that make up the NE-1441: Environmental Impacts of Equine Operations, Multi-State Program. USDA.

The authors are solely responsible for the content of these proceedings. The technical information does not necessarily reflect the official position of the sponsoring agencies or institutions represented by planning committee members, and inclusion and distribution herein does not constitute an endorsement of views expressed by the same. Printed materials included herein are not refereed publications. Citations should appear as follows. EXAMPLE: Authors. 2015. Title of presentation. Waste to Worth: Spreading Science and Solutions. Seattle, WA. March 31-April 3, 2015. URL of this page. Accessed on: today’s date.